. 2021 Feb 25;11(1):4549.
doi: 10.1038/s41598-021-83952-0.

SPARC coordinates extracellular matrix remodeling and efficient recruitment to and migration of antigen-specific T cells in the brain following infection

Affiliations

SPARC coordinates extracellular matrix remodeling and efficient recruitment to and migration of antigen-specific T cells in the brain following infection

Kathryn E McGovern et al. Sci Rep. .

Abstract

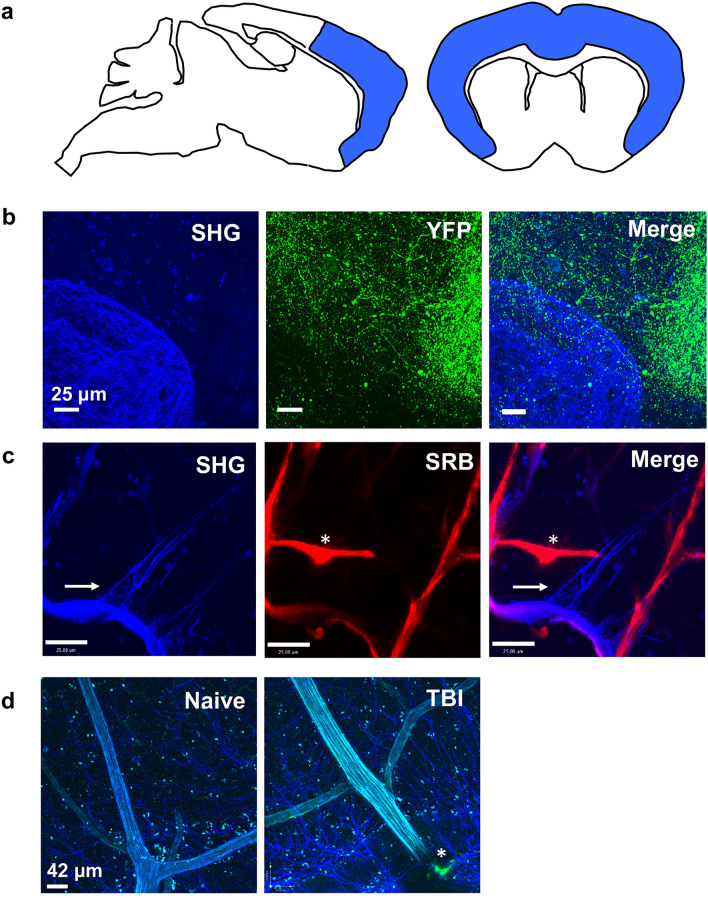
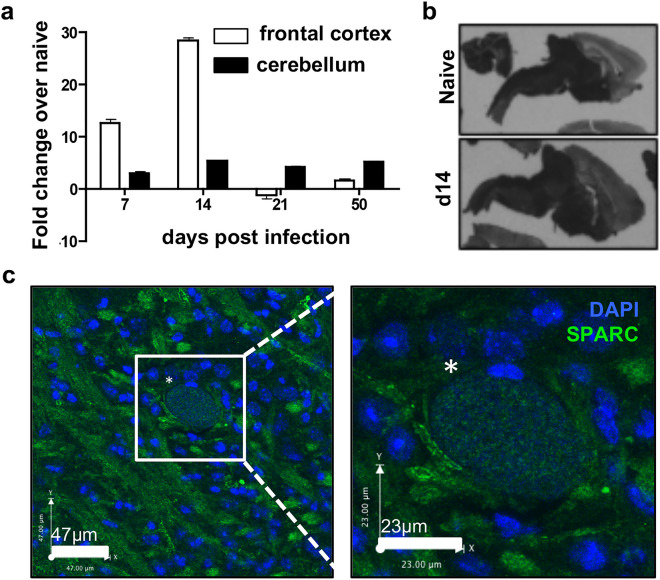
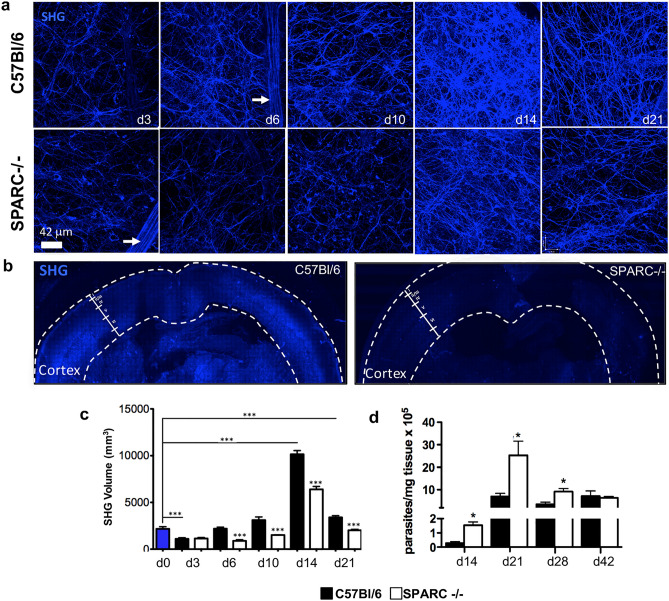
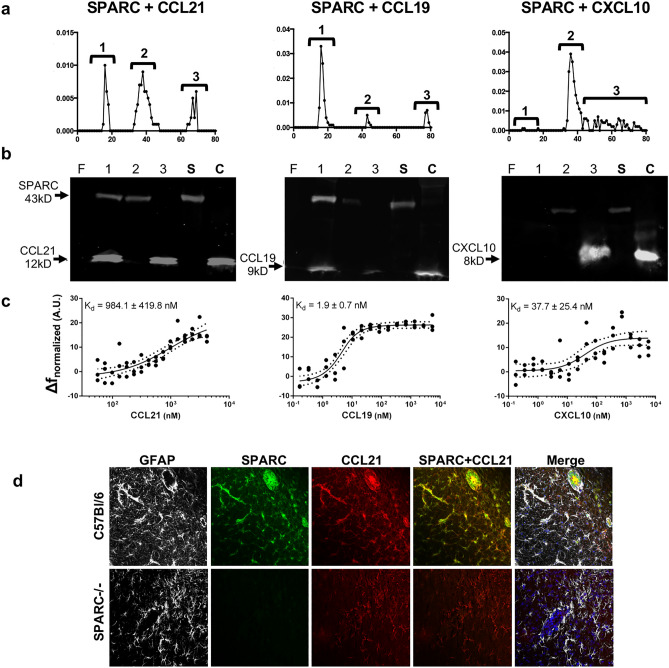
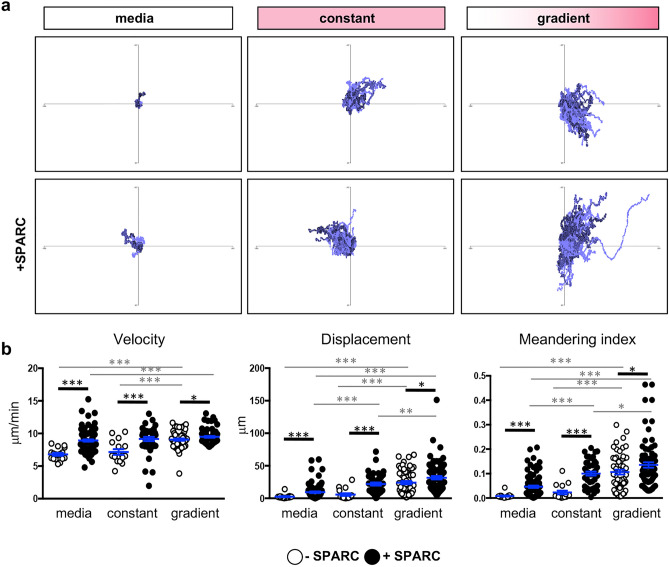
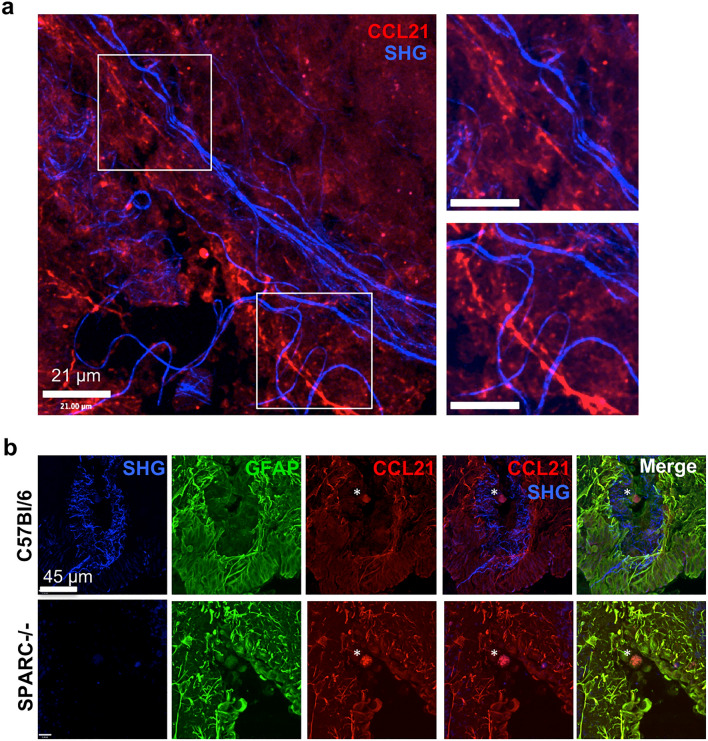
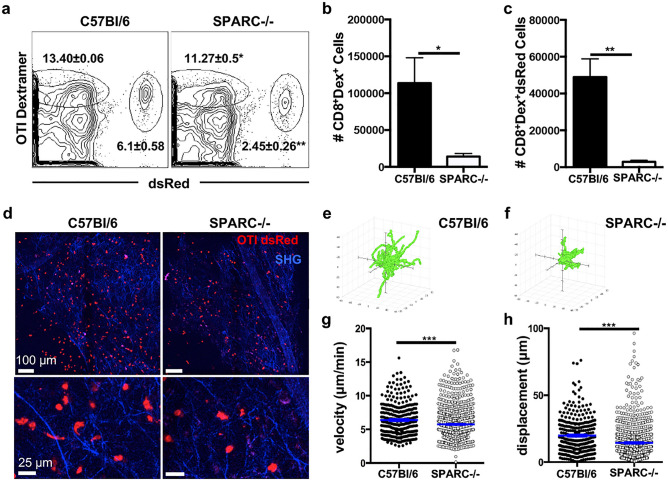
Central nervous system (CNS) injury and infection can result in profound tissue remodeling in the brain, the mechanism and purpose of which is poorly understood. Infection with the protozoan parasite Toxoplasma gondii causes chronic infection and inflammation in the brain parenchyma. Control of parasite replication requires the continuous presence of IFNγ-producing T cells to keep T. gondii in its slowly replicating cyst form. During infection, a network of extracellular matrix fibers, revealed using multiphoton microscopy, forms in the brain. The origin and composition of these structures are unknown but the fibers have been observed to act as a substrate for migrating T cells. In this study, we show a critical regulator of extracellular matrix (ECM) remodeling, Secreted Protein, Acidic, Rich in Cysteine (SPARC), is upregulated in the brain during the early phases of infection in the frontal cortex. In the absence of SPARC, a reduced and disordered fibrous network, increased parasite burden, and reduced antigen-specific T cell entry into the brain points to a role for SPARC in T cell recruitment to and migration within the brain. We also report SPARC can directly bind to CCR7 ligands CCL19 and CCL21 but not CXCL10, and enhance migration toward a chemokine gradient. Measurement of T cell behavior points to tissue remodeling being important for access of immune cells to the brain and facilitating cellular locomotion. Together, these data identify SPARC as an important regulatory component of immune cell trafficking and access to the inflamed CNS.


Conflict of interest statement

The authors declare no competing interests.

Figures

Figure 1
Figure 1
Parenchymal SHG signal is distinct from neurons and brain vasculature. (a) All imaging, multiphoton and confocal, focused on the frontal cortex of the mouse brain, highlighted in blue. (b) Thy1.1-YFP reporter mice were infected with Pru-OVA for 14 days before fresh (unfixed) brains were imaged using multiphoton microscopy to visualize fluorescent neurons (green) and SHG signal (blue). (c) Similarly, C57Bl/6 mice infected with Pru-OVA for 14 days were injected with the fluorescent dye SRB (red) i.v. 30 min prior to multiphoton imaging to distinguish the parenchymal SHG signal (blue) from that generated by collagen rich blood vessels. (d) SHG signal (blue) in naïve mice and following traumatic brain injury. Green fluorescence (*) indicates vascular leakage of FITC Dextran at injury site. For all panels, 30 μm z-stacks were collected in areas of the frontal cortex from fresh tissue explants. Images are representative of at least 2 individual experiments where n = 3 mice.
Figure 2
Figure 2
Expression of SPARC in the CNS during chronic T. gondii infection. (ac) C57Bl/6 mice were infected with the Me49 strain of T. gondii and sacrificed at various timepoints. (a) Frontal cortex and cerebellum of infected brains were removed at days 7, 14, 21, and 50 post-infection. RNA was isolated, reverse transcribed and analyzed for levels of SPARC transcripts using qRT-PCR. Results are shown as fold change over naïve normalized to HPRT. n = 3 mice per group. Data are represented as mean ± SEM. (b) Brains were removed from naïve and 14 day infected mice. In-situ hybridization was performed on brain slices with probes specific to SPARC mRNA. (c) Confocal fluorescence microscopy of 20 μm brain slices taken from mice at 3 weeks post infection. Image and inset show a parasite cyst (*) identified by punctate DAPI (blue) stain surrounded by parenchymal SPARC (green).
Figure 3
Figure 3
SPARC−/− mice have compromised reticular fiber network in the brain during chronic T. gondii infection. C57Bl/6 and SPARC−/− mice were infected and sacrificed at 3, 6, 10, 14, and 21 days following infection. Brains were removed and imaged on a multiphoton microscope for second harmonic generation (SHG) signal. (a) 30 μm z-stacks were obtained at various locations of the cortex. 3D images were compiled and reticular fibers were analyzed for volume (c). Blood vessels (white arrows) were excluded from analysis. (b) Brains were excised from mice at 14 days post infection and images of whole coronal sections were generated by stitching overlapping Z stacks collected over the entire section. (d) C57Bl/6 and SPARC−/− mice were infected and sacrificed at 14, 21, 28, and 42 days following infection. DNA was isolated from the brain and analyzed for parasite burden using qPCR. Results are displayed as parasites per mg tissue. Data are representative of at least 2 individual experiments with a minimum of n = 4 mice per group and are represented as mean ± SEM. Volumes and parasite burden were analyzed using the student’s T test, ***p < 0.001.
Figure 4
Figure 4
SPARC interacts directly with CCR7 ligands. Recombinant SPARC was incubated with CCL21, CCL19, CXCL10, or BSA (shown in Supplementary Fig. S2) and the mixture and applied to a Sephadex G-50 column. (a) The elution profiles (SPARC + CCL21; SPARC + CCL19; SPARC + CXCL10) are annotated to show which fractions were pooled and subjected to western blot. (b) Results from western Blots (SPARC + CCL21; SPARC + CCL19; SPARC + CXCL10) are shown under their respective elution profiles. (c) Thermophoretic plots (SPARC + CCL21; SPARC + CCL19; SPARC + CXCL10) are shown under their respective western blots. Values presented are the calculated dissociation constants ± SEM. The y-axis illustrates the thermophoretic response as observed by a change in normalized fluorescence in arbitrary units. Dotted lines illustrate the 95% confidence interval for the fit from non-linear regression. (d) Immunohistochemistry of chronically infected C56Bl/6 and SPARC−/− mice were incubated with antibodies to GFAP (white), SPARC (green), and CCL21 (red).
Figure 5
Figure 5
T cell migration is enhanced in the presence of SPARC in vitro. dsRed+ T cells were seeded in matrigel in the presence or absence of SPARC and the presence or absence of recombinant CCL21. Cell migration was imaged over 20 min in response to no chemokine, a constant concentration of chemokine, or a chemokine gradient. Videos of cell migration were analyzed. (a) Tracks of T cells migrating in response to media alone, a constant chemokine field, or in response to a gradient of CCL21 were normalized to begin at the origin to visualize migration trends. (b) Cell velocity, displacement, and meandering index were quantified using Volocity software and migration data was analyzed using the Mann–Whitney test. Data are representative of at least 2 individual experiments and are represented as mean ± SEM. Thick black lines indicate comparisons + / − SPARC, thin grey lines indicate comparison + / − chemokine. To simplify, only significant comparisons are annotated *p < 0.05, ***p < 0.001.
Figure 6
Figure 6
CCL21 and SHG are distinct. Flash frozen C57Bl/6 and SPARC−/− tissue sections from mice infected for 21 days were stained and imaged using multiphoton microscopy to visualize second harmonic signals found in layers 5/6 in the cortex. (a) CCL21 (red) SHG (blue). Insets depict SHG parallel to (top) or wrapped around (bottom) strands of CCL21. (b) CCL21-stained sections were counterstained with GFAP. Images are representative of 2 individual experiments where n = 3 mice per group.
Figure 7
Figure 7
SPARC facilitates optimal CD8 + T cell migration in the brain. C57Bl/6 and SPARC−/− mice were infected with Pru-OVA for 21 days before receiving 5 × 106 OVA specific dsRed+CD8+ T cells. Analyses were conducted one week post transfer. (a) Flow cytometry plots of endogenous (left gate) and transferred OVA specific dsRed T cells (right gate) isolated from the whole brain of chronically infected C57Bl/6 and SPARC−/− mice. (b) Absolute cell numbers of endogenous OVA specific T cells calculated from the frequencies presented in (a). (c) Absolute cell numbers of transferred dsRed+ OVA-specific T cells calculated from the frequencies presented in a. (d) 2 × 2 tiled images were taken of the cortex using two-photon microscopy to visualize the distribution of T cells infiltrating the brain (e–h) Videos imaged of cell migration in the infected brain were analyzed. Flower plots of cell tracks from C57Bl/6 (e) and SPARC−/− (f) normalized to the origin. Velocity (g) and displacement (h) for cells recruited to C57Bl/6 brains compared to cells migrating in SPARC−/− brains were quantified. Cells were tracked using Volocity software and migration data was analyzed using the Mann–Whitney test, ***p < 0.001. Flow cytometry data was analyzed using the student’s T test, *p < 0.05, **p < 0.01. Data are representative of at least 2 individual experiments with a minimum of n = 3 and are represented as mean ± SEM.

Similar articles

Cited by

References

    1. Friedl P, Weigelin B. Interstitial leukocyte migration and immune function. Nat. Immunol. 2008;9:960–969. doi: 10.1038/ni.f.212. - DOI - PubMed
    1. Carman CV, Martinelli R. T lymphocyte-endothelial interactions: Emerging understanding of trafficking and antigen-specific immunity. Front. Immunol. 2015;6:603. doi: 10.3389/fimmu.2015.00603. - DOI - PMC - PubMed
    1. Lammermann T, Germain RN. The multiple faces of leukocyte interstitial migration. Semin. Immunopathol. 2014;36:227–251. doi: 10.1007/s00281-014-0418-8. - DOI - PMC - PubMed
    1. Phan TG, Bullen A. Practical intravital two-photon microscopy for immunological research: Faster, brighter, deeper. Immunol. Cell Biol. 2010;88:438–444. doi: 10.1038/icb.2009.116. - DOI - PubMed
    1. Schenke-Layland K. Non-invasive multiphoton imaging of extracellular matrix structures. J. Biophotonics. 2008;1:451–462. doi: 10.1002/jbio.200810045. - DOI - PMC - PubMed

Publication types

MeSH terms