

CircSLC8A1 and circNFIX can be used as auxiliary diagnostic markers for sudden cardiac death caused by acute ischemic heart disease
- PMID: 33633191
- PMCID: PMC7907149
- DOI: 10.1038/s41598-021-84056-5
CircSLC8A1 and circNFIX can be used as auxiliary diagnostic markers for sudden cardiac death caused by acute ischemic heart disease
Abstract
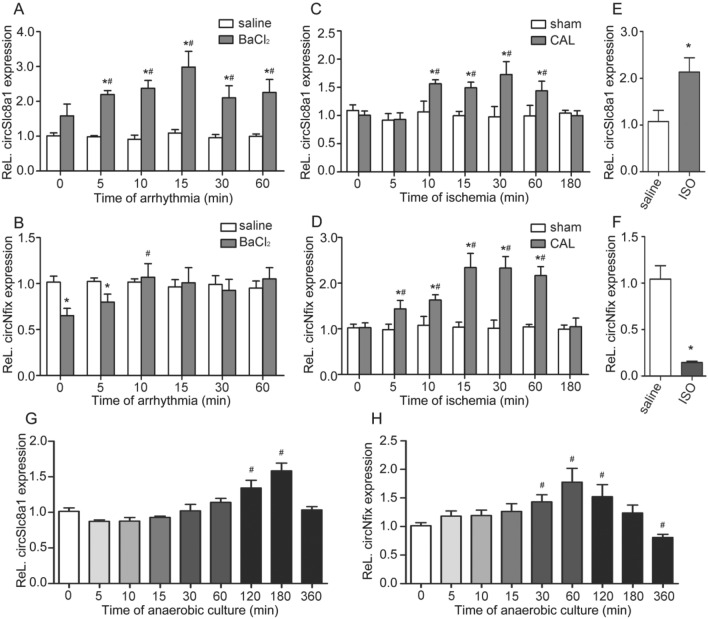
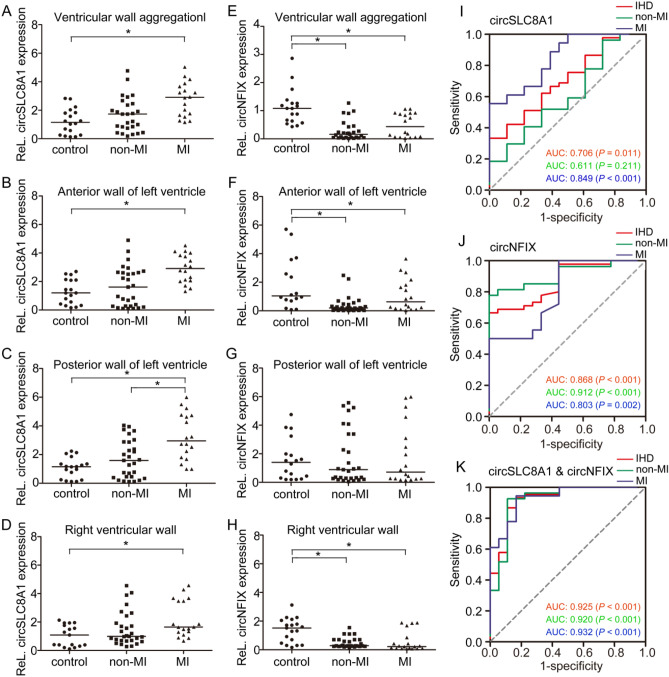
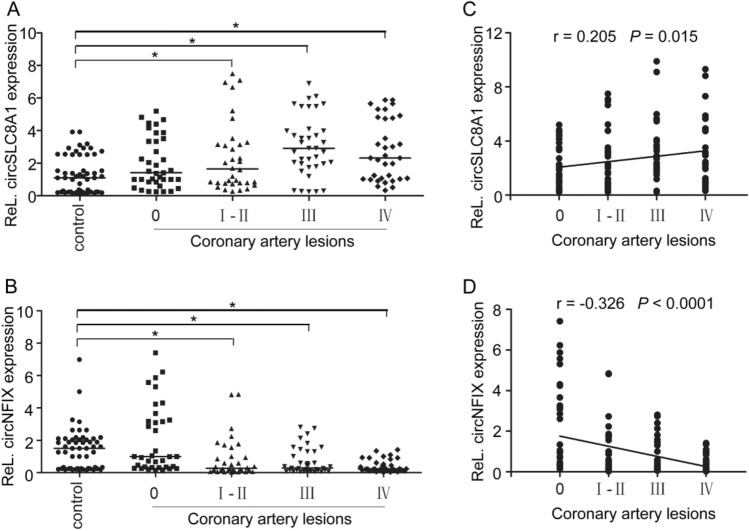
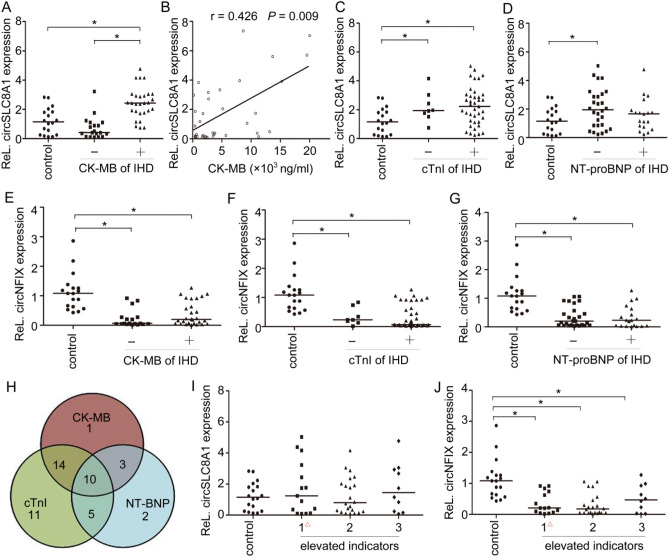
Sudden cardiac death (SCD) caused by acute ischemic heart disease (IHD) is a major cause of sudden death worldwide. Circular RNAs (circRNAs) are abundant in the heart and play important roles in cardiovascular diseases, but the role of circRNAs as biomarkers in the forensic diagnosis of SCD caused by acute IHD remains poorly characterized. To investigate the potential of two heart-enriched circRNAs, circNFIX and circSLC8A1, we explored the expression of these two circRNAs in different kinds of commonly used IHD models, and further verified their expressions in forensic autopsy cases. The results from both the IHD rat and H9c2 cell models revealed that circSlc8a1 level was upregulated, while the circNfix level was elevated in the early stage of ischemia and subsequently downregulated. The time-dependent expression patterns of the two circRNAs suggested their potential as SCD biomarkers. In autopsy cases, the results showed that the expression of these two circRNAs in the myocardium with acute IHD-related SCDs corresponded to the observations in the ischemic models. Further analysis related to myocardial ischemia indicated that circSLC8A1 showed high sensitivity and specificity for myocardial infarction and was positively correlated with creatine kinase MB in pericardial fluid. Downregulated circNFIX level could indicate the ischemic myocardial damage, and it was negatively correlated with the coronary artery stenosis grade. The combination of circSLC8A1 and circNFIX had better performance to discriminate IHD-related SCDs. The results suggested that circSLC8A1 and circNFIX may be used as auxiliary diagnostic markers for SCD caused by acute IHD in forensic medicine.
Conflict of interest statement
The authors declare no competing interests.
Figures
Similar articles
-
Postmortem biochemical analysis of soluble ST2 in the pericardial fluid of patients with sudden cardiac death caused by ischemic heart disease: a pilot study.Forensic Sci Med Pathol. 2024 Jun;20(2):317-324. doi: 10.1007/s12024-023-00677-4. Epub 2023 Jul 14. Forensic Sci Med Pathol. 2024. PMID: 37450171
-
Circular RNAs in Sudden Cardiac Death Related Diseases: Novel Biomarker for Clinical and Forensic Diagnosis.Molecules. 2021 Feb 21;26(4):1155. doi: 10.3390/molecules26041155. Molecules. 2021. PMID: 33670057 Free PMC article. Review.
-
Study on forensic diagnostic biomarker combination for acute ischemia heart disease based on postmortem biochemistry.J Forensic Leg Med. 2025 Feb;110:102825. doi: 10.1016/j.jflm.2025.102825. Epub 2025 Jan 30. J Forensic Leg Med. 2025. PMID: 39919669
-
Signature of circular RNAs in human induced pluripotent stem cells and derived cardiomyocytes.Stem Cell Res Ther. 2018 Mar 9;9(1):56. doi: 10.1186/s13287-018-0793-5. Stem Cell Res Ther. 2018. PMID: 29523209 Free PMC article.
-
[The application of biochemical indexes detecting in sudden cardiac death in forensic autopsy].Fa Yi Xue Za Zhi. 2009 Dec;25(6):451-4. Fa Yi Xue Za Zhi. 2009. PMID: 20225625 Review. Chinese.
Cited by
-
Research progress and potential application of microRNA and other non-coding RNAs in forensic medicine.Int J Legal Med. 2024 Mar;138(2):329-350. doi: 10.1007/s00414-023-03091-1. Epub 2023 Sep 28. Int J Legal Med. 2024. PMID: 37770641 Review.
-
Non-Coding Ribonucleic Acids as Diagnostic and Therapeutic Targets in Cardiac Fibrosis.Curr Heart Fail Rep. 2024 Jun;21(3):262-275. doi: 10.1007/s11897-024-00653-1. Epub 2024 Mar 15. Curr Heart Fail Rep. 2024. PMID: 38485860 Free PMC article. Review.
-
Circular RNAs in the Regulation of Oxidative Stress.Front Pharmacol. 2021 Jul 27;12:697903. doi: 10.3389/fphar.2021.697903. eCollection 2021. Front Pharmacol. 2021. PMID: 34385919 Free PMC article. Review.
-
Characterization of global research trends and prospects on sudden coronary death: A literature visualization analysis.Heliyon. 2023 Jul 22;9(8):e18586. doi: 10.1016/j.heliyon.2023.e18586. eCollection 2023 Aug. Heliyon. 2023. PMID: 37576229 Free PMC article.
-
MicroRNA-381-3p signatures as a diagnostic marker in patients with sepsis and modulates sepsis-steered cardiac damage and inflammation by binding HMGB1.Bioengineered. 2021 Dec;12(2):11936-11946. doi: 10.1080/21655979.2021.2006967. Bioengineered. 2021. PMID: 34784841 Free PMC article.
References
MeSH terms
Substances
LinkOut - more resources
Full Text Sources
Other Literature Sources
Miscellaneous
