Case Reports
. 2021 Feb 25;11(1):4577.
doi: 10.1038/s41598-021-83883-w.

Novel diagnostic and therapeutic techniques reveal changed metabolic profiles in recurrent focal segmental glomerulosclerosis

Affiliations
Case Reports

Novel diagnostic and therapeutic techniques reveal changed metabolic profiles in recurrent focal segmental glomerulosclerosis

Janina Müller-Deile et al. Sci Rep. .

Erratum in

Abstract

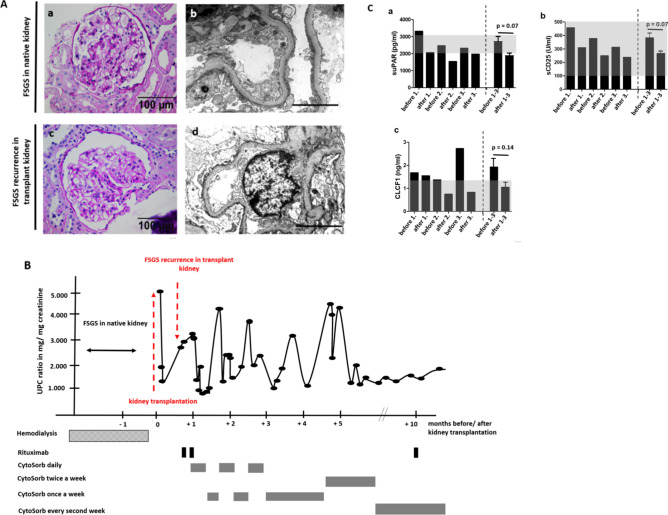
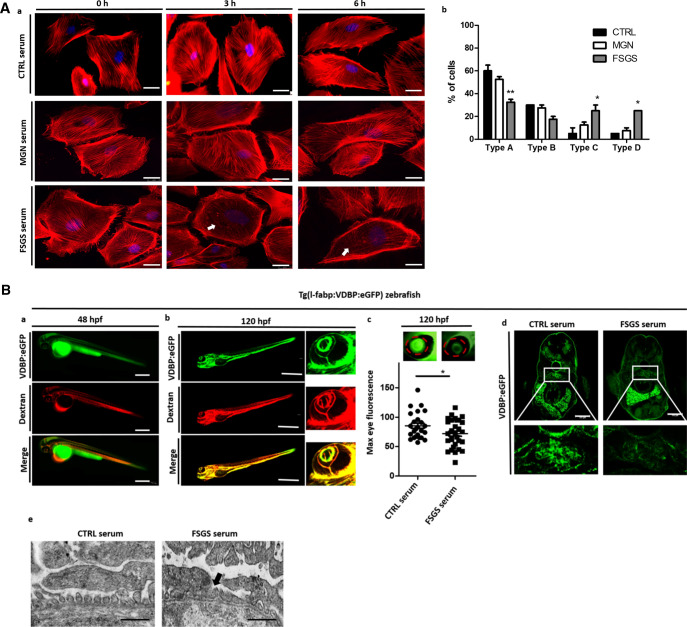
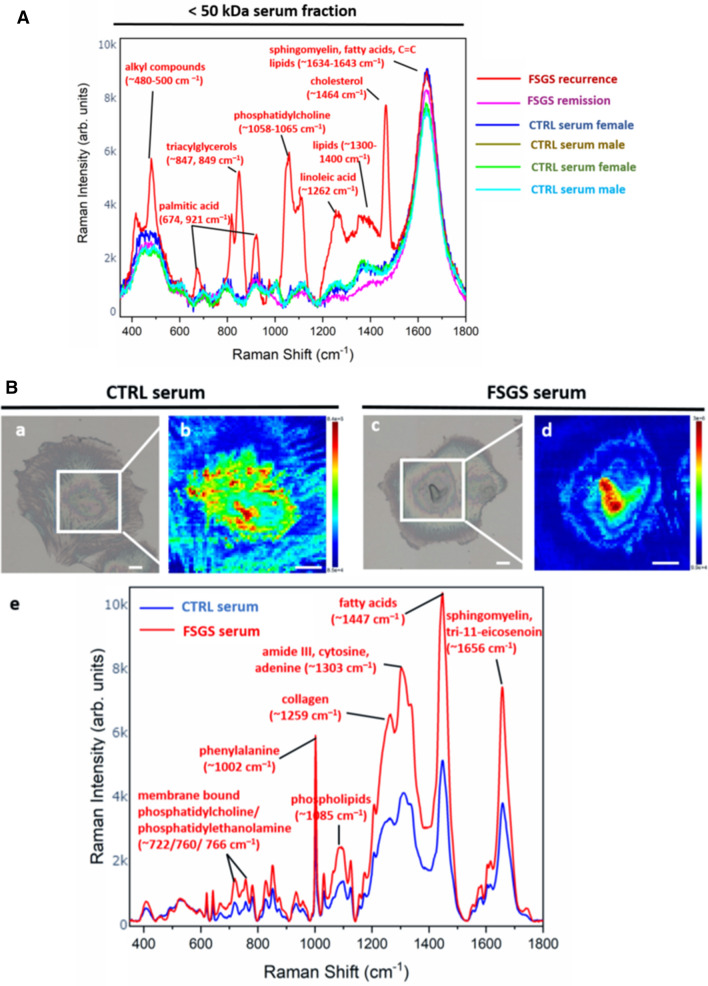
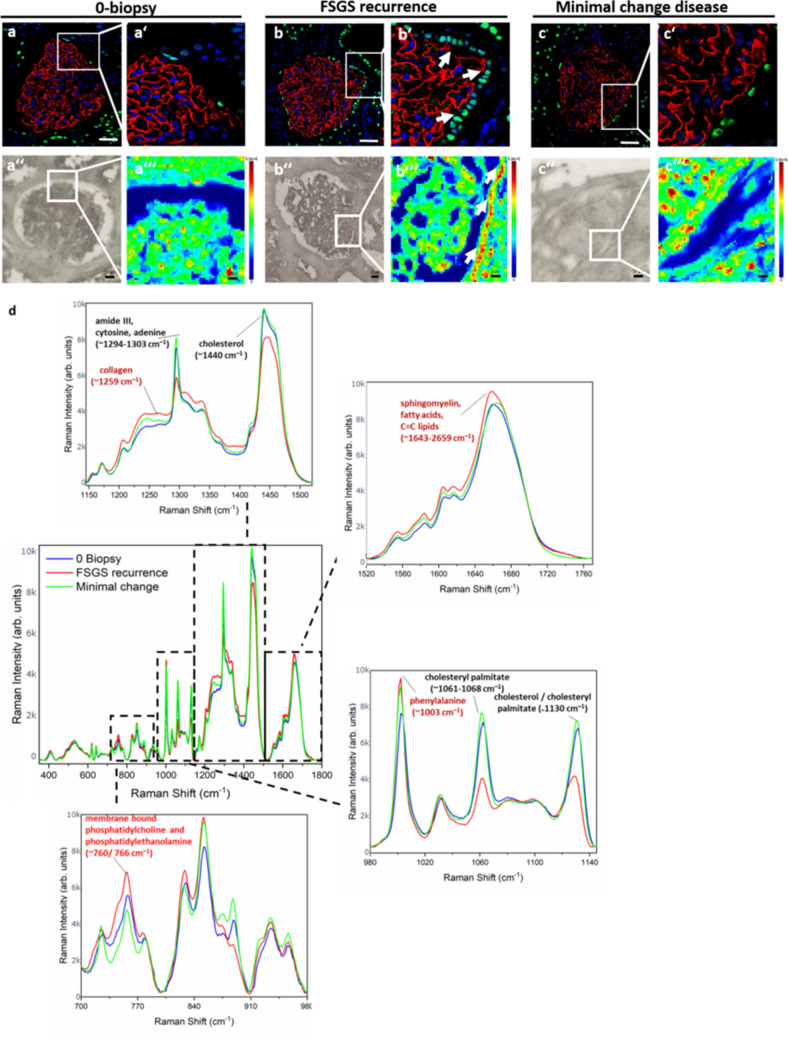
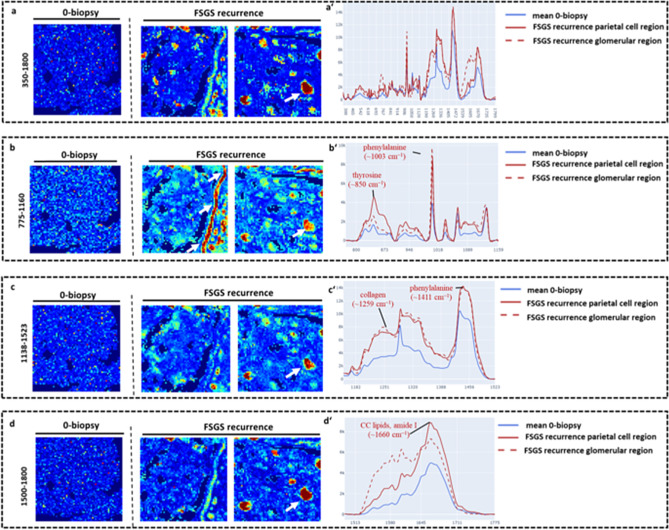
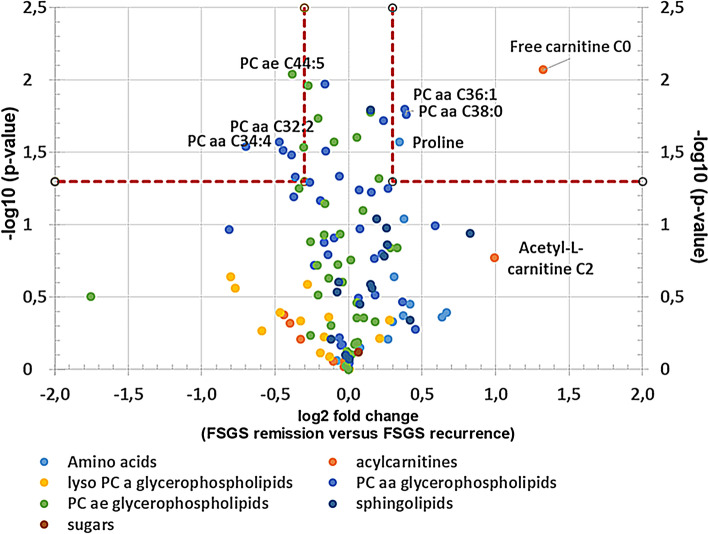
Idiopathic forms of Focal Segmental Glomerulosclerosis (FSGS) are caused by circulating permeability factors, which can lead to early recurrence of FSGS and kidney failure after kidney transplantation. In the past three decades, many research endeavors were undertaken to identify these unknown factors. Even though some potential candidates have been recently discussed in the literature, "the" actual factor remains elusive. Therefore, there is an increased demand in FSGS research for the use of novel technologies that allow us to study FSGS from a yet unexplored angle. Here, we report the successful treatment of recurrent FSGS in a patient after living-related kidney transplantation by removal of circulating factors with CytoSorb apheresis. Interestingly, the classical published circulating factors were all in normal range in this patient but early disease recurrence in the transplant kidney and immediate response to CytoSorb apheresis were still suggestive for pathogenic circulating factors. To proof the functional effects of the patient's serum on podocytes and the glomerular filtration barrier we used a podocyte cell culture model and a proteinuria model in zebrafish to detect pathogenic effects on the podocytes actin cytoskeleton inducing a functional phenotype and podocyte effacement. We then performed Raman spectroscopy in the < 50 kDa serum fraction, on cultured podocytes treated with the FSGS serum and in kidney biopsies of the same patient at the time of transplantation and at the time of disease recurrence. The analysis revealed changes in podocyte metabolome induced by the FSGS serum as well as in focal glomerular and parietal epithelial cell regions in the FSGS biopsy. Several altered Raman spectra were identified in the fractionated serum and metabolome analysis by mass spectrometry detected lipid profiles in the FSGS serum, which were supported by disturbances in the Raman spectra. Our novel innovative analysis reveals changed lipid metabolome profiles associated with idiopathic FSGS that might reflect a new subtype of the disease.


Conflict of interest statement

The authors declare no competing interests.

Figures

Figure 1
Figure 1
CytoSorb apheresis to treat therapy resistant and early recurrent FSGS. (A)—(a) PAS staining of native kidney biopsy of the patient at the time of initial diagnosis of FSGS. Scale bar = 100 µm. (b) Transmission electron microscopy picture of native kidney biopsy of the patient at the time of initial diagnosis of FSGS. Scale bar = 1 µm. (c) PAS staining of transplant kidney biopsy of the patient at the time of the diagnosis of recurrence of podocytopathy. Scale bar = 100 µm. (d) Transmission electron microscopy picture of transplant kidney biopsy of the patient at the time of the diagnosis of recurrence of podocytopathy. Scale bar = 1 µm. (B) Illustration of clinical course of the patient. Proteinuria measured as urine-protein-creatinine-ratio (UPC-ratio) is given in black dots and lines. Time points of kidney transplantation, transplant kidney biopsy, Rituximab treatment and CytoSorb apheresis schedule are illustrated. (C) Measurements for suPAR (a), sCD25 (b) and CLCF1 (c) in serum samples of the patient before and after first, second and third CytoSorb apheresis. The last two columns depict the mean of measurements for the parameters before and after apheresis 1–3. Normal reference levels are shown in gray. Differences before and after CytoSorb apheresis were not significant for suPAR, CLCF1 and sCD25.
Figure 2
Figure 2
Cell culture and zebrafish assay to detect morphological and functional effects of unknown circulating permeability factors in FSGS. (A)—(a) Representative images of cultured differentiated human podocytes treated with 10% serum from a healthy control (CTRL serum), the patient with recurrent FSGS in the kidney transplant and a patient with membranous glomerulonephritis (incubation for 0 h, 3 h and 6 h). Cells were stained with phalloidin for cytoskeleton labeling. White arrows indicate cytoskeleton rearrangement. Scale bar = 25 µm. (b) Quantification of stress fiber formation in podocytes after treatment with different sera of patients. Type A: more than 90% of cell area filled with thick cables; type B: at least 2 thick cables running under nucleus and rest of cell area filled with fine cables; type C: no thick cables, but some cables present; type D: no cables visible in the central area of the cell. (B) Zebrafish assay for the detection of circulating permeability factors. (a) Representative image of a transgenic Tg(l-fabp:VDBP:eGFP) zebrafish larvae (VDBP:eGFP) injected with serum: dextran texas red into the zebrafish circulation (Dextran c.v. injection) at 48 hpf. Proper injection leads to red fluorescence of the zebrafish vascularization. Expression of the green fluorescent vitamin D binding protein just started. Scale bar = 500 µm. (b) At 120 hpf injected Tg(l-fabp:VDBP:eGFP) zebrafish express green fluorescent vitamin D binding protein (VDBP:eGFP) in the circulation. Red fluorescent serum: dextran mixture is still detectable in the circulation (dextran) and merges with the green fluorescent vitamin D binding protein (merge). The zebrafish eye is enlarged to show the retinal plexus. (c) Tg(l-fabp:VDBP:eGFP) transgenic zebrafish can be used to indirectly monitor proteinuria. Loss of green fluorescent protein in FSGS serum injected fish leads to reduced GFP signal in the retinal vessels where it can easily be quantified. Quantification of loss of fluorescent vitamin D binding proteins was done by measuring maximum GFP fluorescence in the retinal vessel plexus of Tg(l-fabp:VDBP:eGFP) zebrafish larvae at 120 hpf. Zebrafish larvae were injected with serum: dextran mixture from a healthy control and from a patient with FSGS recurrence in the kidney transplant at 48 hpf. *p < 0.05. n = 107. Scale bar = 500 µm. (d) Cryo sections of Tg(l-fabp:VDBP:eGFP) transgenic zebrafish larvae at 120 hpf showing systemic decrease in VDBP:eGFP in the systemic vascular system in FSGS serum injected zebrafish as a hint for proteinuria. Zebrafish were injected with serum from CTRL or FSGS patient at the time of disease recurrence. Scale bar = 100 µm. (e) Electron microscopy picture of the glomerular filtration barrier of 5 day old zebrafish larvae that were injected with either serum of the patient from the time of FSGS recurrence or with CTRL serum at 48 hpf. Black arrow head shows podocyte effacement. Scale bar = 500 nm. hpf: hours post fertilization, VDBP: Vitamin D binding protein.
Figure 3
Figure 3
Raman spectroscopy reveals molecular fingerprint of FSGS serum and changes in podocyte metabolome induced by FSGS serum. (A) Mean Raman spectra of < 50 kDa serum fractions of FSGS at the time of disease recurrence (red), at the time of remission (purple) as well as of < 50 kDa serum fractions of four healthy control person (dark blue, green, brown and light blue). Different Raman signal corresponding mostly to lipoproteins were detected at the time of FSGS recurrence. Raman signals at the time of FSGS remission however resembled Raman signals of the CTRL serum fraction. Assignments of the Raman peaks according to the literature are given. (B) Representative bright field illumination (a,c) and heat map of Raman signal intensity (b,d) of cultured human podocytes treated with CTRL serum (a,b) and FSGS serum (c,d). Scale bar 10 µm. (e) Mean Raman spectra of three podocytes treated with FSGS serum (red line) and three podocytes treated with CTRL serum (blue line) showing increased Raman signal for FSGS treated cells.
Figure 4
Figure 4
Raman spectroscopy gives a molecular fingerprint of recurrent FSGS on tissue level. (a,b) PAX8 staining (green) and synaptopodin staining (red) of a glomerulus from the kidney biopsy at transplantation (0-biopsy) (a,a′) and at the time of FSGS recurrence (FSGS recurrence) (b,b′) and from a patient with minimal change disease (c,c′) showing increased PAX8 staining in the Bowman’s capsule (arrow head in b′), scale bar = 100 µm. Representative bright field illumination (a″,b″,c″) and heat map of Raman signal intensity (a‴,b‴,c‴) of a glomerulus from the kidney biopsy at transplantation (0-biopsy) (a″,a‴), at the time of FSGS recurrence (FSGS recurrence) (b″,b‴) and of a biopsy with minimal change disease (c″,c‴) showing increased Raman signal at the region of parietal epithelial cell in the Bowman’s capsule (arrow head in b‴). Scale bar = 50 µm. (d) Mean Raman spectra of three glomeruli from the kidney biopsy at transplantation (blue line) and three glomeruli at the time of FSGS recurrence (red line). Assignments of the Raman peaks according to the literature are given.
Figure 5
Figure 5
Machine learning reveals anomalies in Raman spectroscopy maps between 0-biopsy and FSGS recurrence. Raman spectra of glomeruli from the 0-biopsy and two glomeruli from the biopsy with FSGS recurrence were visualized, whereby the intensity and color range cover the degree of the anomaly. Areas of focal glomerular lesions as well as parietal epithelial cells in the Bowman capsule are highlighted as an anomaly in the FSGS samples. (a) Visualization of the occurring anomaly using the entire spectrum. (bd) Consideration of only parts of the spectrogram that have been baseline corrected individually. Especially in the range of 775–1160 cm−1 (b) there were significant differences in FSGS glomeruli comparison to spectra from glomeruli of the 0-biopsy in focal areas as well in parietal cell region of the bowman capsule. Likewise, a similar effect was observed for the wavelength range 1138–1500 cm−1 (c) and 1500–1800 cm−1 (d). (a′d′) Raman spectra for the anomalies with confidence > 80% in FSGS recurrence of the parietal cell region (red line) and the glomerular region (spotted red line) compared to 0-biopsy (blue line) for the entire spectrum (a′) and divided in wavelength range of 775–1160 cm−1 (b′) 1138–1523 cm−1 (c′) as well as 1500–1800 cm−1 (d′).
Figure 6
Figure 6
Serum metabolome analysis of recurrent FSGS reveals changes in carnitine and phosphatidylcholine-levels. Volcano-Plot of the serum metabolome analysis of the patient with FSGS. Log2 fold change of metabolites at FSGS remission versus FSGS recurrence as well as –log10 (p-values) are given. PCaaC34:4 and l-carnitine were significantly altered at remission versus recurrence. Confidence limits (fold change > 0.3, p-value < 0.05) are shown with dashed lines. Metabolomics are labeled in different colors according to their metabolomics class.

Similar articles

Cited by

References

    1. Kitiyakara C, Eggers P, Kopp JB. Twenty-one-year trend in ESRD due to focal segmental glomerulosclerosis in the United States. Am. J. Kidney Dis. 2004;44:815–825. - PubMed
    1. Rosenberg AZ, Kopp JB. Focal segmental glomerulosclerosis. Clin. J. Am. Soc. Nephrol. 2017;12:502–517. - PMC - PubMed
    1. Haas M, Meehan SM, Karrison TG, Spargo BH. Changing etiologies of unexplained adult nephrotic syndrome: A comparison of renal biopsy findings from 1976–1979 and 1995–1997. Am. J. Kidney Dis. 1997;30:621–631. - PubMed
    1. De Vriese AS, Sethi S, Nath KA, Glassock RJ, Fervenza FC. Differentiating primary, genetic, and secondary FSGS in adults: A clinicopathologic approach. J. Am. Soc. Nephrol. 2018;29:759–774. - PMC - PubMed
    1. Sethi S, Glassock RJ, Fervenza FC. Focal segmental glomerulosclerosis: Towards a better understanding for the practicing nephrologist. Nephrol. Dial. Transplant. 2015;30:375–384. - PubMed

Publication types

LinkOut - more resources