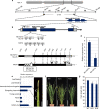
The dominance model for heterosis explains culm length genetics in a hybrid sorghum variety
- PMID: 33633216
- PMCID: PMC7907390
- DOI: 10.1038/s41598-021-84020-3
The dominance model for heterosis explains culm length genetics in a hybrid sorghum variety
Abstract
Heterosis helps increase the biomass of many crops; however, while models for its mechanisms have been proposed, it is not yet fully understood. Here, we use a QTL analysis of the progeny of a high-biomass sorghum F1 hybrid to examine heterosis. Five QTLs were identified for culm length and were explained using the dominance model. Five resultant homozygous dominant alleles were used to develop pyramided lines, which produced biomasses like the original F1 line. Cloning of one of the uncharacterised genes (Dw7a) revealed that it encoded a MYB transcription factor, that was not yet proactively used in modern breeding, suggesting that combining classic dw1or dw3, and new (dw7a) genes is an important breeding strategy. In conclusion, heterosis is explained in this situation by the dominance model and a combination of genes that balance the shortness and early flowering of the parents, to produce F1 seed yields.
Conflict of interest statement
The authors declare no competing interests.
Figures


Similar articles
-
Dissecting repulsion linkage in the dwarfing gene Dw3 region for sorghum plant height provides insights into heterosis.Proc Natl Acad Sci U S A. 2015 Sep 22;112(38):11823-8. doi: 10.1073/pnas.1509229112. Epub 2015 Sep 8. Proc Natl Acad Sci U S A. 2015. PMID: 26351684 Free PMC article.
-
Main Effect QTL with Dominance Determines Heterosis for Dynamic Plant Height in Upland Cotton.G3 (Bethesda). 2016 Oct 13;6(10):3373-3379. doi: 10.1534/g3.116.034355. G3 (Bethesda). 2016. PMID: 27565885 Free PMC article.
-
Integrated analysis of phenome, genome, and transcriptome of hybrid rice uncovered multiple heterosis-related loci for yield increase.Proc Natl Acad Sci U S A. 2016 Oct 11;113(41):E6026-E6035. doi: 10.1073/pnas.1610115113. Epub 2016 Sep 23. Proc Natl Acad Sci U S A. 2016. PMID: 27663737 Free PMC article.
-
Heterosis in crop improvement.Plant J. 2024 Jan;117(1):23-32. doi: 10.1111/tpj.16488. Epub 2023 Nov 16. Plant J. 2024. PMID: 37971883 Review.
-
Heterosis: revisiting the magic.Trends Genet. 2007 Feb;23(2):60-6. doi: 10.1016/j.tig.2006.12.006. Epub 2006 Dec 22. Trends Genet. 2007. PMID: 17188398 Review.
Cited by
-
Harnessing the Genetic Basis of Sorghum Biomass-Related Traits to Facilitate Bioenergy Applications.Int J Mol Sci. 2023 Sep 26;24(19):14549. doi: 10.3390/ijms241914549. Int J Mol Sci. 2023. PMID: 37833996 Free PMC article.
-
Genetic control of morphological traits useful for improving sorghum.Breed Sci. 2023 Mar;73(1):57-69. doi: 10.1270/jsbbs.22069. Epub 2023 Jan 17. Breed Sci. 2023. PMID: 37168813 Free PMC article.
-
Decoding the genetic blueprint: regulation of key agricultural traits in sorghum.Adv Biotechnol (Singap). 2024 Sep 18;2(4):31. doi: 10.1007/s44307-024-00039-3. Adv Biotechnol (Singap). 2024. PMID: 39883247 Free PMC article. Review.
-
Construction of a high-density genetic linkage map and QTL mapping for bioenergy-related traits in sweet sorghum [Sorghum bicolor (L.) Moench].Front Plant Sci. 2023 Jun 5;14:1081931. doi: 10.3389/fpls.2023.1081931. eCollection 2023. Front Plant Sci. 2023. PMID: 37342135 Free PMC article.
-
SiMYBS3, Encoding a Setaria italica Heterosis-Related MYB Transcription Factor, Confers Drought Tolerance in Arabidopsis.Int J Mol Sci. 2023 Mar 12;24(6):5418. doi: 10.3390/ijms24065418. Int J Mol Sci. 2023. PMID: 36982494 Free PMC article.
References
Publication types
MeSH terms
LinkOut - more resources
Full Text Sources
Other Literature Sources

