. 2021 Feb 25;11(1):4523.
doi: 10.1038/s41598-021-84071-6.

Characterization of mitochondrial health from human peripheral blood mononuclear cells to cerebral organoids derived from induced pluripotent stem cells

Affiliations

Characterization of mitochondrial health from human peripheral blood mononuclear cells to cerebral organoids derived from induced pluripotent stem cells

Angela Duong et al. Sci Rep. .

Abstract

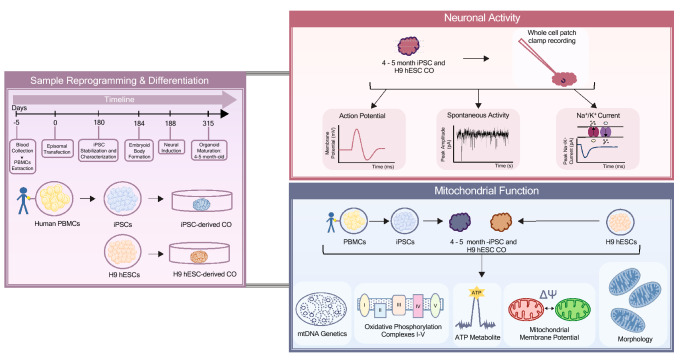
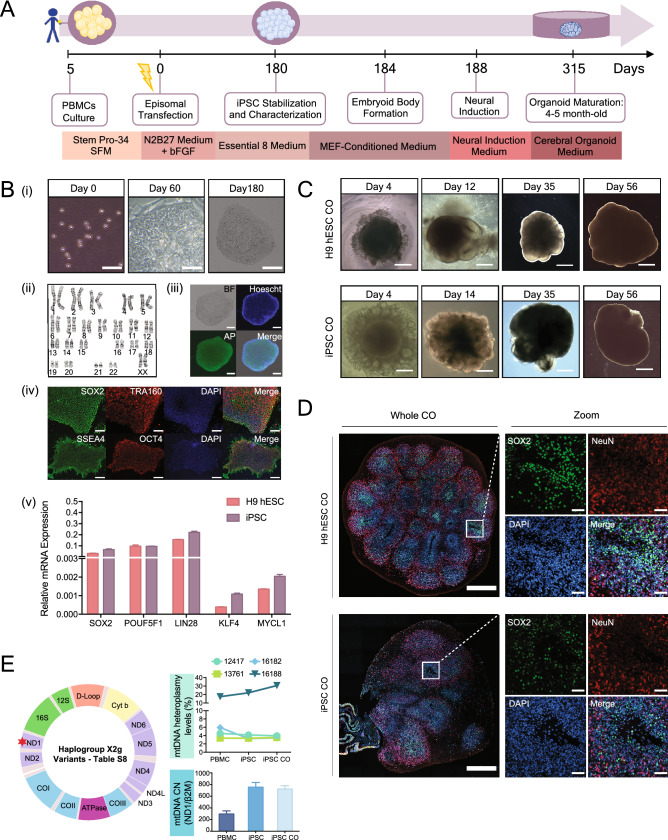
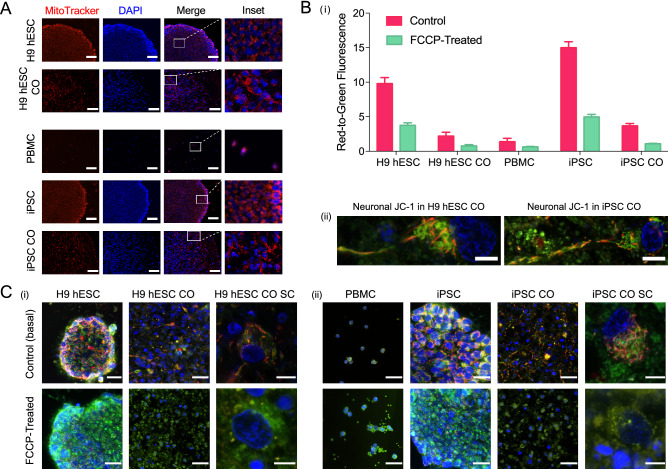
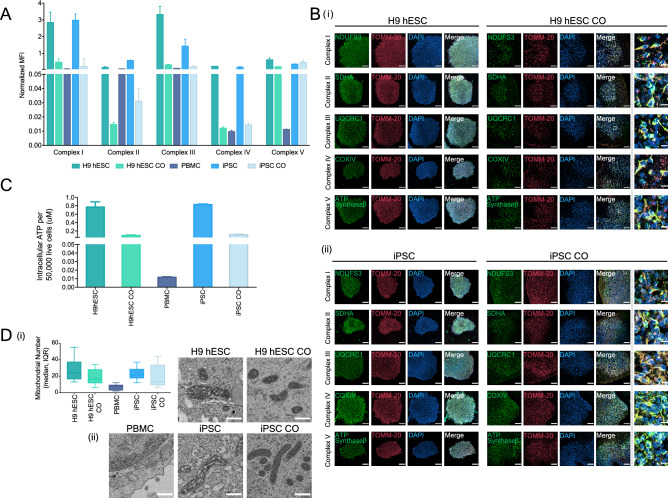
Mitochondrial health plays a crucial role in human brain development and diseases. However, the evaluation of mitochondrial health in the brain is not incorporated into clinical practice due to ethical and logistical concerns. As a result, the development of targeted mitochondrial therapeutics remains a significant challenge due to the lack of appropriate patient-derived brain tissues. To address these unmet needs, we developed cerebral organoids (COs) from induced pluripotent stem cells (iPSCs) derived from human peripheral blood mononuclear cells (PBMCs) and monitored mitochondrial health from the primary, reprogrammed and differentiated stages. Our results show preserved mitochondrial genetics, function and treatment responses across PBMCs to iPSCs to COs, and measurable neuronal activity in the COs. We expect our approach will serve as a model for more widespread evaluation of mitochondrial health relevant to a wide range of human diseases using readily accessible patient peripheral (PBMCs) and stem-cell derived brain tissue samples.


Conflict of interest statement

The authors declare no competing interests.

Figures

Figure 1
Figure 1
Schematic summary of the study design. Purple panel: An overview and a timeline of sample reprogramming and differentiation from peripheral blood mononuclear cells (PBMCs) to induced pluripotent stem cells (iPSCs) to cerebral organoids (COs) or H9 human embryonic stem cells (H9 hESCs) to COs. Red panel: An overview of electrophysiology experiments (action potentials, spontaneous activity, and sodium and potassium currents) in cerebral organoids. Blue panel: An overview of mitochondrial (mt-) genetics (mtDNA haplogroup, heteroplasmy and copy number), function (oxidative phosphorylation, ATP production and mitochondrial membrane potential) and morphology assessment across PBMCs to iPSCs to COs or H9 hESCs to COs.
Figure 2
Figure 2
Generation and characterization of cerebral organoids from PBMCs-derived iPSCs and H9 hESCs. (A) Timeline and protocol schematic from peripheral blood mononuclear cells (PBMCs) to induced pluripotent stem cells (iPSCs) to cerebral organoids (COs). (B) (i) Representative bright-field images showing PBMCs on Day 0, scale bar, 50 μm, reprogramming iPSCs on Day 60, scale bar, 50 μm, and a fully stabilized iPSC colony on Day 180, scale bar, 200 μm; (ii) chromosome analysis with normal female karyotype (46, XX) in 20 cells examined; (iii) representative fluorescent images of iPSCs stained positive for alkaline phosphatase, scale bar, 100 μm; (iv) representative immunofluorescent images of iPSCs stained positive for a set of pluripotency markers, SOX2, TRA160, SSEA4 and OCT4, scale bar, 600 μm; (v) Bar graph showing relative mRNA expression of pluripotency markers, SOX2, POUF51, LIN28, KLF4 and MYCL1. Bars, mean ± SD. (C) Representative bright field images showing the progression of cerebral organoid development in H9 hESCs (top panel, scale bars, 250 μm, 250 μm, 500 μm and 1 mm from left to right) and iPSCs (bottom panel, scale bars, 250 μm, 500 μm, 500 μm and 1 mm from left to right). (D) Representative fluorescent immunohistochemistry images of whole cerebral organoid in 4.5-month H9 hESC CO and iPSC CO section view (scale bar, 500 μm) and magnified view (scale bar, 50 μm) expressing nuclei (DAPI), radial glia (SOX2) and mature postmitotic neurons (NeuN). Note that immunofluorescent images were used for qualitative observations. (E) Mitochondrial (mt-) DNA haplogroup, heteroplasmy and copy number (CN) characterization across PBMCs, iPSCs and iPSC COs. Top right: graph showing mtDNA heteroplasmy levels at four nucleotide positions (MT-12417, MT-13761, MT16182 and MT-16188). Bottom right: graph showing relative mtDNA CN, expressed as MT-ND1/β2M ratio. Schematic of the mitochondrial DNA (left). Red star denotes the mtDNA region used to evaluate mtDNA CN. For more information on the haplogroup X2g variants, see Table S8.
Figure 3
Figure 3
Characterization of active, functional and responsive mitochondria throughout CO generation. (A) Active mitochondria in H9 hESCs (scale bar, 100 μm), H9 hESC COs (scale bar, 50 μm), PBMCs (scale bar, 100 μm), iPSCs (scale bar, 100 μm) and iPSC COs (scale bar, 65 μm) stained with MitoTracker Red CMXRos (red) and DAPI (nuclei, blue). Last column shows insets, enlarged views of boxed areas from the merge images. (B) (i) Bar graph summarizing mitochondrial membrane potential (MMP) as red-to-green fluorescence ratio across primary, reprogrammed and differentiated stages in samples treated with JC-1 only (control basal MMP level) and those treated with carbonyl cyanide-4-(trifluoromethoxy)phenylhydrazone (FCCP). Fluorescence was recorded using a microplate reader. Bars, mean ± SD; (ii) Representative MMP images of a fully captured neuron with cell body and axon projection in H9 hESC CO (left, scale bar, 5 μm) and iPSC CO (right, scale bar, 7 μm). Red, JC-1 aggregates (highly energetic or polarized), green, JC-1 monomers (less energetic or depolarized). (C) (i) Top row shows representative MMP images across CO generation from H9 hESCs (scale bar, 25 μm) to H9 hESC CO (scale bar, 25 μm) or hESC CO single cell (SC, scale bar, 10 μm) and; (ii) from PBMCs (scale bar, 25 μm) to iPSCs (scale bar, 25 μm) to iPSC COs (scale bar, 25 μm) or iPSC CO SC (scale bar, 5 μm). Bottom row shows representative images of samples treated with FCCP followed by JC-1 to visualize the collapse of MMP in (i) H9 hESCs (scale bar, 25 μm) to H9 hESC CO (scale bar, 25 μm) or hESC CO SC (scale bar, 5 μm) and; (ii) from PBMCs (scale bar, 25 μm) to iPSCs (scale bar, 25 μm) to iPSC COs (scale bar, 25 μm) or iPSC CO SC (scale bar, 5 μm). All images were captured at ×100 magnification with slight variations in the zoom factor to capture the single cell(s) or single colony of interest. Immunofluorescent images shown here were used for qualitative observations only.
Figure 4
Figure 4
Mitochondrial oxidative phosphorylation and morphology throughout CO generation. (A) Bar graph showing the oxidative phosphorylation (OXPHOS) complexes I–V assembly levels in H9 hESCs, H9 hESC COs, PBMCs, iPSCs and iPSC COs. Median fluorescence intensities for each complex were recorded using Luminex technology. Bars, median fluorescence intensity ± SD. (B) Representative immunofluorescence images showing the formation of the inner mitochondrial membrane OXPHOS proteins (complex I, NDUFS3; complex II, SDHA; complex III, UQCRC1; complex IV, COXIV; complex V, ATP synthase-β; green) and the outer mitochondrial membrane (TOMM-20; red) in (i) H9 hESCs to H9 hESC COs and; (ii) iPSCs to iPSC COs. All scale bars, 100 μm. Last column shows insets, enlarged views of boxed areas from the merge CO images, all scale bars, 10 μm. In the CO tissues, out of focus light and autofluorescence of tissue matrix led to background noise which were corrected for better visualization. Brightness levels of each images were also adjusted to optimize visualization. Immunofluorescent images shown here were used for qualitative observations only—no quantitative analyses were performed. (C) Bar graph showing the intracellular ATP levels across H9 hESCs to H9 hESC COs and PBMCs, iPSCs to iPSC COs, bars, mean ± SD. (D) (i) Box plot summarizing the median number of mitochondria in 10 cells examined, boxes, median and interquartile range, IQR. (ii) Representative electron micrographs of mitochondrial morphology across H9 hESCs (scale bar, 5 μm) to H9 hESC COs (scale bar, 500 nm) and PBMCs (scale bar, 5 μm), iPSCs (scale bar, 500 nm) to iPSC COs (scale bar, 500 nm).
Figure 5
Figure 5
Electrophysiological characterization in H9 hESC-derived COs and iPSC-derived COs. (A) (i) Examples of voltage responses to hyperpolarizing and depolarizing set of currents recorded from type 2 (green) and type 3 (blue) neurons. Individual APs are expanded in the insert (red), scale 20 mV/5 ms. Summary bar graphs showing (ii) AP amplitudes, (iii) rise time, (iv) half-width and (v) decay, note that APs have lower amplitude and slower kinetic in type 2 neurons. (B) (i) Examples of inward sodium and outward potassium currents recorded from neurons type 1 (black), type 2 (green) and type 3 (blue). Scale bar is the same for all traces. Summary current–voltage plots showing increase in peak current amplitude for both sodium (top) and potassium (bottom) during neuronal maturation (ii and iii). These plots look similar independently of COs origin. (C) (i) Examples of spontaneous AP firing in type 3 neurons (top) and summary bar graph of AP frequency in H9 hESC- and iPSC-derived COs (bottom). (ii) Examples of spontaneous excitatory postsynaptic currents (EPSCs) recorded from type 2 (green) and type 3 (blue) neurons. Scale bar is the same for all traces. (iii) Summary bar graphs showing that spontaneous synaptic activity including sEPSC frequency (left) and amplitude (right) was similar in both types of neurons regardless origin of COs. Error bars show standard deviation.

Similar articles

Cited by

References

    1. Spinelli JB, Haigis MC. The multifaceted contributions of mitochondria to cellular metabolism. Nat. Cell Biol. 2018;20(7):745–754. doi: 10.1038/s41556-018-0124-1. - DOI - PMC - PubMed
    1. Nunnari J, Suomalainen A. Mitochondria: In sickness and in health. Cell. 2012;148(6):1145–1159. doi: 10.1016/j.cell.2012.02.035. - DOI - PMC - PubMed
    1. Picard M, McEwen BS. Mitochondria impact brain function and cognition. Proc. Natl. Acad. Sci. USA. 2014;111(1):7–8. doi: 10.1073/pnas.1321881111. - DOI - PMC - PubMed
    1. Herculano-Houzel S. The remarkable, yet not extraordinary, human brain as a scaled-up primate brain and its associated cost. Proc. Natl. Acad. Sci. USA. 2012;109(Suppl 1):10661–10668. doi: 10.1073/pnas.1201895109. - DOI - PMC - PubMed
    1. Bélanger M, Allaman I, Magistretti PJ. Brain energy metabolism: Focus on astrocyte-neuron metabolic cooperation. Cell Metab. 2011;14(6):724–738. doi: 10.1016/j.cmet.2011.08.016. - DOI - PubMed

Publication types

MeSH terms