

Doxorubicin-transferrin conjugate alters mitochondrial homeostasis and energy metabolism in human breast cancer cells
- PMID: 33633284
- PMCID: PMC7907108
- DOI: 10.1038/s41598-021-84146-4
Doxorubicin-transferrin conjugate alters mitochondrial homeostasis and energy metabolism in human breast cancer cells
Abstract
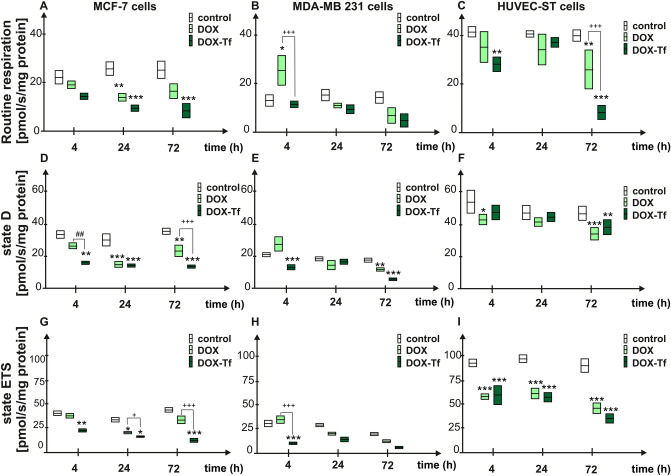
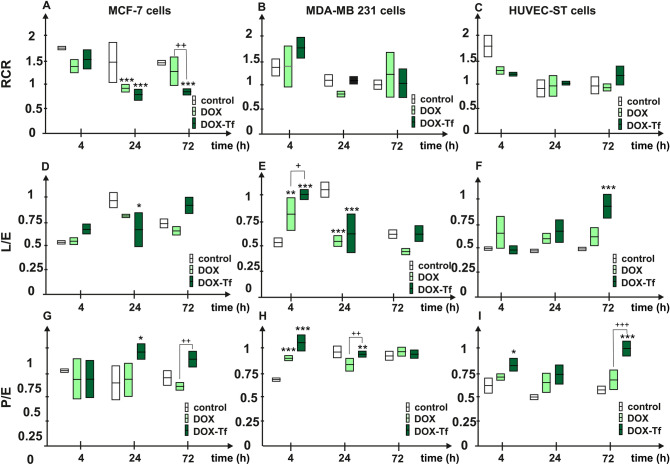
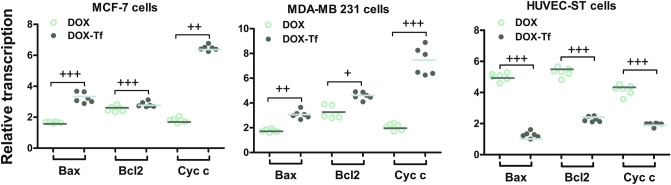
Doxorubicin (DOX) is considered one of the most powerful chemotherapeutic agents but its clinical use has several limitations, including cardiomyopathy and cellular resistance to the drug. By using transferrin (Tf) as a drug carrier, however, the adverse effects of doxorubicin as well as drug resistance can be reduced. The main objective of this study was to determine the exact nature and extent to which mitochondrial function is influenced by DOX-Tf conjugate treatment, specifically in human breast adenocarcinoma cells. We assessed the potential of DOX-Tf conjugate as a drug delivery system, monitoring its cytotoxicity using the MTT assay and ATP measurements. Moreover, we measured the alterations of mitochondrial function and oxidative stress markers. The effect of DOX-Tf was the most pronounced in MDA-MB-231, triple-negative breast cancer cells, whereas non-cancer endothelial HUVEC-ST cells were more resistant to DOX-Tf conjugate than to free DOX treatment. A different sensitivity of two investigate breast cancer cell lines corresponded to the functionality of their cellular antioxidant systems and expression of estrogen receptors. Our data also revealed that conjugate treatment mediated free radical generation and altered the mitochondrial bioenergetics in breast cancer cells.
Conflict of interest statement
The authors declare no competing interests.
Figures

Similar articles
-
Assessment of pro-apoptotic activity of doxorubicin-transferrin conjugate in cells derived from human solid tumors.Int J Biochem Cell Biol. 2016 Jan;70:57-67. doi: 10.1016/j.biocel.2015.10.020. Epub 2015 Oct 28. Int J Biochem Cell Biol. 2016. PMID: 26520467
-
Efficacy of doxorubicin-transferrin conjugate in apoptosis induction in human leukemia cells through reactive oxygen species generation.Cell Oncol (Dordr). 2016 Apr;39(2):107-18. doi: 10.1007/s13402-015-0256-2. Epub 2015 Nov 26. Cell Oncol (Dordr). 2016. PMID: 26611752 Free PMC article.
-
Rhein reverses doxorubicin resistance in SMMC-7721 liver cancer cells by inhibiting energy metabolism and inducing mitochondrial permeability transition pore opening.Biofactors. 2019 Jan;45(1):85-96. doi: 10.1002/biof.1462. Epub 2018 Nov 29. Biofactors. 2019. PMID: 30496631
-
Mitochondrial bioenergetics of breast cancer.Mitochondrion. 2024 Nov;79:101951. doi: 10.1016/j.mito.2024.101951. Epub 2024 Aug 31. Mitochondrion. 2024. PMID: 39218051 Review.
-
A review of the pathogenesis of mitochondria in breast cancer and progress of targeting mitochondria for breast cancer treatment.J Transl Med. 2025 Jan 15;23(1):70. doi: 10.1186/s12967-025-06077-2. J Transl Med. 2025. PMID: 39815317 Free PMC article. Review.
Cited by
-
Fluorescent Silica Nanoparticles Targeting Mitochondria: Trafficking in Myeloid Cells and Application as Doxorubicin Delivery System in Breast Cancer Cells.Int J Mol Sci. 2022 Mar 12;23(6):3069. doi: 10.3390/ijms23063069. Int J Mol Sci. 2022. PMID: 35328491 Free PMC article.
-
The Combined Impact of Curcumin: Piperine and Sorafenib on microRNAs and Different Pathways in Breast Cancer Cells.Indian J Clin Biochem. 2025 Jan;40(1):32-45. doi: 10.1007/s12291-024-01212-0. Epub 2024 Apr 18. Indian J Clin Biochem. 2025. PMID: 39835241
-
Predictive and Prognostic Relevance of ABC Transporters for Resistance to Anthracycline Derivatives.Biomolecules. 2025 Jul 6;15(7):971. doi: 10.3390/biom15070971. Biomolecules. 2025. PMID: 40723843 Free PMC article.
-
Molecular mechanisms of anthracycline induced cardiotoxicity: Zebrafish come into play.Front Cardiovasc Med. 2023 Mar 10;10:1080299. doi: 10.3389/fcvm.2023.1080299. eCollection 2023. Front Cardiovasc Med. 2023. PMID: 36970353 Free PMC article. Review.
-
Multicore, SDS-Based Polyelectrolyte Nanocapsules as Novel Nanocarriers for Paclitaxel to Reduce Cardiotoxicity by Protecting the Mitochondria.Int J Mol Sci. 2025 Jan 22;26(3):901. doi: 10.3390/ijms26030901. Int J Mol Sci. 2025. PMID: 39940670 Free PMC article.
References
Publication types
MeSH terms
Substances
LinkOut - more resources
Full Text Sources
Other Literature Sources
Medical
Miscellaneous
