. 2021 Feb 25;11(1):4613.
doi: 10.1038/s41598-021-84268-9.

Lipotoxic stress alters the membrane lipid profile of extracellular vesicles released by Huh-7 hepatocarcinoma cells

Affiliations

Lipotoxic stress alters the membrane lipid profile of extracellular vesicles released by Huh-7 hepatocarcinoma cells

Sandra Buratta et al. Sci Rep. .

Abstract

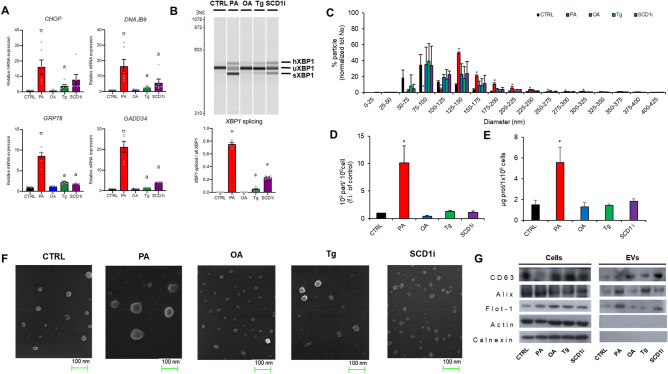
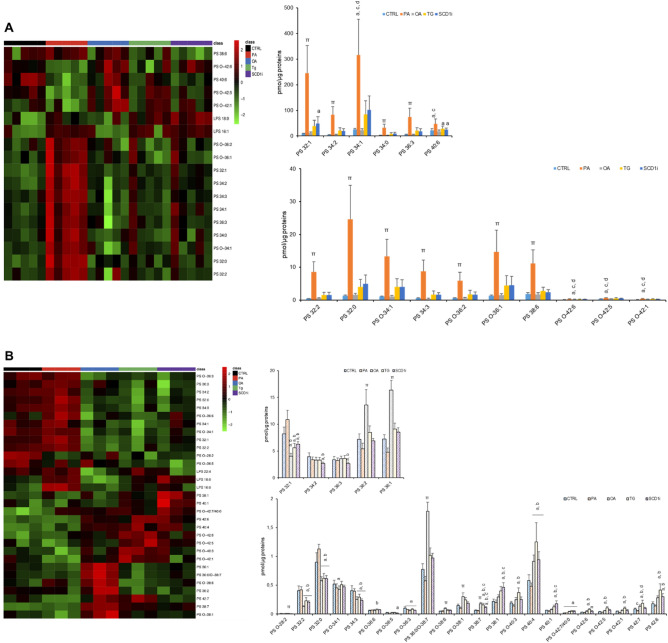
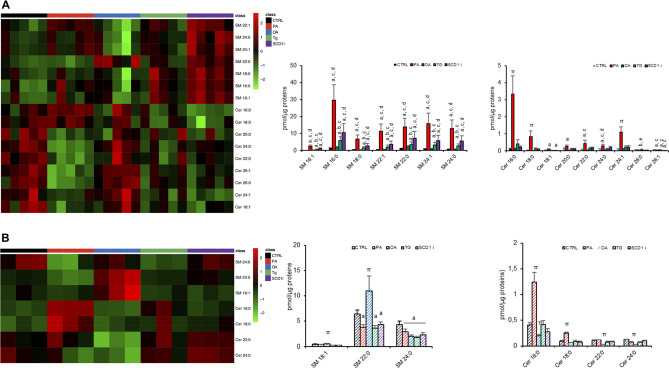
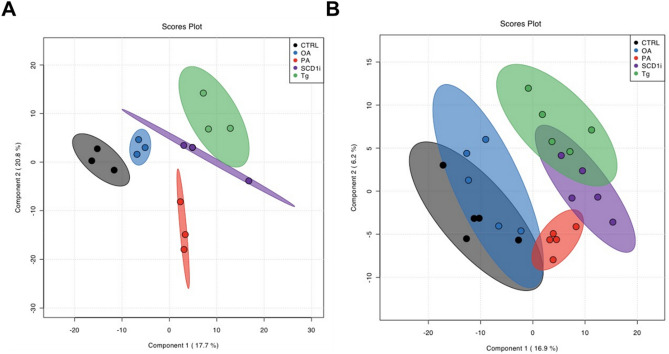
Extracellular vesicles (EVs) are well-known mediators in intercellular communication playing pivotal roles in promoting liver inflammation and fibrosis, events associated to hepatic lipotoxicity caused by saturated free fatty acid overloading. However, despite the importance of lipids in EV membrane architecture which, in turn, affects EV biophysical and biological properties, little is known about the lipid asset of EVs released under these conditions. Here, we analyzed phospholipid profile alterations of EVs released by hepatocarcinoma Huh-7 cells under increased membrane lipid saturation induced by supplementation with saturated fatty acid palmitate or Δ9 desaturase inhibition, using oleate, a nontoxic monounsaturated fatty acid, as control. As an increase of membrane lipid saturation induces endoplasmic reticulum (ER) stress, we also analyzed phospholipid rearrangements in EVs released by Huh-7 cells treated with thapsigargin, a conventional ER stress inducer. Results demonstrate that lipotoxic and/or ER stress conditions induced rearrangements not only into cell membrane phospholipids but also into the released EVs. Thus, cell membrane saturation level and/or ER stress are crucial to determine which lipids are discarded via EVs and EV lipid cargos might be useful to discriminate hepatic lipid overloading and ER stress.


Conflict of interest statement

The authors declare no competing interests.

Figures

Figure 1
Figure 1
Characterization of EVs released from Huh-7 cells under membrane lipid saturation and/or ER stress conditions. EVs were isolated from culture media of Huh-7 cells treated for 16 h with 400 µM of fatty acids (PA or OA), or 2.5 nM Tg, or 5 µM SCD1i or vehicle (CTRL). (A) Expression of UPR-target genes. At the end of incubation, total RNA was extracted and CHOP and DNAJB9, GADD34 and GRP78 mRNAs were quantified by qRT-PCR. The expression level of each gene was normalized to the GAPDH gene and is represented as fold induction over CTRL. Data are reported as mean ± SD (n = 6); p < 0.05 was considered statistically significant by one-way ANOVA and Tukey’s post-hoc analysis; columns with different letters are significantly different (i.e. a vs PA and π vs all). (B) XBP1 splicing measured by RT-PCR and electrophoresis in Huh-7 cell treated with each reagent. (Top) The representative image of electrophoresis. The positions of spliced form (XBP1S), unspliced form (XBP1U), and heteroduplex of these forms (XBP1U + S) are indicated. (Bottom) XBP1 splicing was quantified as the value of the XBP1S over the total XBP1 detected. Data are reported as mean ± SD (n = 6); * p < 0.05 was considered statistically significant to all by one-way ANOVA and Tukey’s post-hoc analysis. C) Size distribution of released EVs by NTA shown the percentage of particles normalized by total number of particles for each condition. Data are the mean ± SD of three preparations. (D) Quantification of the released EVs by NTA. Data are expressed as mean ± SD of three preparations (Student’s multi-t-test * p < 0.05, treated vs CTRL). (E) Recovered EVs quantified as μg proteins/106 cells. Values are the mean ± SD of five preparations (Student’s multi-t-test * p < 0.05, treated vs CTRL). (F) Representative images of EVs by SEM; (G) Western blotting for EV markers. Cell extracts (15 μg) and EVs (2 μg) were separated by SDS-PAGE, electrotransferred and probed with the indicated positive and negative markers of EVs. Western blots are representative of two independent experiments.
Figure 2
Figure 2
Effects of treatment with fatty acids (PA or OA), SCD1 inhibitor or Tg on the levels of PCs and LPCs in Huh-7 cells and their released EVs. Lipid extracts from EVs (A) and from their releasing cells (B) were analyzed by LC/MS–MS. Heatmap of clustering results showing molecular species significantly changed among all the PCs and LPCs detected. Each rectangle represents a lipid colored by its normalized intensity scale from green (decreased level) to red (increased level). The Euclidean metric for distance measurement and the Ward.D algorithm for hierarchical clustering were used. Bar graphs show changes in the abundance of individual lipid species. Data are reported as mean ± SD (n = 3, cells; n = 5, EVs); p < 0.05 was considered statistically significant by one-way ANOVA and Tukey’s post-hoc analysis; columns with different letters are significantly different (i.e. a vs CTRL, b vs PA, c vs OA, d vs Tg, e vs SCD1i and π vs all).
Figure 3
Figure 3
Effects of treatment with fatty acids (PA or OA), SCD1 inhibitor or Tg on the levels of PEs and LPEs in Huh-7 cells and their released EVs. Lipid extracts from EVs (A) and from their releasing cells (B) were analyzed by LC/MS–MS. Heatmap of clustering results showing molecular species significantly changed among all PEs and LPEs detected. Each rectangle represents a lipid colored by its normalized intensity scale from green (decreased level) to red (increased level). The Euclidean metric for distance measurement and the Ward.D algorithm for hierarchical clustering were used. Bar graphs show changes in the abundance of individual lipid species. Data are reported as mean ± SD (n = 3, cells; n = 5, EVs); p < 0.05 was considered statistically significant by one-way ANOVA and Tukey’s post-hoc analysis; columns with different letters are significantly different (i.e. a vs CTRL, b vs PA, c vs OA, d vs Tg, e vs SCD1i and π vs all).
Figure 4
Figure 4
Effects of treatment with fatty acids (PA or OA), SCD1 inhibitor or Tg on the levels of PSs and LPSs in Huh-7 cells and their released EVs. Lipid extracts from EVs (A) and from their releasing cells (B) were analyzed by LC/MS–MS. Heatmap of clustering results showing molecular species significantly changed among all PSs detected. Each rectangle represents a lipid colored by its normalized intensity scale from green (decreased level) to red (increased level). The Euclidean metric for distance measurement and the Ward.D algorithm for hierarchical clustering were used. Bar graphs show changes in the abundance of individual lipid species. Data are reported as mean ± SD (n = 3, cells; n = 5, EVs); p < 0.05 was considered statistically significant by one-way ANOVA and Tukey’s post-hoc analysis; columns with different letters are significantly different (i.e. a vs CTRL, b vs PA, c vs OA, d vs Tg, e vs SCD1i and π vs all).
Figure 5
Figure 5
Characterization of phospholipid classes and fatty acid ratios of Huh-7 cells treated with fatty acids (PA or OA), SCD1 inhibitor or Tg, and of their released EVs. Panels A, C and E show data relative to EVs. Panels B, D and F show data relative to cells. (A, B) PC content (sum of all detected species) expressed as pmol/μg of proteins; ratio of PCs with acyl chains whose sum was < 36 carbons (short chain) to PCs acyl chains whose sum was > 38 carbons (long chains); ratio of saturated to unsaturated PC species. (C, D) PE content (sum of all detected species) expressed as pmol of lipid species/μg of proteins; ratio of PEs with acyl chains whose sum was < 36 carbons (short chain) to PEs with acyl chains whose sum was > 38 carbons (long chains); ratio of saturated to unsaturated PE species. (E, F) PS content (sum of all detected species) expressed as pmol of lipid species/μg of proteins; ratio of PSs with acyl chains whose sum was < 36 carbons (short chain) to PSs with acyl chains whose sum was > 38 carbons (long chains); ratio of saturated to unsaturated PS species. Mean values ± SD (n = 5, EVs; n = 3, cells) are shown (**p < 0.01, * p < 0.05, treated vs CTRL; ANOVA followed with a Dunnett’s multiple comparisons test).
Figure 6
Figure 6
Effects of treatment with fatty acids (PA or OA), SCD1 inhibitor or Tg on the levels of SM and Cer in Huh-7 cells and their released EVs. Heatmap of clustering results showing the molecular species of SM and Cer significantly changed among all lipid species detected. Each rectangle represents a lipid colored by its normalized intensity scale from green (decreased level) to red (increased level). The Euclidean metric for distance measurement and the Ward.D algorithm for hierarchical clustering were used. Bar graphs show changes in the abundance of individual lipid species. Data are reported as mean ± SD (n = 3, cells; n = 5, EVs); p < 0.05 was considered statistically significant by one-way ANOVA and Tukey’s post-hoc analysis; columns with different letters are significantly different (i.e. a vs CTRL, b vs PA, c vs OA, d vs Tg, e vs SCD1i and π vs all).
Figure 7
Figure 7
Multivariate PLS-DA of the lipidomic dataset. PLS-DA analysis of all lipid species identified from control and treated cells (A) and their released EVs (B). Treated groups versus control group. PLS-DA was applied to the cleaned and log-transformed dataset. CI 95% ellipses are shown for the five different groups.
Figure 8
Figure 8
Uptake of EVs released by Huh-7 cells treated with fatty acids (PA or OA), Tg or SCD1i by THP-1 monocytes. (A) In order to demonstrate the internalization of EVs by THP1 we shown only the uptake of EVs derived from control cells. THP-1 cells were exposed to labeled Huh-7-EVs and, after 6 h, cells were fixed, actin filaments stained with FITC-labelled phalloidin and nuclei were counterstained with DAPI. The images are representative of one out of three separate experiments. 0.001 inch = 0.0254 mm; magnification 40 × . (B) Representative flow cytometry histogram plot showing the percentage of DiL-labeled EVs positive THP-1 cells. (C) The percentage of THP-1 cells taking up EVs released by control and treated Huh-7 cells was evaluated by flow cytometry after incubation with DiL-labeled EVs. Data represent the mean ± SD of three experiments after subtracting the background; p < 0.001; Two-way ANOVA, Sidak's multiple comparisons test performed with GraphPad software (a vs CTRL, b vs PA, c vs OA, d vs Tg, e vs SCD1i and π vs all).

Similar articles

Cited by

References

    1. Kalra H, Drummen GP, Mathivanan S. Focus on extracellular vesicles: introducing the next small big thing. Int. J. Mol. Sci. 2016;17:170. doi: 10.3390/ijms17020170. - DOI - PMC - PubMed
    1. Greening DW, Simpson RJ. Understanding extracellular vesicle diversity-current status. Expert. Rev. Proteom. 2018;15:887–910. doi: 10.1080/14789450.2018.1537788. - DOI - PubMed
    1. Hessvik NP, Llorente A. Current knowledge on exosome biogenesis and release. Cell. Mol. Life Sci. 2018;75:193–208. doi: 10.1007/s00018-017-2595-9. - DOI - PMC - PubMed
    1. Buratta S, et al. Extracellular vesicles released by fibroblasts undergoing H-Ras induced senescence show changes in lipid profile. PLoS ONE. 2017;12:e0188840. doi: 10.1371/journal.pone.0188840. - DOI - PMC - PubMed
    1. Skotland T, Sandvig K, Llorente A. Lipids in exosomes: current knowledge and the way forward. Prog. Lipid Res. 2017;66:30–41. doi: 10.1016/j.plipres.2017.03.001. - DOI - PubMed

Publication types

MeSH terms