. 2021 Feb 25;11(1):4615.
doi: 10.1038/s41598-021-84222-9.

Role of the V1G1 subunit of V-ATPase in breast cancer cell migration

Affiliations

Role of the V1G1 subunit of V-ATPase in breast cancer cell migration

Maria De Luca et al. Sci Rep. .

Abstract

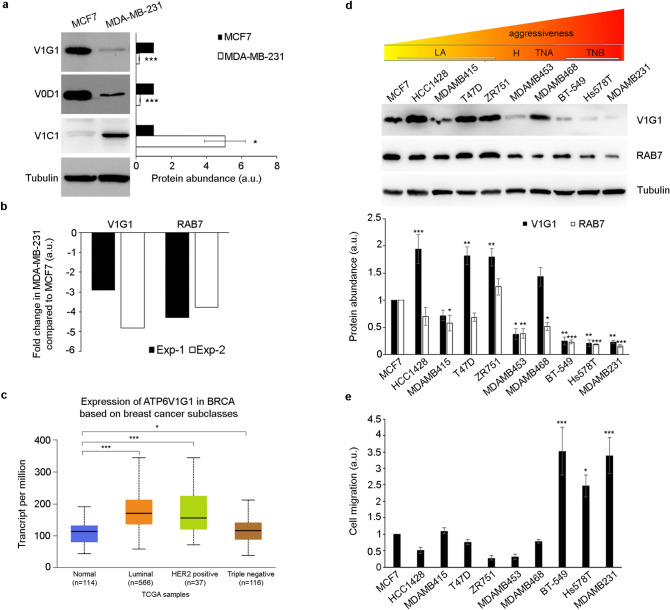
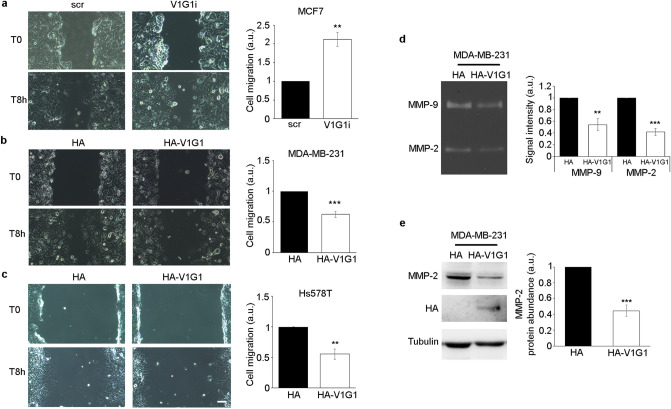
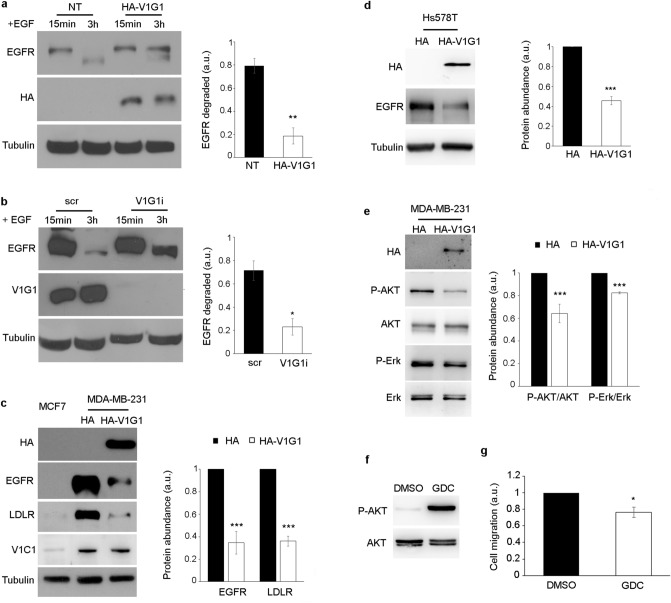
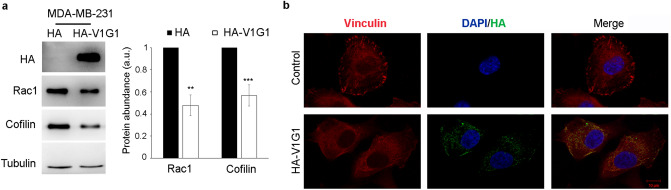
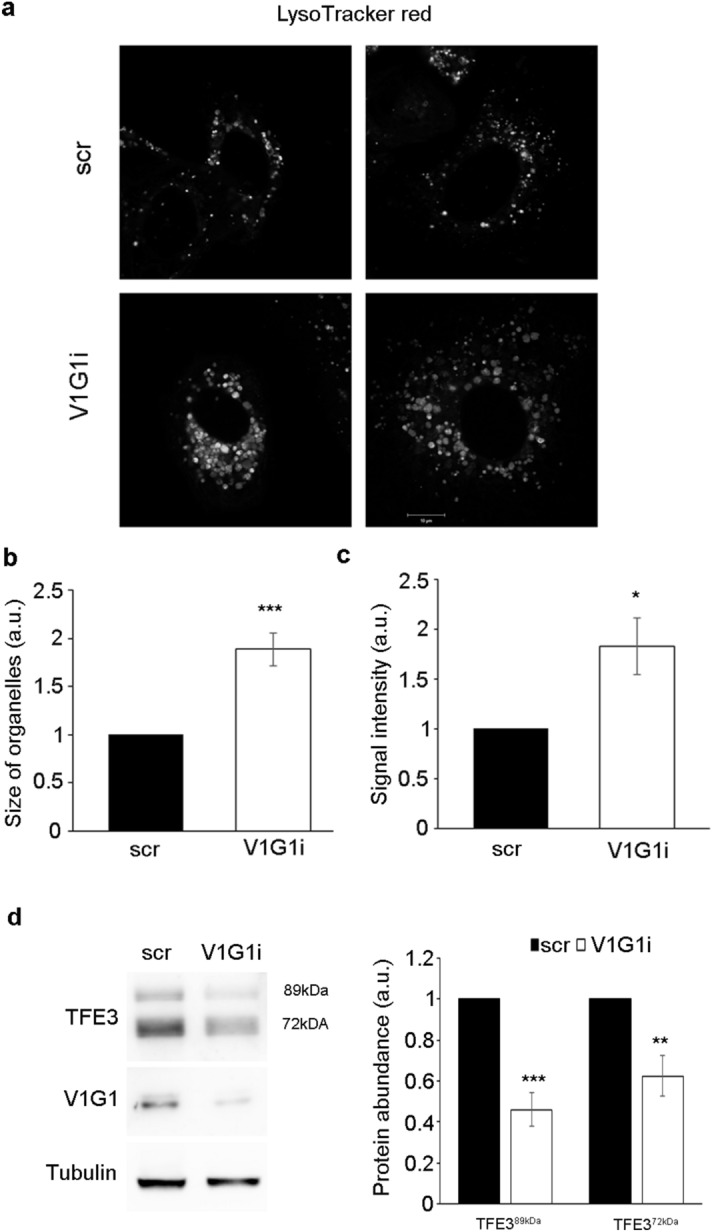
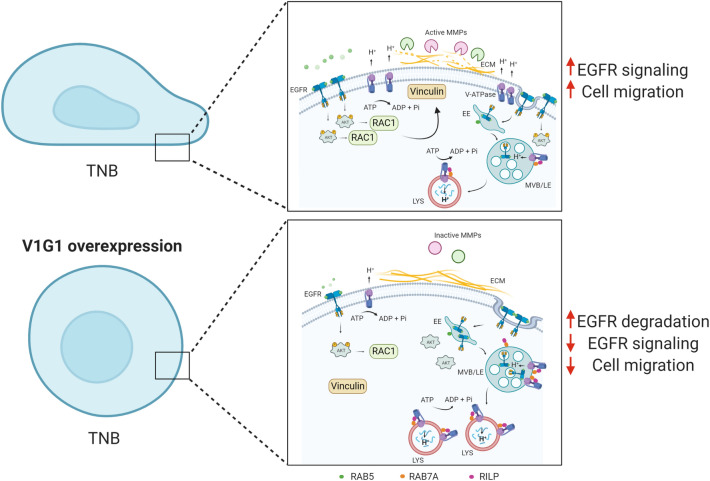
V-ATPase is a large multi-subunit complex that regulates acidity of intracellular compartments and of extracellular environment. V-ATPase consists of several subunits that drive specific regulatory mechanisms. The V1G1 subunit, a component of the peripheral stalk of the pump, controls localization and activation of the pump on late endosomes and lysosomes by interacting with RILP and RAB7. Deregulation of some subunits of the pump has been related to tumor invasion and metastasis formation in breast cancer. We observed a decrease of V1G1 and RAB7 in highly invasive breast cancer cells, suggesting a key role of these proteins in controlling cancer progression. Moreover, in MDA-MB-231 cells, modulation of V1G1 affected cell migration and matrix metalloproteinase activation in vitro, processes important for tumor formation and dissemination. In these cells, characterized by high expression of EGFR, we demonstrated that V1G1 modulates EGFR stability and the EGFR downstream signaling pathways that control several factors required for cell motility, among which RAC1 and cofilin. In addition, we showed a key role of V1G1 in the biogenesis of endosomes and lysosomes. Altogether, our data describe a new molecular mechanism, controlled by V1G1, required for cell motility and that promotes breast cancer tumorigenesis.


Conflict of interest statement

The authors declare no conflict of interest. The funder had no role in the design of the study, in the collection, analyses or interpretation of data, in the writing of the manuscript, or in the decision to publish the results.

Figures

Figure 1
Figure 1
ATP6V1G1 gene expression in breast cancer cell lines. (a) Lysates of MCF7 and MDA-MB-231 cells analyzed by Western blot using specific anti-V1G1, anti-V0D1, anti-V1C1 and anti-tubulin antibodies. Data represent the mean ± s.e.m. of at least three experiments and statistical analysis was performed using Student’s t-test with MCF7 as referring sample. * = p < 0.05; *** = p < 0.001. (b) The amount of ATP6V1G1 and RAB7 transcripts was quantified, compared to the GAPDH transcript as control, using real-time PCR. The results of two independent experiments are shown (Exp-1 and Exp-2). (c) V1G1 expression data from the UALCAN database in breast cancer subclasses compared to normal breast tissues. *p ≤ 0.05; ***p ≤ 0.001. (d) Lysates of the indicated breast cancer cell lines, belonging to LA (luminal A), H (HER2 positive), TNA (triple negative A) and TNB (triple negative B) groups, were analyzed by Western blot using specific anti-V1G1, anti-RAB7, and anti-tubulin antibodies. (e) Wound healing assay of different breast cancer cell lines. Cells were imaged at the initial time point (T0) and 24 h after the scratch. Cell migration was measured as the ratio between closed area of the wound in MCF7 cells (referring sample set to 1) and each cell line. Data in panels d and e represent the mean ± s.e.m of at least three experiments and statistical analysis was performed using one-way ANOVA followed by Dunnett’s multiple comparisons test with control (MCF7 cells) as referring sample set to 1 (a.u. arbitrary unit). *p ≤ 0.05, **p ≤ 0.01, ***p ≤ 0.001.
Figure 2
Figure 2
V1G1 modulates invasive phenotype of breast cancer cells. V1G1-depleted MCF7 (V1G1i) (a) and HA-V1G1 overexpressing MDA-MB-231 (b) or Hs578T cells (c) were imaged during wound healing assay at initial time point (T0) and 8 h after the scratch. Cell migration was measured as the ratio between the closed area of the wound in control cells (HA or scr) and HA-V1G1 overexpressing or V1G1 silenced cells. Scale bar = 100 µm. (d) Gelatin zymography was performed using conditioned medium of MDA-MB-231 cells overexpressing HA-V1G1 and control. Representative results are shown. (e) Western blot analysis was performed using specific anti-MMP-2, anti-HA and anti-tubulin antibodies. Intensity of bands was measured using the software Image Lab. Data represent the mean ± s.e.m. of at least three experiments. Statistical analysis was performed using Student’s t-test with control cells (scr or HA) as referring sample set to 1. **p ≤ 0.01; ***p ≤ 0.001.
Figure 3
Figure 3
V1G1 controls EGFR stability and signaling. HA-V1G1 overexpressing (a) or V1G1-depleted (b) HeLa cells were treated with 10 ug/ml of cycloheximide for 1 h and stimulated for 15 min or 3 h with 100 ng/ml EGF. Lysates were analyzed by Western blot using specific anti-EGFR, anti-HA, anti-V1G1 and anti-tubulin antibodies. The amount of EGFR degraded at 3 h was quantified using ImageJ software and plotted as a percentage of the respective intensity at 15 min. Values at 15 min were set to 1. (c) Lysates of MDA-MB-231 overexpressing HA-V1G1 and MCF7 cells were analyzed by Western blot using specific anti-HA, anti-EGFR, anti-LDLR, anti-V1C1, and anti-tubulin antibodies. Intensities of bands were measured by densitometry and normalized against tubulin. (d) Lysates of Hs578T cells overexpressing HA or HA-V1G1 were analyzed by Western blot using the indicated antibodies. Intensities of bands were measured by densitometry and normalized against tubulin. (e) Lysates of control (HA) and HA-V1G1 overexpressing MDA-MB-231 cells were analyzed by immunoblotting using the indicated antibodies. Bands were quantified by densitometry and normalized against total protein. (f) MDA-MB-231 cells treated for 24 h with 1 µM GDC-0068 were lysed and analyzed by Western blot using the indicated antibodies. (g) Cell migration was measured as the ratio between closed area of the wound in control cells incubated with DMSO (set to 1) and cells treated with GDC-0068. Data represent the mean ± s.e.m. of at least three experiments. Student’s t-test. *p ≤ 0.05, **p ≤ 0.01, ***p ≤ 0.001.
Figure 4
Figure 4
V1G1 overexpression affects RAC1 signaling. (a) MDA-MB-231 cells overexpressing HA-V1G1 and control (HA) were lysed and subjected to western blot analysis using anti-HA, anti-RAC1, anti-cofilin and anti-tubulin antibody. Quantification of RAC1 and cofilin protein amount is shown. Data represent the mean ± s.e.m. of at least three experiments. **p ≤ 0.01; i***p ≤ 0.001. (b) HA-V1G1 overexpressing MDA-MB-231 cells were immunolabeled with anti-HA followed by Alexa488 conjugated secondary antibody to discriminate between cells overexpressing HA-V1G1 and control cells, anti-vinculin followed by Alexa568 conjugated secondary antibody while nuclei were stained with DAPI. Bars = 10 µm.
Figure 5
Figure 5
RAB7 in breast cancer cells. (a) Lysates of MCF7 and MDA-MB-231 cells were analyzed by Western blot using specific anti-RAB7, anti-RAB5, anti-RAB6, anti-RILP, and anti-tubulin antibodies. Intensities of bands were measured by densitometry and normalized against tubulin. (b) MDA-MB-231 overexpressing HA-RAB7 were imaged during wound healing assay at initial time point T0 and 8 h after the scratch. Cell migration was measured as the ratio between the closed area of the wound in control (HA) and HA-RAB7 overexpressing cells. (c) MDA-MB-231 overexpressing HA-RAB7 were lysed and analyzed by Western blot using specific anti-HA, anti-EGFR, and anti-tubulin antibodies. Intensities of bands were measured by densitometry and normalized against tubulin. Data represent the mean ± s.e.m. of at least three experiments. Student’s t-test. *p ≤ 0.05, **p ≤ 0.01, ***p ≤ 0.001.
Figure 6
Figure 6
V1G1 modulates late endocytic compartments in MCF7 cells. (a) V1G1-depleted MCF7 cells (V1G1i) were labeled with Lysotracker Red and analyzed by confocal microscopy, scale bar: 10 µm. (b) The size of organelles was quantified by ImageJ software. Data represent the mean ± s.e.m. (at least 4 independent experiments, ≥ 15 cells /sample for each experiment) ***p ≤ 0.001. (c) Lysotracker Red intensity was quantified by ImageJ software and Corrected Total Cell Fluorescence was calculated. Data represent the mean ± s.e.m. (at least 4 independent experiments, ≥ 15 cells/sample for each experiment) *p ≤ 0.01. (d) Relative protein abundance of the two active isoforms of TFE3 and V1G1 was assessed by western blotting, quantified by densitometry and normalizing against tubulin. Data represent the mean ± s.e.m of at least three independent experiments (*p ≤ 0.01, **p ≤ 0.01, ***p ≤ 0.001).
Figure 7
Figure 7
Proposed molecular model. In TNB breast cancer cell lines, overexpression of V1G1 affects cell migration in vitro by modulating EGFR stability and signaling that control activation of RAC1 and vinculin assembly. Similarly, overexpression of RAB7 affects EGFR degradation but also positioning of V-ATPase on endocytic organelles through RILP. In addition, overexpression of V1G1 reduces activation of MMPs that degrade extracellular matrix favoring cell migration in vivo. ECM extra-cellular matrix, EE early endosome, MVB multivesicular bodies, LE late endosome, LYS lysosome. Created with Biorender.com.

Similar articles

Cited by

References

    1. Collins MP, Forgac M. Regulation of V-ATPase assembly in nutrient sensing and function of V-ATPases in breast cancer metastasis. Front. Physiol. 2018;9:902. doi: 10.3389/fphys.2018.00902. - DOI - PMC - PubMed
    1. Whitton B, Okamoto H, Packham G, Crabb SJ. Vacuolar ATPase as a potential therapeutic target and mediator of treatment resistance in cancer. Cancer Med. 2018;7:3800–3811. doi: 10.1002/cam4.1594. - DOI - PMC - PubMed
    1. Futai M, Sun-Wada GH, Wada Y, Matsumoto N, Nakanishi-Matsui M. Vacuolar-type ATPase: a proton pump to lysosomal trafficking. Proc. Jpn. Acad. Ser. B Phys. Biol. Sci. 2019;95:261–277. doi: 10.2183/pjab.95.018. - DOI - PMC - PubMed
    1. Rahman S, et al. Binding interactions of the peripheral stalk subunit isoforms from human V-ATPase. Biosci. Biotechnol. Biochem. 2016;80:878–890. doi: 10.1080/09168451.2015.1135043. - DOI - PubMed
    1. Cantalupo G, Alifano P, Roberti V, Bruni CB, Bucci C. Rab-interacting lysosomal protein (RILP): the Rab7 effector required for transport to lysosomes. EMBO J. 2001;20:683–693. doi: 10.1093/emboj/20.4.683. - DOI - PMC - PubMed

Publication types

MeSH terms

Substances