

A genome-wide association and polygenic risk score study on abnormal electrocardiogram in a Chinese population
- PMID: 33633301
- PMCID: PMC7907205
- DOI: 10.1038/s41598-021-84135-7
A genome-wide association and polygenic risk score study on abnormal electrocardiogram in a Chinese population
Erratum in
-
Author Correction: A genome-wide association and polygenic risk score study on abnormal electrocardiogram in a Chinese population.Sci Rep. 2021 Nov 1;11(1):21755. doi: 10.1038/s41598-021-01355-7. Sci Rep. 2021. PMID: 34725410 Free PMC article. No abstract available.
Abstract
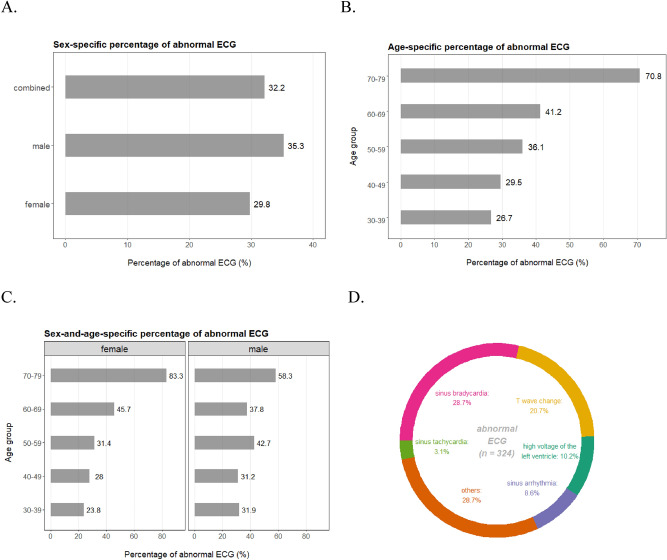
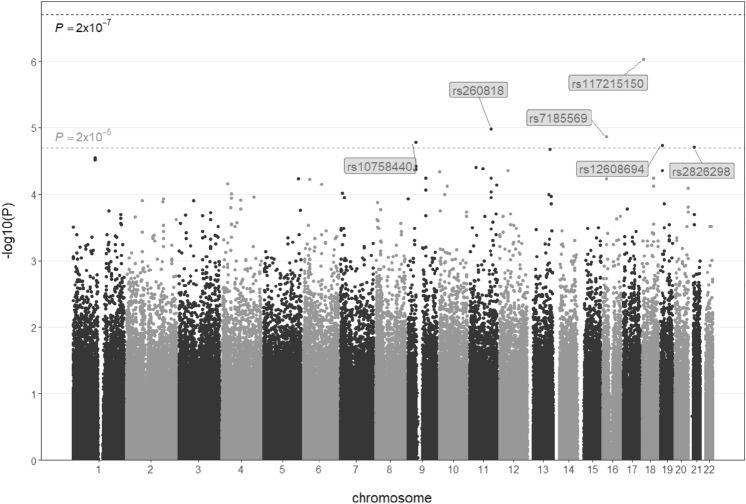
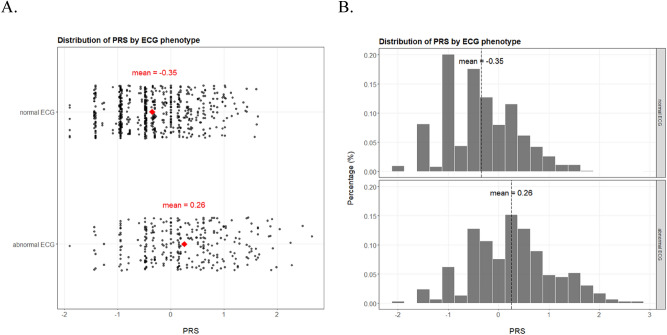
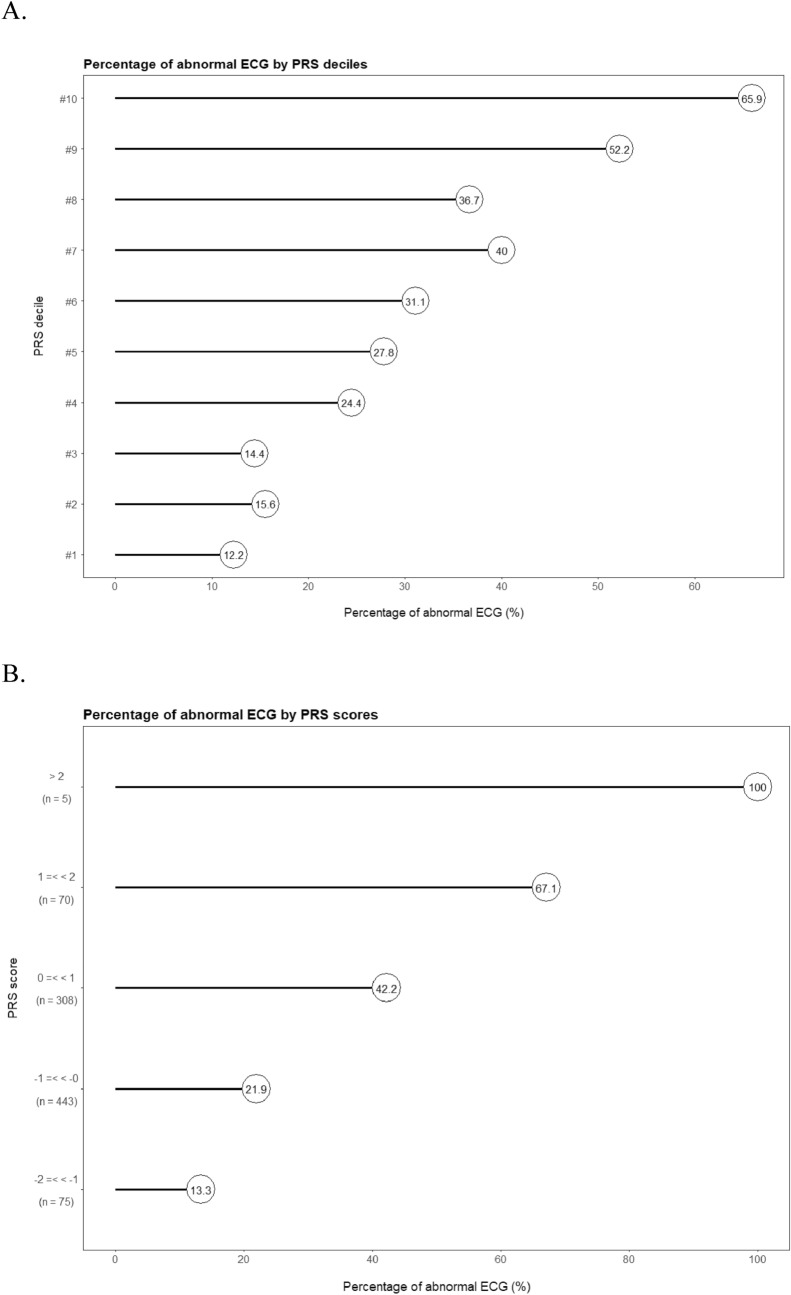
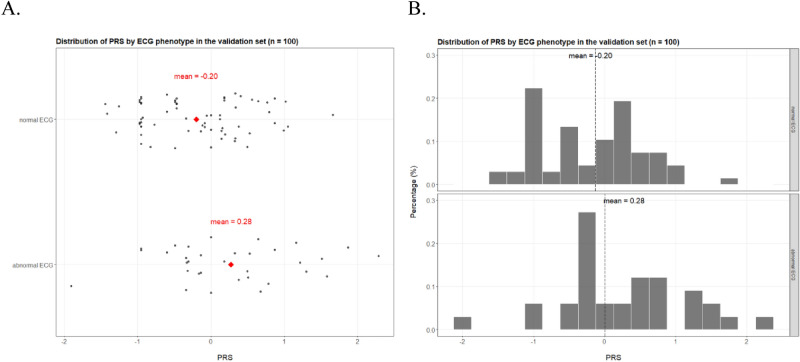
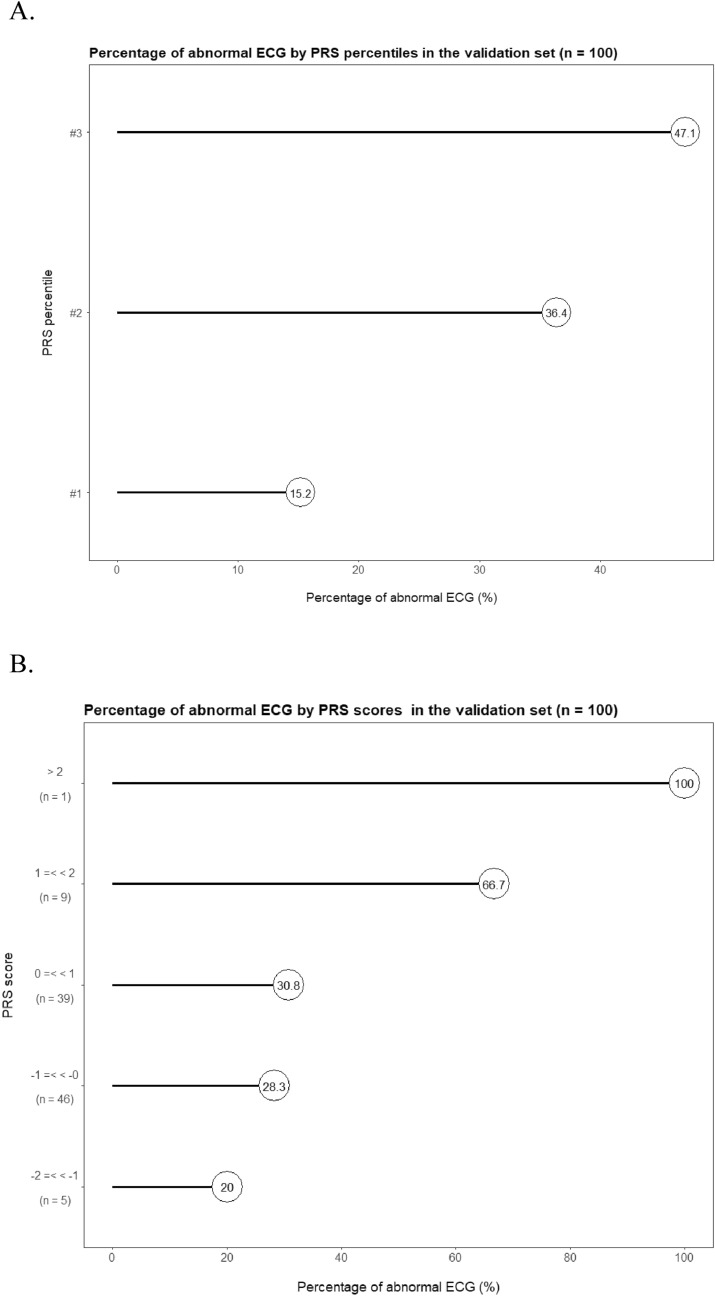
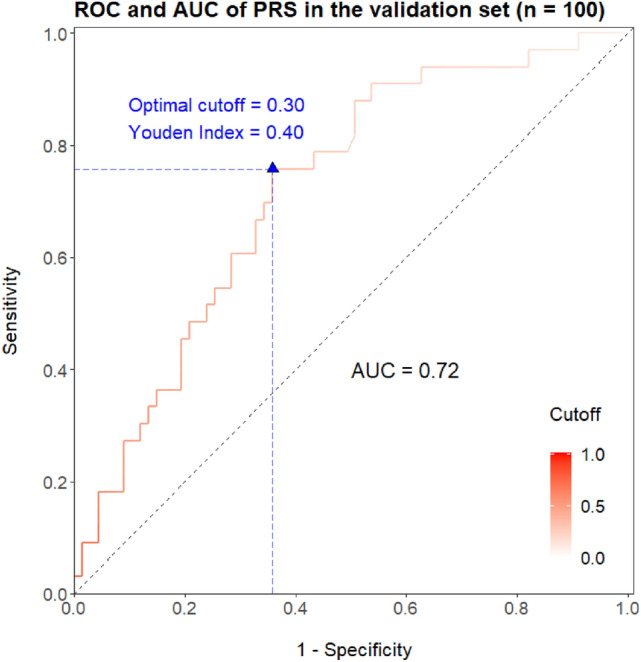
Electrocardiography is a common and widely-performed medical examination based on the measurement and evaluation of electrocardiogram (ECG) to assess the up-to-date cardiac rhythms and thus suggest the health conditions of cardiovascular system and on a larger level the individual's wellness. Abnormal ECG assessment from the detection of abnormal heart rhythms may have clinical implications including blood clots in formation, ongoing heart attack, coronary artery blockage, etc. Past genetic-phenotypic research focused primarily on the physical parameters of ECG but not the medical evaluation. To unbiasedly uncover the underlying links of genetic variants with normal vs. abnormal ECG assessment, a genome-wide association study (GWAS) is carried out in a 1006-participant cohort of Chinese population effectively genotyped for 243487 single nucleotide polymorphisms (SNPs). Both age and sex are influential factors, and six novel SNPs are identified for potential association with abnormal ECG. With the selected SNPs, a polygenic risk score (PRS) differentiates the case-control subgroups, and correlates well with increased risk of abnormal ECG. The findings are reproduced in an independent validation cohort. The derived PRS may function as a potential biomarker for prospectively screening the high-risk subgroup of heart issues in the Chinese population.
Conflict of interest statement
The authors declare no competing interests.
Figures
Similar articles
-
Association of Polygenic Risk Score with Age at Onset and Cerebrospinal Fluid Biomarkers of Alzheimer's Disease in a Chinese Cohort.Neurosci Bull. 2020 Jul;36(7):696-704. doi: 10.1007/s12264-020-00469-8. Epub 2020 Feb 18. Neurosci Bull. 2020. PMID: 32072450 Free PMC article.
-
Genetic Architecture Associated With Familial Short Stature.J Clin Endocrinol Metab. 2020 Jun 1;105(6):dgaa131. doi: 10.1210/clinem/dgaa131. J Clin Endocrinol Metab. 2020. PMID: 32170311
-
[Polygenic scores and cancer risk].Med Sci (Paris). 2020 May;36(5):535-537. doi: 10.1051/medsci/2020088. Epub 2020 May 26. Med Sci (Paris). 2020. PMID: 32452380 French.
-
Polygenic Risk Scores to Identify CVD Risk and Tailor Therapy: Hope or Hype?Curr Atheroscler Rep. 2021 Jun 28;23(9):47. doi: 10.1007/s11883-021-00950-3. Curr Atheroscler Rep. 2021. PMID: 34181090 Review.
-
The emerging field of polygenic risk scores and perspective for use in clinical care.Hum Mol Genet. 2020 Oct 20;29(R2):R165-R176. doi: 10.1093/hmg/ddaa136. Hum Mol Genet. 2020. PMID: 32620971 Review.
Cited by
-
Cross-modal autoencoder framework learns holistic representations of cardiovascular state.Nat Commun. 2023 Apr 28;14(1):2436. doi: 10.1038/s41467-023-38125-0. Nat Commun. 2023. PMID: 37105979 Free PMC article.
References
-
- Delewi R, Ijff G, van de Hoef TP, Hirsch A, Robbers LF, Nijveldt R, van der Laan AM, van der Vleuten PA, Lucas C, Tijssen JG, et al. Pathological Q waves in myocardial infarction in patients treated by primary PCI. JACC Cardiovasc. Imaging. 2013;6:324–331. doi: 10.1016/j.jcmg.2012.08.018. - DOI - PubMed
-
- Dhingra R, Pencina MJ, Wang TJ, Nam BH, Benjamin EJ, Levy D, Larson MG, Kannel WB, D'Agostino RB, Sr, Vasan RS. Electrocardiographic QRS duration and the risk of congestive heart failure: The Framingham Heart Study. Hypertension. 2006;47:861–867. doi: 10.1161/01.HYP.0000217141.20163.23. - DOI - PubMed
Publication types
MeSH terms
Substances
LinkOut - more resources
Full Text Sources
Other Literature Sources
Miscellaneous
