

Tillage effects on soil properties and crop yield after land reclamation
- PMID: 33633306
- PMCID: PMC7907092
- DOI: 10.1038/s41598-021-84191-z
Tillage effects on soil properties and crop yield after land reclamation
Abstract
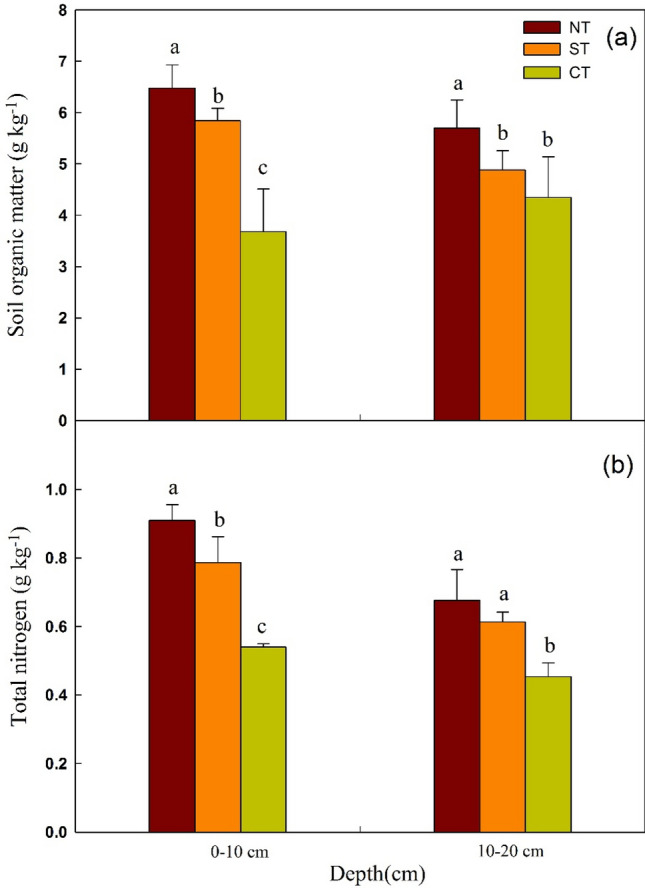
Tillage treatments have an important effect on soil microstructure characteristics, water thermal properties and nutrients, but little is known in the newly reclaimed cultivated land. For the reason, a long-term field study was to evaluate the tillage effects on soil physicochemical properties and crop yield in newly reclaimed cultivated land via the macroscopic and microscopic analysis. Three tillage treatments were tested: continuous conventional moldboard plow tillage (CT), sub-soiling/moldboard-tillage/sub-soiling tillage (ST) and no-tillage/sub-soiling/no-tillage (NT). Under CT, the microstructure was dominated by weakly separated plates structure and showed highest bulk density (BD) (1.49 g cm-3) and lowest soil organic matter (SOM) (3.68 g kg-1). In addition, CT reduced the capacity of soil moisture retention and temperature maintenance, resulting in aggregate structure deterioration and fragility. Unlike CT, the soil was characterized by moderately separated granular structure and highly separated aggregate structure under conservation tillage practice of ST and NT. NT was associated with the highest soil moisture content (20.42%), highest quantity of macroaggregates (> 0.25 mm) by wet-sieving (34.07%), and highest SOM (6.48 g kg-1) in the surface layer. Besides, NT was better able to regulate soil temperature and improved the values of geometric mean diameter. Under NT and ST, a stable soil structure with compound aggregates and pores was formed, and the maize yield was increased by 12.9% and 14.9% compared with CT, up to 8512.6 kg ha-1 and 8740.9 kg ha-1, respectively. These results demonstrated the positive effects of NT and ST on soil quality and crop yield in newly reclaimed cultivated land.
Conflict of interest statement
The authors declare no competing interests.
Figures


References
-
- Han J, Zhang Y. Land policy and land engineering. Land Use Policy. 2014;40:64–68. doi: 10.1016/j.landusepol.2013.09.015. - DOI
-
- Liu YS. Introduction to land use and rural sustainability in China. Land Use Policy. 2018;74:1–4. doi: 10.1016/j.landusepol.2018.01.032. - DOI
-
- Liu YS, Li JT, Yang YY. Strategic adjustment of land use policy under the economic transformation. Land Use Policy. 2018;74:5–14. doi: 10.1016/j.landusepol.2017.07.005. - DOI
-
- Yi L, et al. Spatial-temporal change of major reserve resources of cultivated land in China in recent 30 years. Trans. CSAE (in Chinese) 2013;29:1–12.
-
- Zhang Y, Li ZB, Dong QG. Analysis of water and nutrients leakage on barren gravel land with different structure of topsoil. J. Soil Water Conserv. 2018;32:162–166.
Publication types
LinkOut - more resources
Full Text Sources
Other Literature Sources
Research Materials
