. 2021 Feb 25;11(1):4617.
doi: 10.1038/s41598-021-84245-2.

Airborne dispersion of droplets during coughing: a physical model of viral transmission

Affiliations

Airborne dispersion of droplets during coughing: a physical model of viral transmission

Hongying Li et al. Sci Rep. .

Abstract

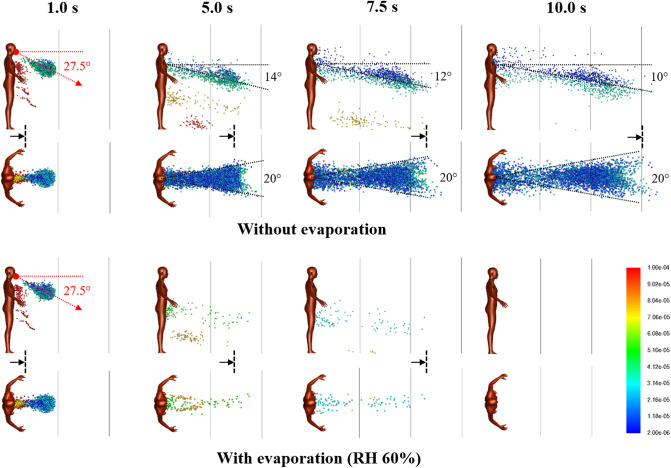
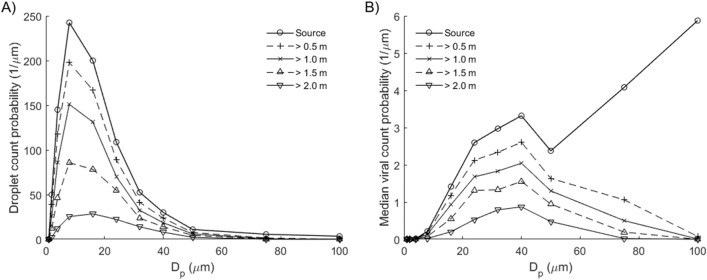
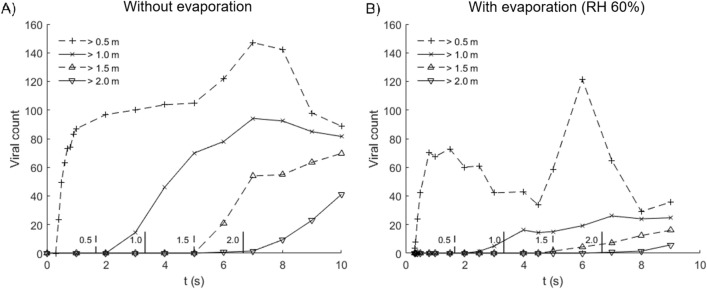
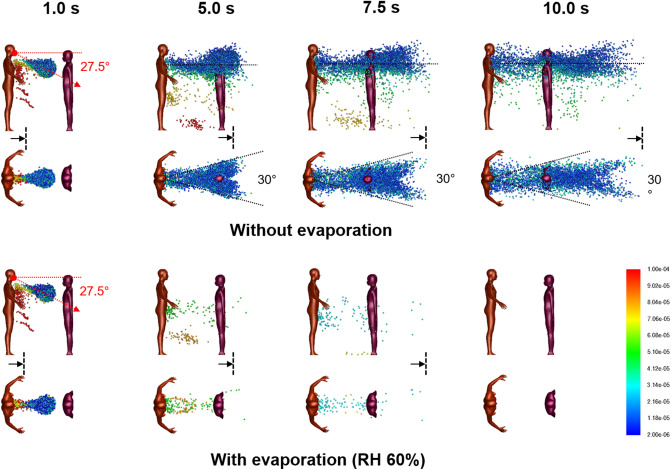
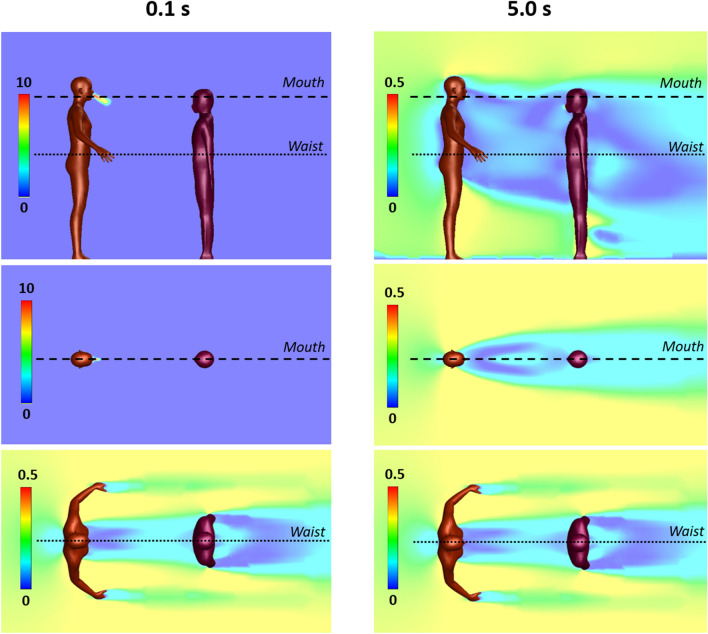
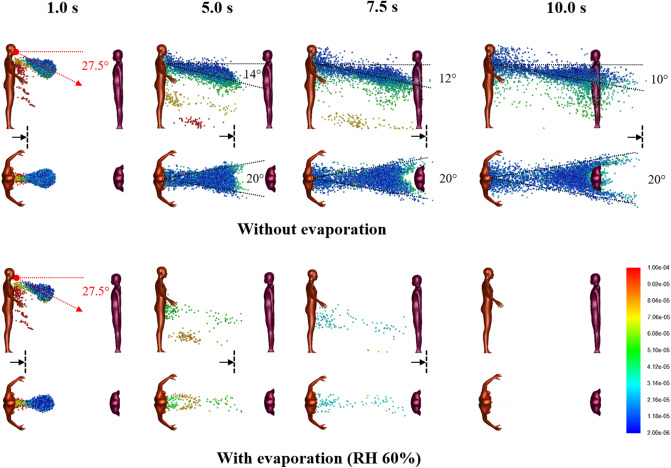
The Covid-19 pandemic has focused attention on airborne transmission of viruses. Using realistic air flow simulation, we model droplet dispersion from coughing and study the transmission risk related to SARS-CoV-2. Although this model defines most airborne droplets as 8-16 µm in diameter, we infer that larger droplets of 32-40 µm in diameter may potentially be more infectious due to higher viral content. Use of face masks is therefore recommended for both personal and social protection. We found social distancing effective at reducing transmission potential across all droplet sizes. However, the presence of a human body 1 m away modifies the aerodynamics so that downstream droplet dispersion is enhanced, which has implications on safe distancing in queues. At 1 m distance, we found that an average of 0.55 viral copies is inhaled for a cough at median loading, scalable up to 340 copies at peak loading. Droplet evaporation results in significant reduction in droplet counts, but airborne transmission remains possible even under low humidity conditions.


Conflict of interest statement

The authors declare no competing interests.

Figures

Figure 1
Figure 1
Droplet dispersion (side and top-down views) from a single cough inclined downwards at 27.5° for non-evaporative (top) and evaporative (bottom) cases at relative humidity of 60%. Color bar indicates droplet sizes (2–100 µm). Vertical lines are spaced 1 m apart and arrows are drift markers based on a background wind speed of 0.3 m/s. Ambient air temperature is 25 °C and breath temperature is 36 °C. Plume angles 14–10° from the chest 10 s after the cough and lateral dispersion fits a 20° forward wedge.
Figure 2
Figure 2
Airborne droplets with horizontal distances exceeding indicated distances from source, time-averaged up to 10 s since onset of cough, adjusted for wind drift (0.3 m/s). (A) Droplet count probability. Mode: 8–16 µm. (B) Median viral count probability based on median viral load (3.3 × 106 copies/mL). Mode: 32–40 µm. Droplets larger than 75 µm have low airborne transmission potential despite high viral counts.
Figure 3
Figure 3
Median viral count collected at indicated distances from source in time, for cases (A) without evaporation and (B) with evaporation at relative humidity of 60%. Evaporated droplets persist as droplet nuclei which may pose infection risk over extended distance and time scales. Vertical lines along the abscissa denote the time required for wind drift to cover the indicated distance (m).
Figure 4
Figure 4
Droplet dispersion (side and top-down views) from a single cough inclined downwards at 27.5° for non-evaporative (top) and evaporative (bottom) cases at relative humidity of 60%. Listener is 1 m away facing Cougher. Color bar indicates droplet sizes (2–100 µm). Arrows represent drift markers based on a background wind speed of 0.3 m/s. Ambient air temperature is 25 °C and breath temperature is 36 °C. Plume is aligned horizontally from the chest up to 10 s after the cough and lateral dispersion fit a 30° forward wedge.
Figure 5
Figure 5
Velocity fields between a Cougher and a Listener spaced 1 m apart at 0.1 and 5 s following a single cough inclined downwards at 27.5°. Color bar indicates velocity magnitude. Top panels: side view (center plane); middle panels: top-down view (cross-section at Cougher mouth level); Bottom panels: top-down view (cross-section at Cougher waist level) reveals steady flow fields.
Figure 6
Figure 6
Droplet dispersion (side and top-down views) from a single cough inclined downwards at 27.5° for non-evaporative (top) and evaporative (bottom) cases at relative humidity of 60%. Listener is 2 m away facing Cougher. Color bar indicates droplet sizes (2–100 µm). Vertical lines are spaced 1 m apart and arrows are drift markers based on a background wind speed of 0.3 m/s. Ambient air temperature is 25 °C and breath temperature is 36 °C. Plume angles 14–10° from the chest level and lateral dispersion fits a 20° forward wedge.
Figure 7
Figure 7
Droplet and virus deposition on the surfaces of the Listener model, including body (1.43 m2), mouth (3.5 cm2) and mask (288 cm2). (A) Droplet deposition count probability. Modes: 8–16 µm (body; 1 m), 16–24 µm (body; 2 m) and 4–8 µm (mouth/mask). (B) Median viral deposition count probability (3.3 × 106 copies/mL). Modes: 32–40 µm (body; 1 m) and 24–32 µm (body; 2 m). Inset shows viral deposition count probabilities for mouth and mask. Mode: 16–24 µm (mouth/mask; 1 m). For 1 m distancing, the total deposited viral counts on the Listener model are 25.3 (body), 0.55 (mouth) and 0.72 (mask).

References

    1. Wang D, et al. Clinical characteristics of 138 hospitalized patients with 2019 novel coronavirus-infected pneumonia in Wuhan, China. JAMA. 2020;323(11):1061–1069. doi: 10.1001/jama.2020.1585. - DOI - PMC - PubMed
    1. Asadi S, Bouvier N, Wexler AS, Ristenpart WD. The coronavirus pandemic and aerosols: Does COVID-19 transmit via expiratory particles? Aerosol Sci. Technol. 2020;54(6):635–638. doi: 10.1080/02786826.2020.1749229. - DOI - PMC - PubMed
    1. Peng X, et al. Transmission routes of 2019-nCoV and controls in dental practice. Int. J. Oral Sci. 2020;12(1):1–6. doi: 10.1038/s41368-020-0075-9. - DOI - PMC - PubMed
    1. Morawska L, Cao J. Airborne transmission of SARS-CoV-2: The world should face the reality. Environ. Int. 2020;139:105730. doi: 10.1016/j.envint.2020.105730. - DOI - PMC - PubMed
    1. Chia PY, et al. Detection of air and surface contamination by SARS-CoV-2 in hospital rooms of infected patients. Nat. Commun. 2020;11(1):1–7. doi: 10.1038/s41467-020-16670-2. - DOI - PMC - PubMed