Meta-Analysis
. 2021 May;45(5):1017-1029.
doi: 10.1038/s41366-021-00761-1. Epub 2021 Feb 26.

Admixture/fine-mapping in Brazilians reveals a West African associated potential regulatory variant (rs114066381) with a strong female-specific effect on body mass and fat mass indexes

Affiliations
Meta-Analysis

Admixture/fine-mapping in Brazilians reveals a West African associated potential regulatory variant (rs114066381) with a strong female-specific effect on body mass and fat mass indexes

Marilia O Scliar et al. Int J Obes (Lond). 2021 May.

Abstract

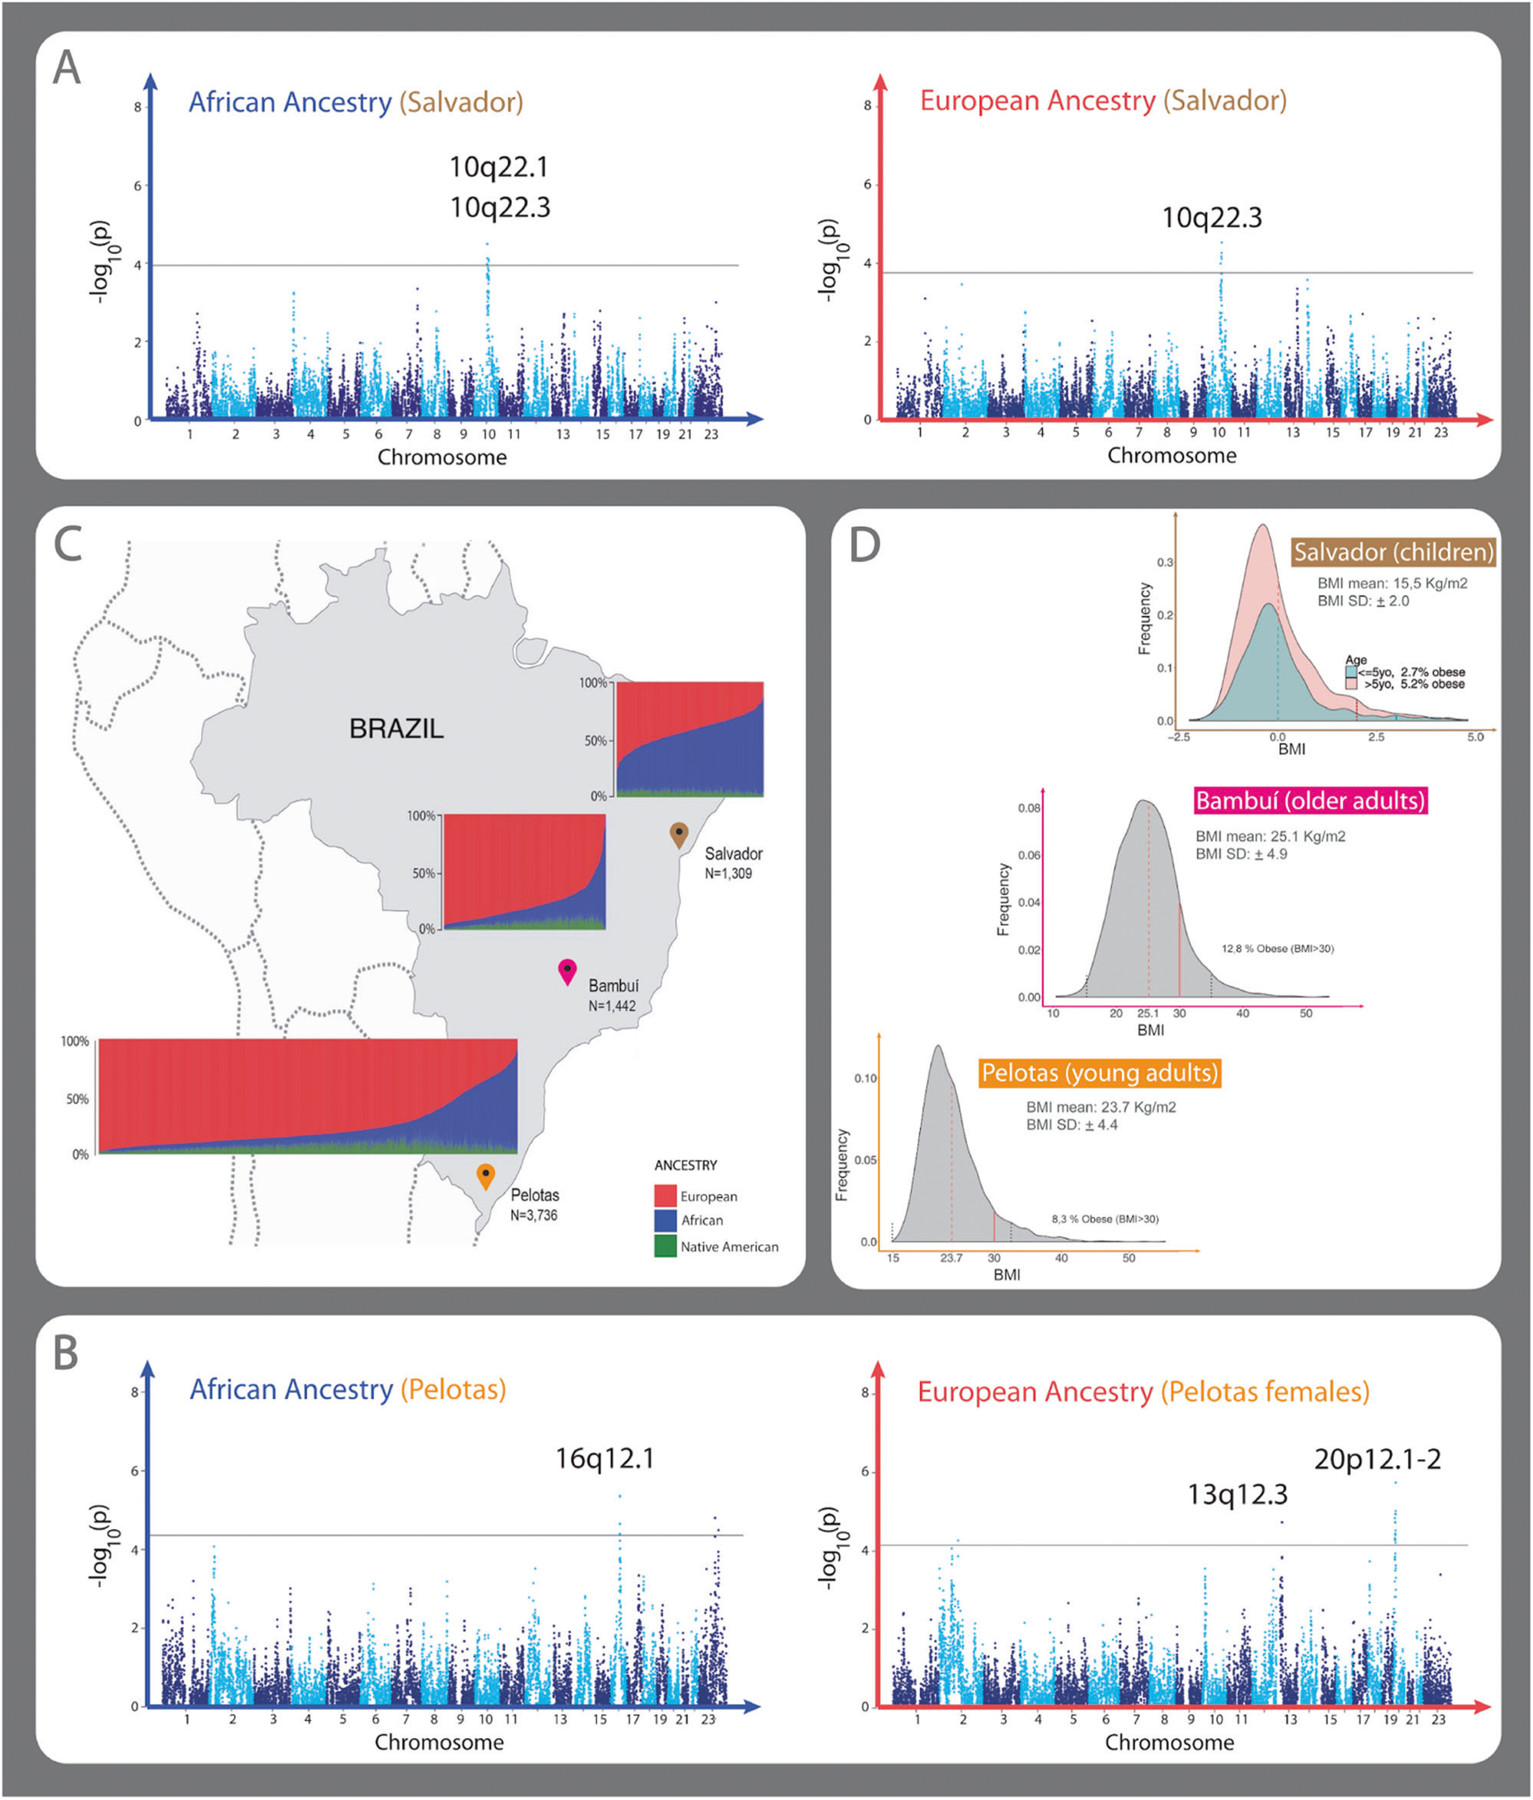
Background/objectives: Admixed populations are a resource to study the global genetic architecture of complex phenotypes, which is critical, considering that non-European populations are severely underrepresented in genomic studies. Here, we study the genetic architecture of BMI in children, young adults, and elderly individuals from the admixed population of Brazil.

Subjects/methods: Leveraging admixture in Brazilians, whose chromosomes are mosaics of fragments of Native American, European, and African origins, we used genome-wide data to perform admixture mapping/fine-mapping of body mass index (BMI) in three Brazilian population-based cohorts from Northeast (Salvador), Southeast (Bambuí), and South (Pelotas).

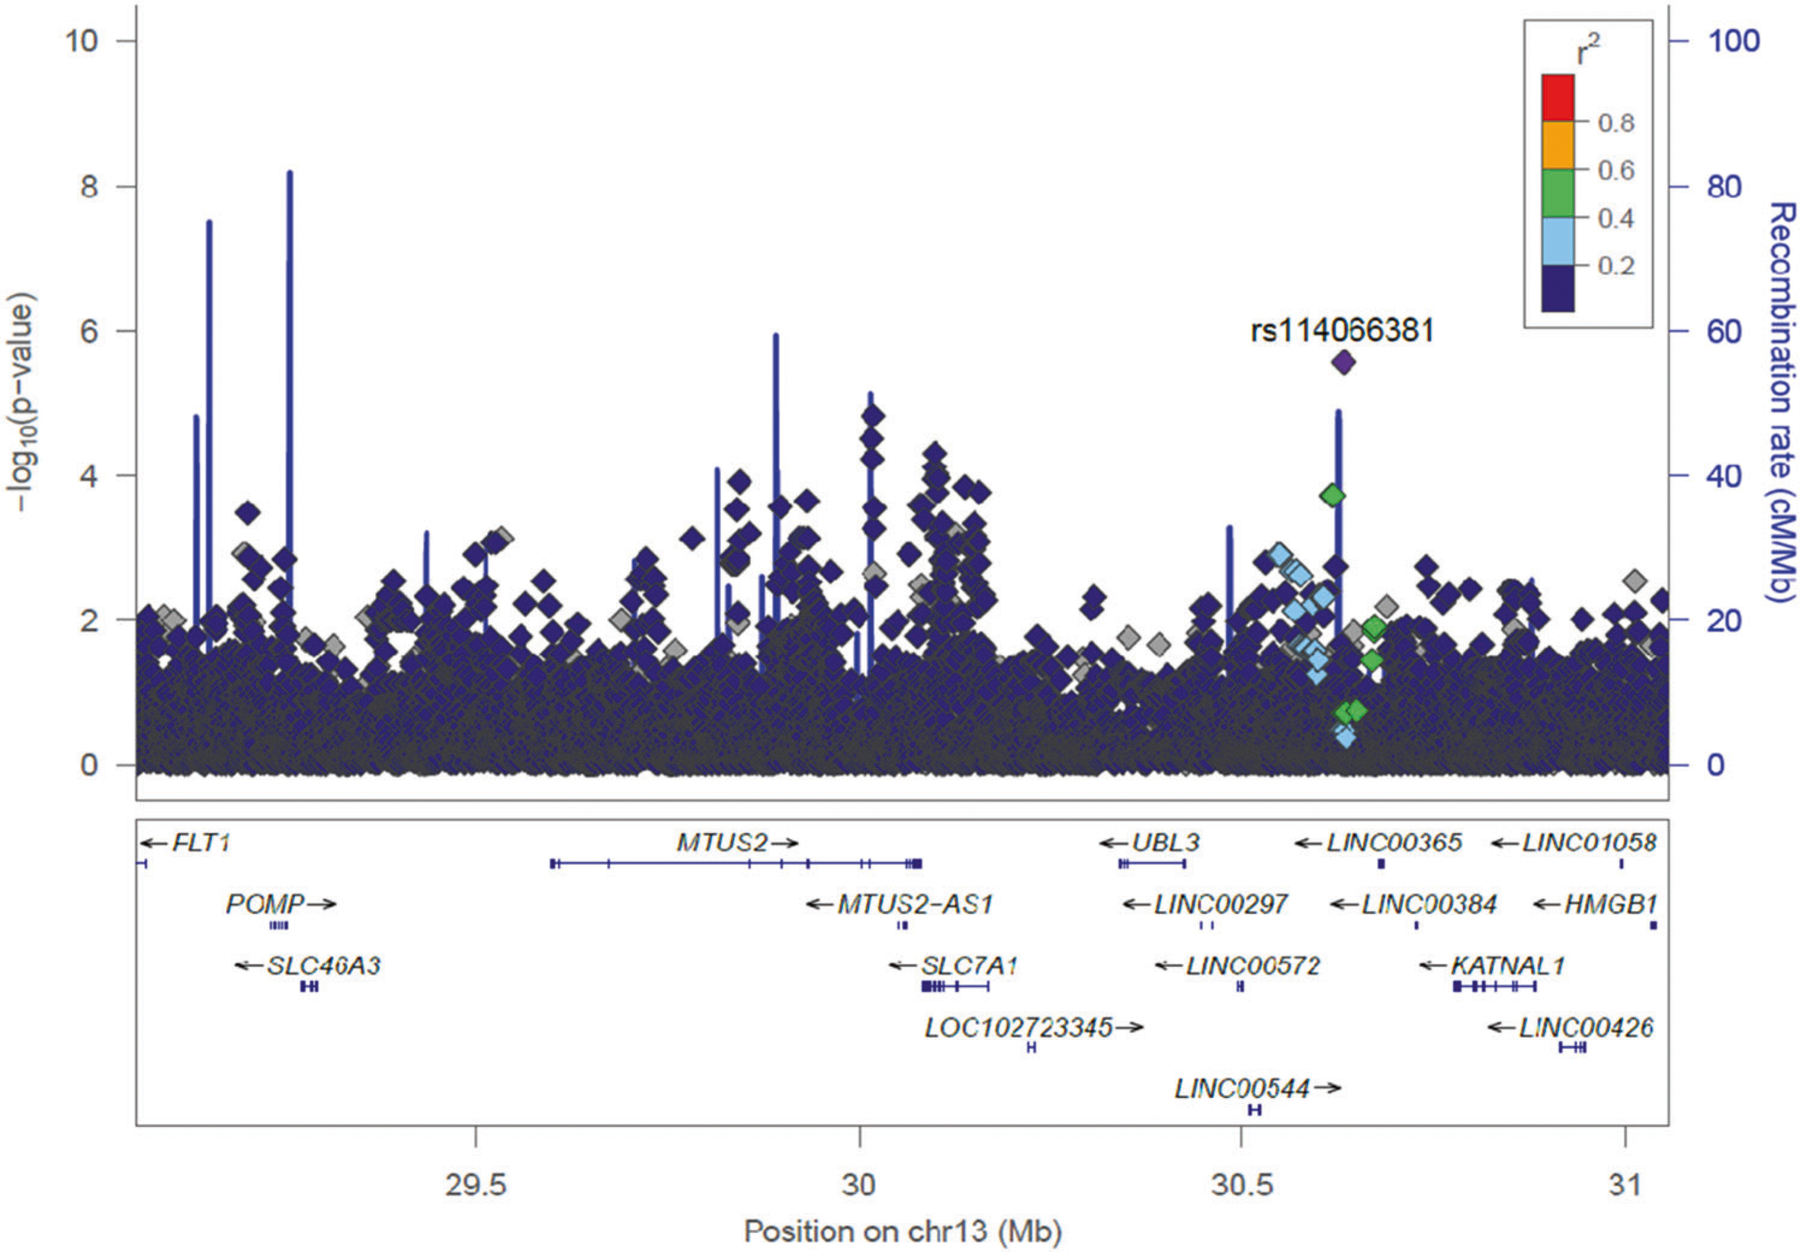
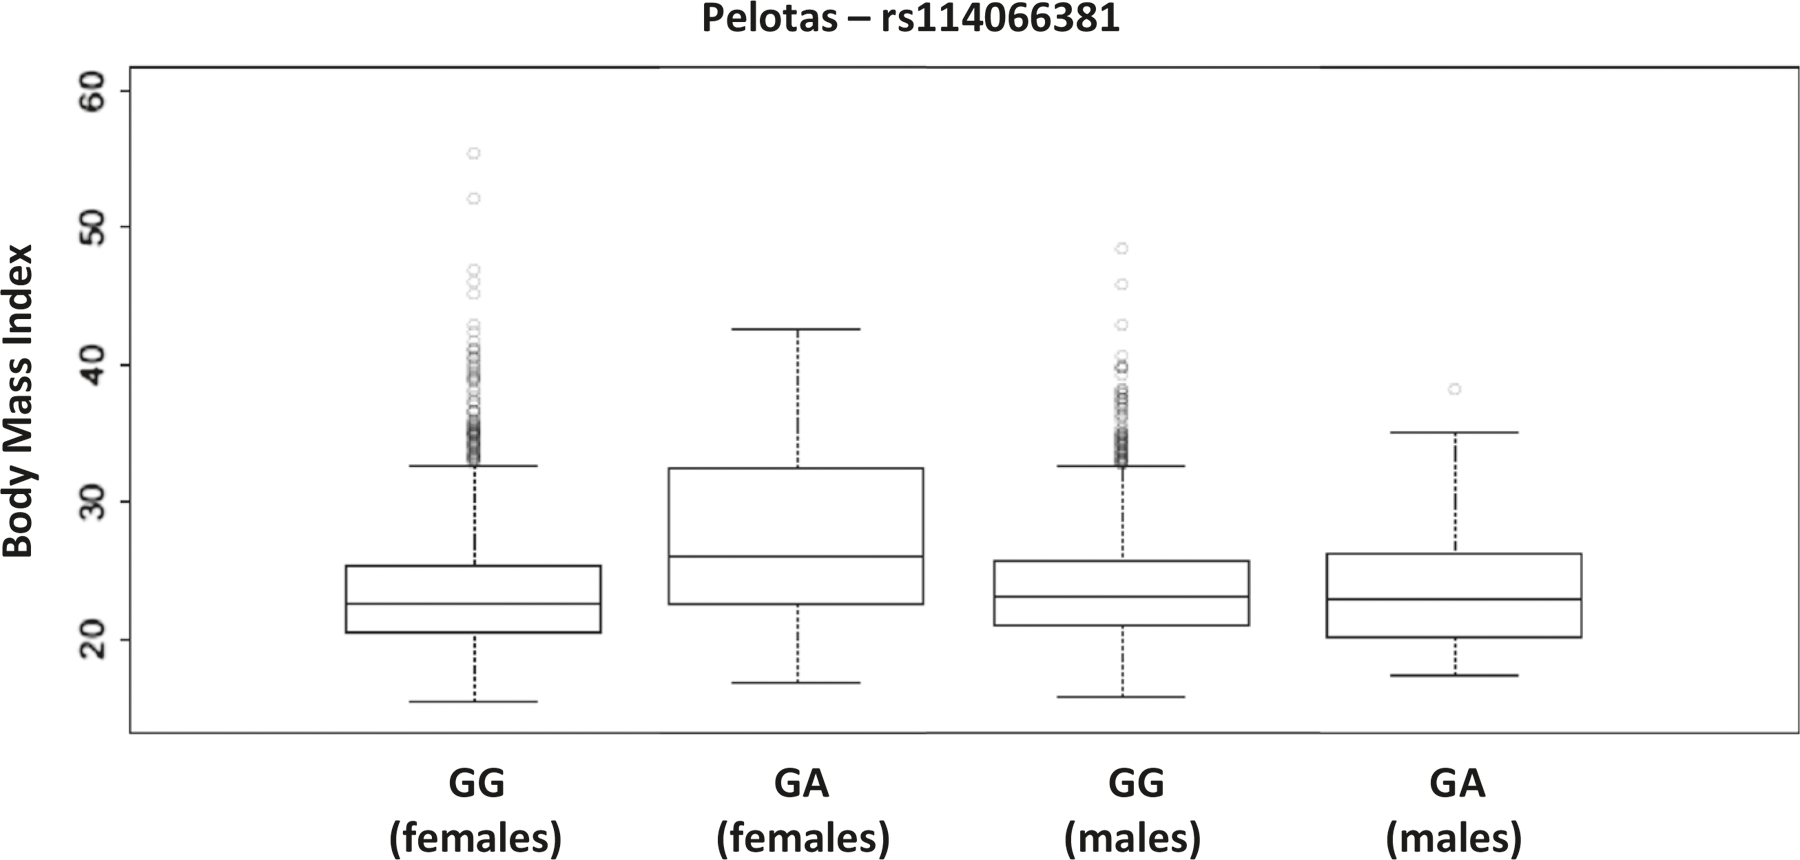
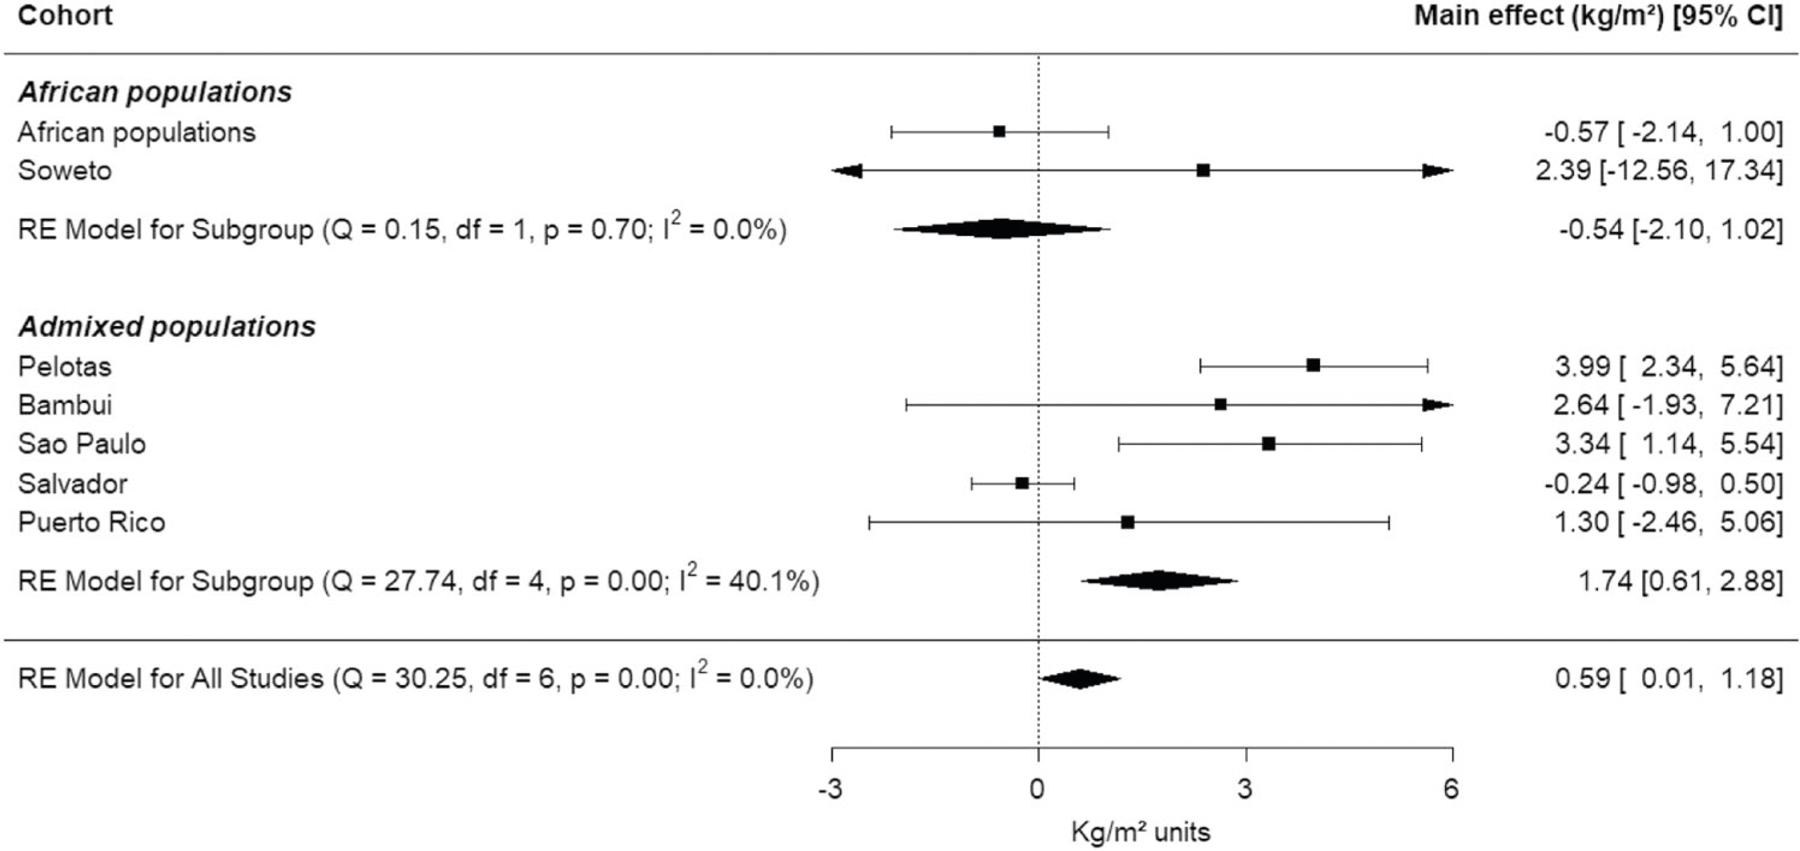
Results: We found significant associations with African-associated alleles in children from Salvador (PALD1 and ZMIZ1 genes), and in young adults from Pelotas (NOD2 and MTUS2 genes). More importantly, in Pelotas, rs114066381, mapped in a potential regulatory region, is significantly associated only in females (p = 2.76e-06). This variant is rare in Europeans but with frequencies of ~3% in West Africa and has a strong female-specific effect (95% CI: 2.32-5.65 kg/m2 per each A allele). We confirmed this sex-specific association and replicated its strong effect for an adjusted fat mass index in the same Pelotas cohort, and for BMI in another Brazilian cohort from São Paulo (Southeast Brazil). A meta-analysis confirmed the significant association. Remarkably, we observed that while the frequency of rs114066381-A allele ranges from 0.8 to 2.1% in the studied populations, it attains ~9% among women with morbid obesity from Pelotas, São Paulo, and Bambuí. The effect size of rs114066381 is at least five times higher than the FTO SNPs rs9939609 and rs1558902, already emblematic for their high effects.

Conclusions: We identified six candidate SNPs associated with BMI. rs114066381 stands out for its high effect that was replicated and its high frequency in women with morbid obesity. We demonstrate how admixed populations are a source of new relevant phenotype-associated genetic variants.


Conflict of interest statement

Compliance with ethical standards

Conflict of interest The authors declare that they have no conflict of interest.

Figures

Fig. 1
Fig. 1. Admixture in the Brazilian cohorts, BMI distributions, and admixture mapping (AM) Manhattan plots with significant peaks.
A, B Manhattan plots showing AM peaks using linear regressions with PCAdmix local ancestry inferences. Consensus significant AM peaks for PCAdmix and RFMix local ancestry inferences are specified on each plot. A Manhattan Plot showing the AM results of African (left) and European (right) ancestry in Salvador cohort. African ancestry AM shows two positive significant peaks 10q22.1 (β = 0.36, p value = 3.21e−05) and 10q22.3 (β = 0.36, p value = 7.87e−05). European AM ancestry analysis shows one negative associated peak 10q22.3 (β = −0.36, p value = 2.92e−05). B Manhattan plot showing the AM results of African (left) and European (right) ancestry in the Pelotas cohort. One peak in 16q12.1 (β = −0.80, p value = 4.30e−06) was observed associated with African ancestry, and two associated peaks, 13q12.3 (β = −0.95, p value = 1.84e−05) and 20p12.1–2 (β = −1.05, p value = 1.79–06), with European ancestry in females. Results are presented as log10(p value) to the given ancestry of each window of 100 SNPs along the genome. Black line in the Manhattan plots correspond to the genome-wide threshold p value estimated for the given ancestry and dataset (Table S5). The linear regression coefficient (β) and p values for all peaks correspond to the lead window, the genomic window with the most significant p value in the linear regression result. C Brazilian regions and continental individual ancestry bar plots for each cohort. D Histogram of Z-score adjusted by sex and age according to WHO guidelines in Salvador (top), histogram of BMI in Bambui (center) and Pelotas (bottom) cohorts.
Fig. 2
Fig. 2. LocusZoom plot of the fine-mapping of consensus significant admixture mapping peak in young adults from Pelotas at 13q12.3 associated with European ancestry in females performed using both genotyped and imputed SNPs ±1 Mb from target region (lead windows).
The SNP with the lowest p value is color coded in purple and labeled. The linkage disequilibrium between this SNP and the remaining nearby SNPs is indicated by the color coding according to r2 values based on Africans from 1000 Genomes Project (Color figure online).
Fig. 3
Fig. 3. Body mass index (BMI) in females and males’ adults from Pelotas cohort, according to their genotypes in the SNP rs114066381.
The increase of BMI associated with the rs114066381-A is observed in females (p value = 0.0008), but not in males (p value = 0.5397).
Fig. 4
Fig. 4. Forest plots from the meta-analysis synthesizing association results between rs114066381 and BMI from seven populations.
Effect size [95% confidence interval (CI)] in each individual study, subgroups of African populations and admixed populations, and combining all populations.

References

    1. WHO. Global status report on noncommunicable diseases 2010 2011. https://www.who.int/nmh/publications/ncd_report2010/en/.
    1. Schmidt MI, Duncan BB, e Silva GA, Menezes AM, Monteiro CA, Barreto SM. et al. Chronic non-communicable diseases in Brazil: burden and current challenges. Lancet 2011;377:1949–61. http://linkinghub.elsevier.com/retrieve/pii/S0140673611601359. - PubMed
    1. Locke AE, Kahali B, Berndt SI, Justice AE, Pers TH, Day FR. et al. Genetic studies of body mass index yield new insights for obesity biology. Nature 2015;518:197–206. 10.1038/nature14177. - DOI - PMC - PubMed
    1. Rask-Andersen M, Karlsson T, Ek WE, Johansson A. Gene-environment interaction study for BMI reveals interactions between genetic factors and physical activity, alcohol consumption and socioeconomic status. PLoS Gene 2017;13:e1006977. 10.1371/journal.pgen.1006977. - DOI - PMC - PubMed
    1. Robinson MR, English G, Moser G, Lloyd-Jones LR, Triplett MA, Zhu Z. et al. Genotype–covariate interaction effects and the heritability of adult body mass index. Nat Genet 2017;49:1174–81. 10.1038/ng.3912. - DOI - PubMed

Publication types

LinkOut - more resources