. 2021 Mar;53(3):403-411.
doi: 10.1038/s41588-021-00790-6. Epub 2021 Feb 25.

ArchR is a scalable software package for integrative single-cell chromatin accessibility analysis

Affiliations

ArchR is a scalable software package for integrative single-cell chromatin accessibility analysis

Jeffrey M Granja et al. Nat Genet. 2021 Mar.

Erratum in

Abstract

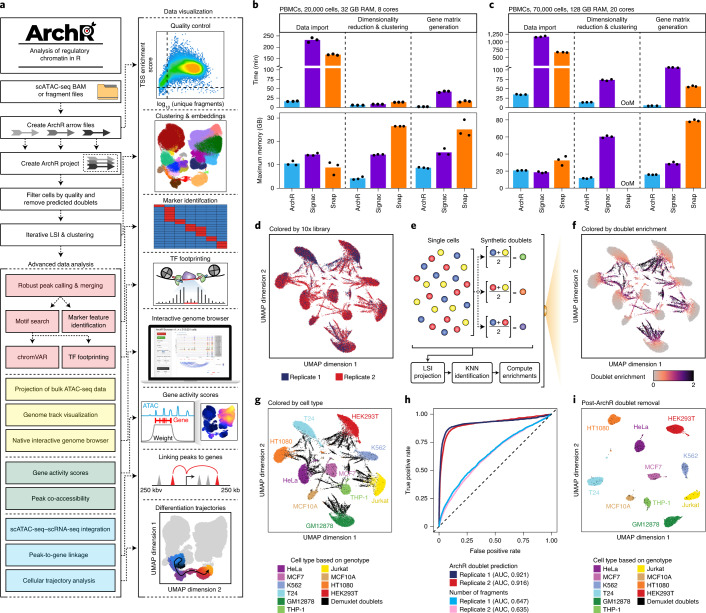
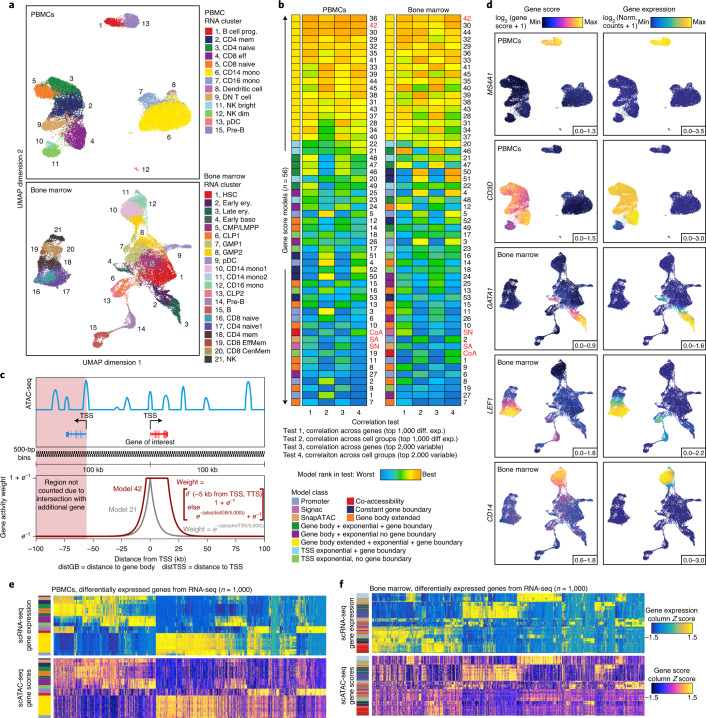
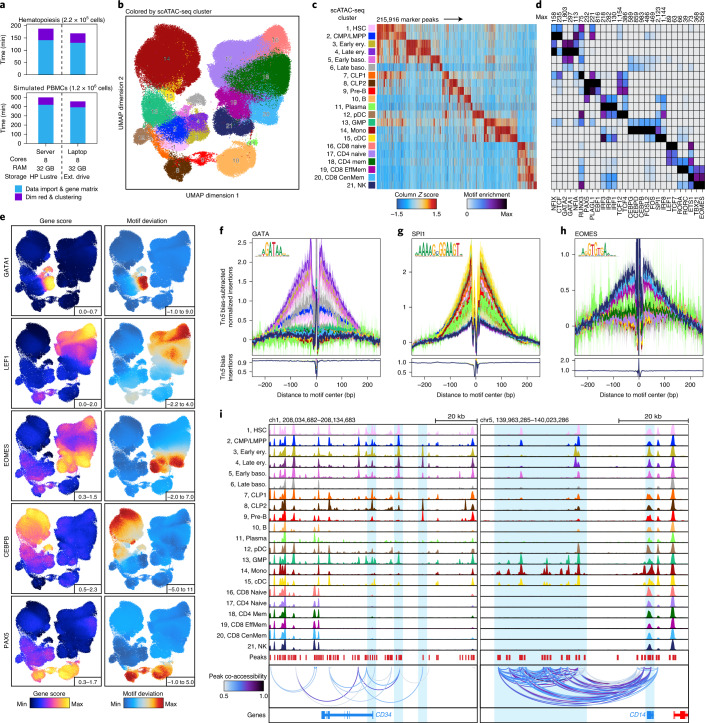
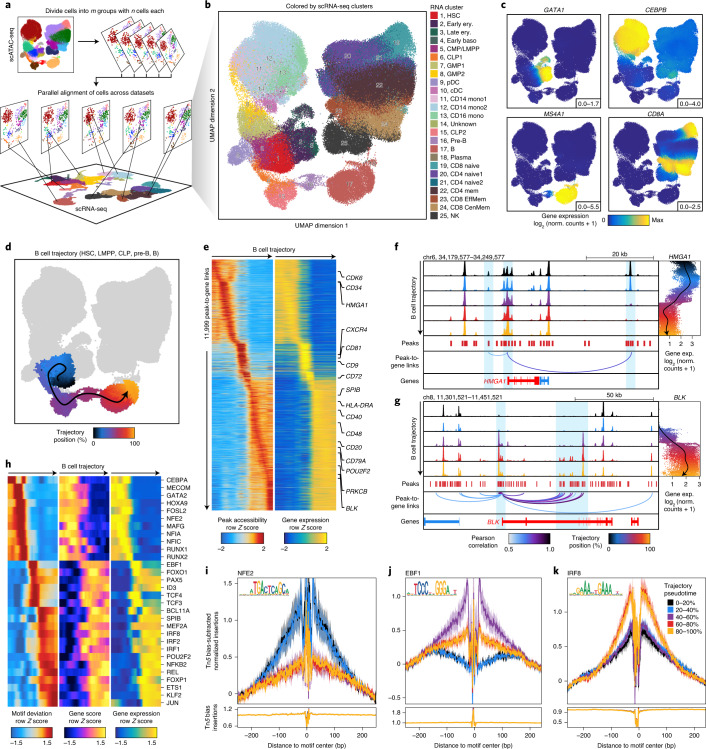
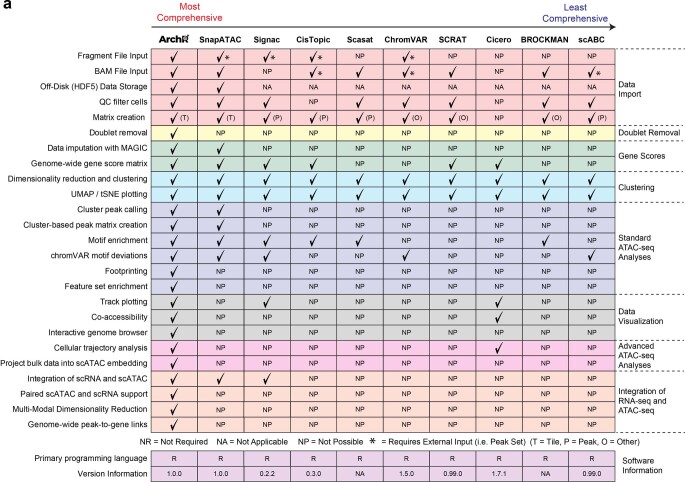
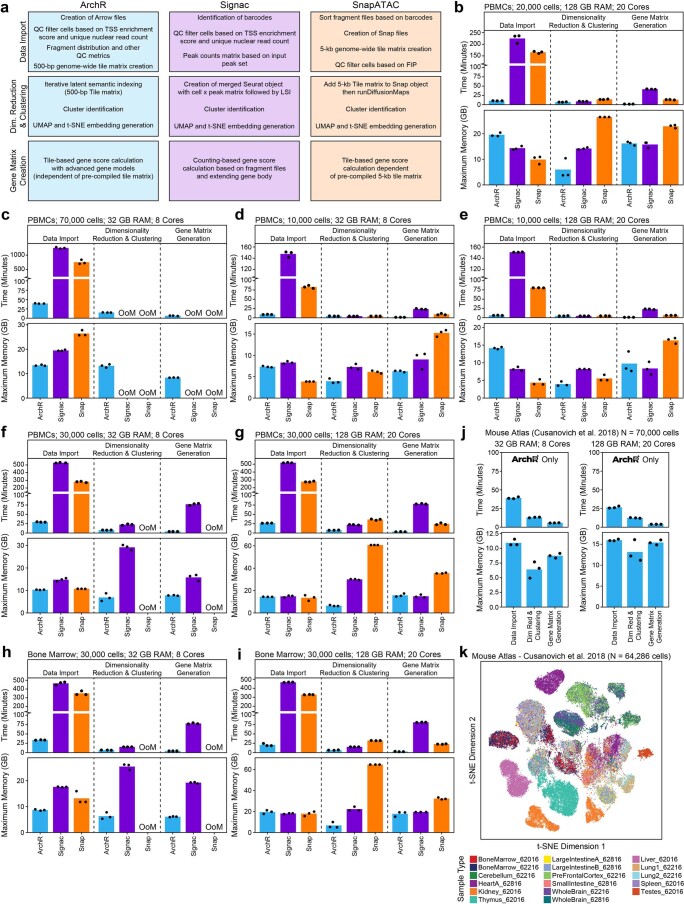
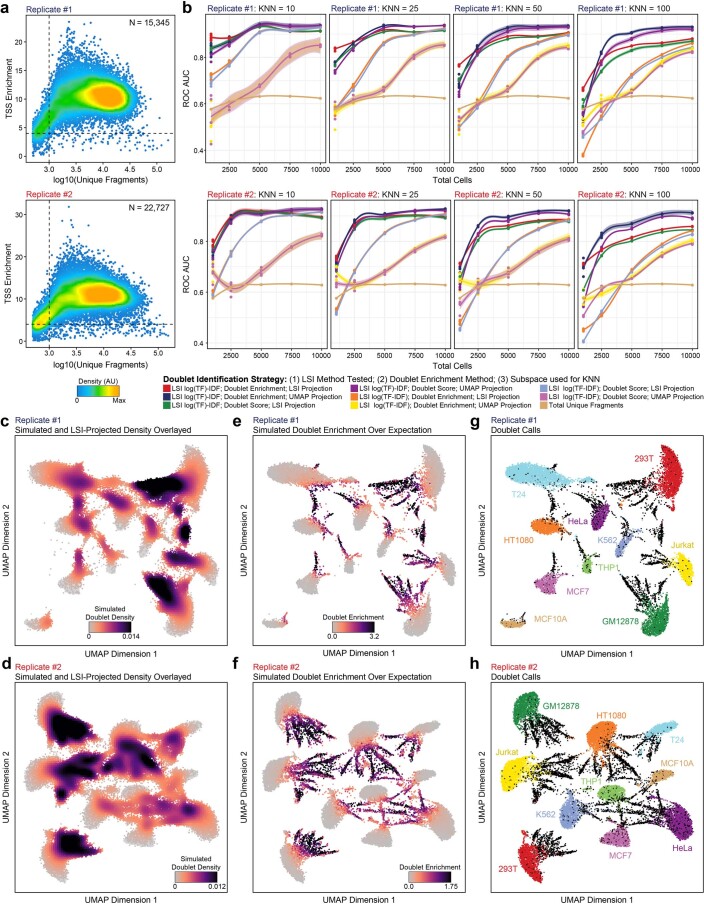
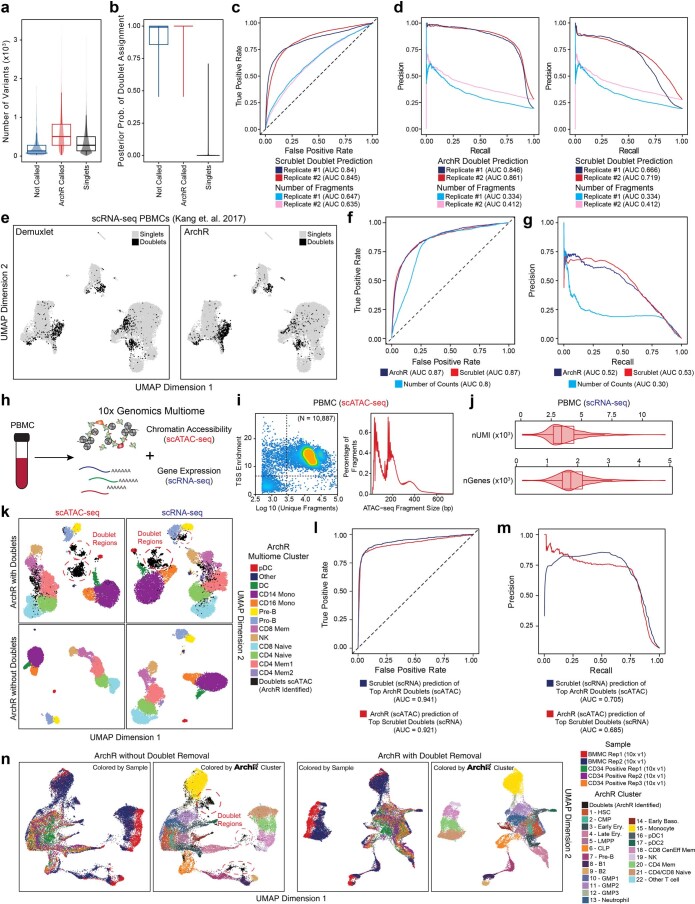
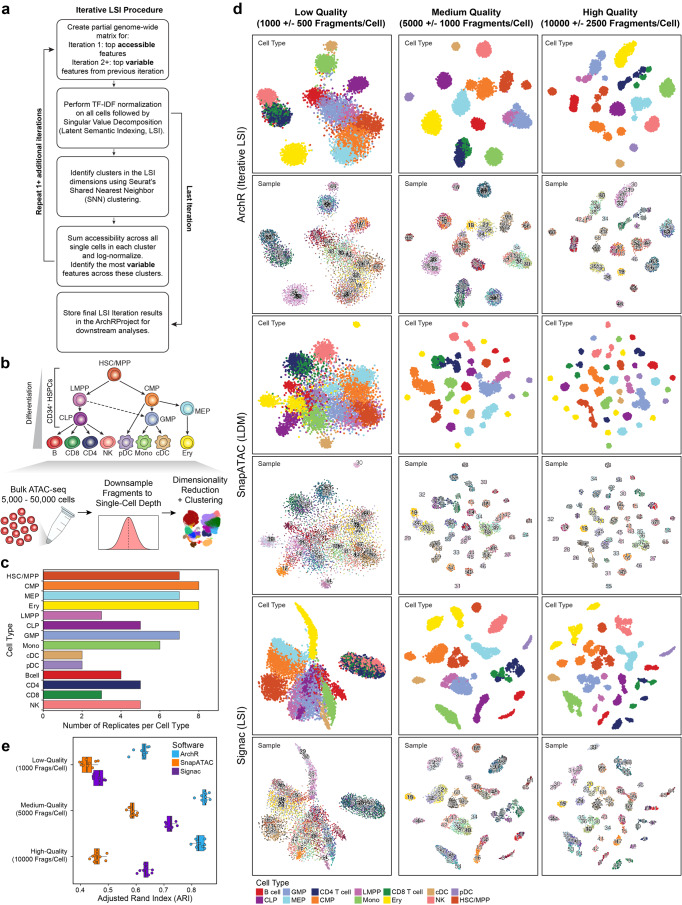
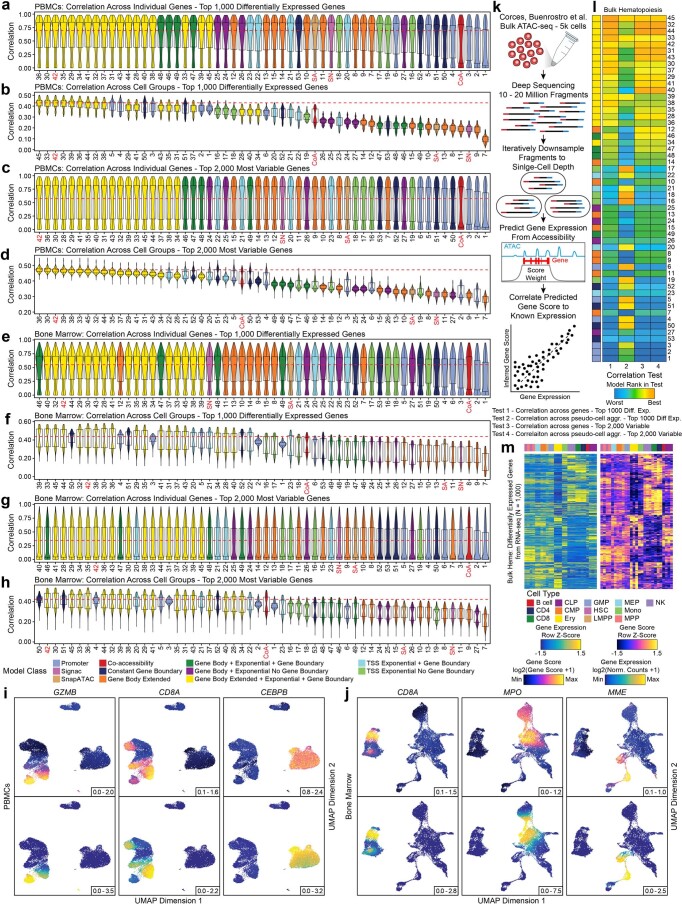
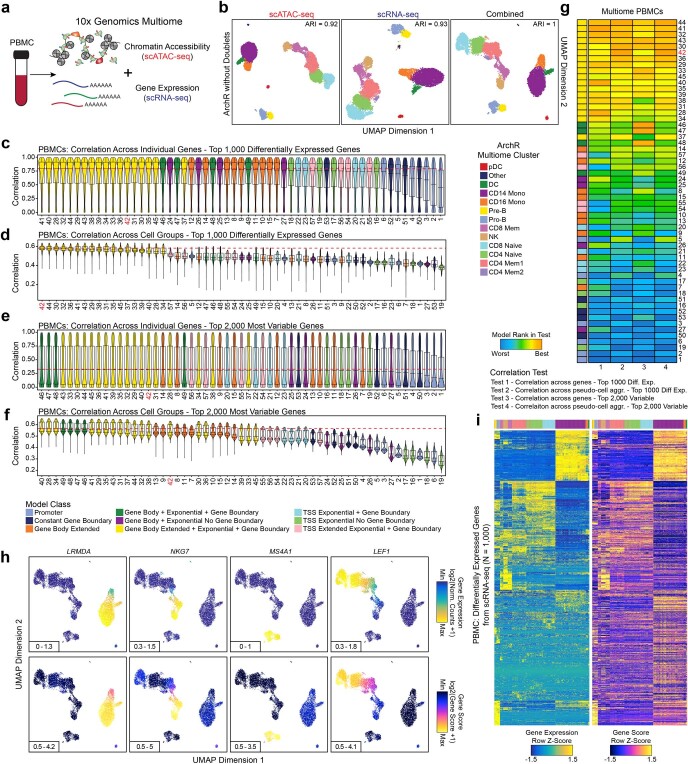
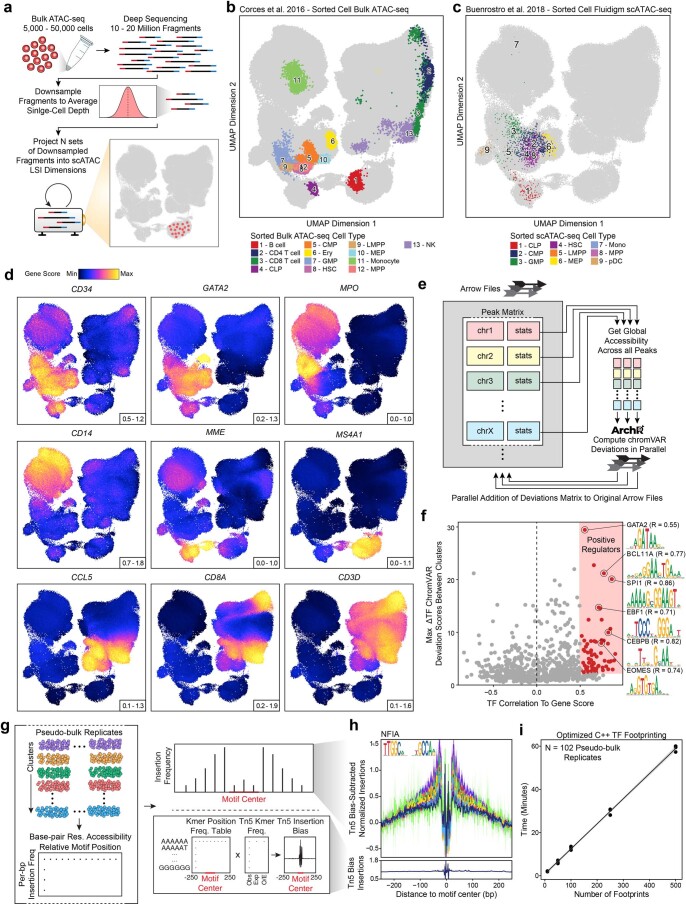
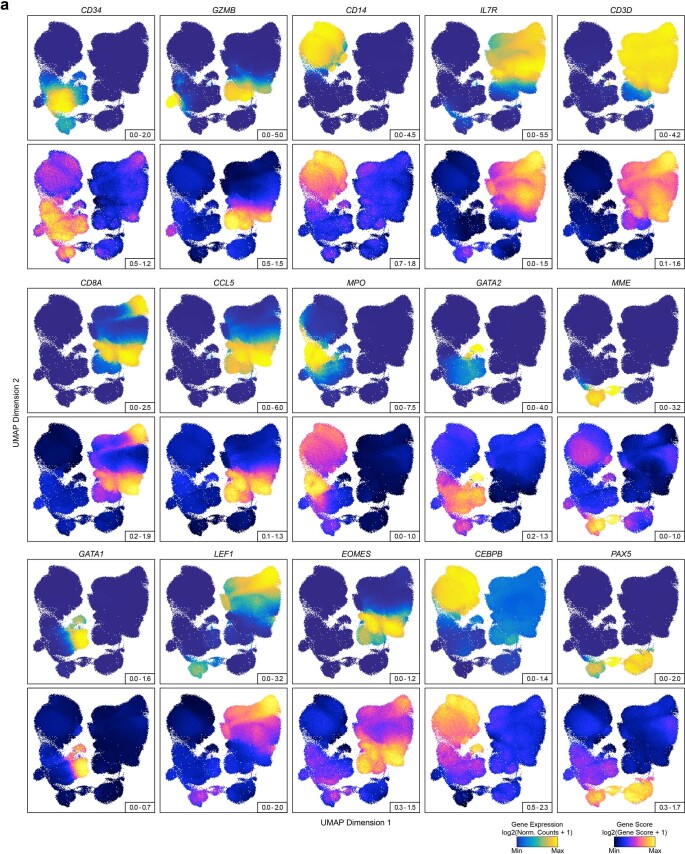
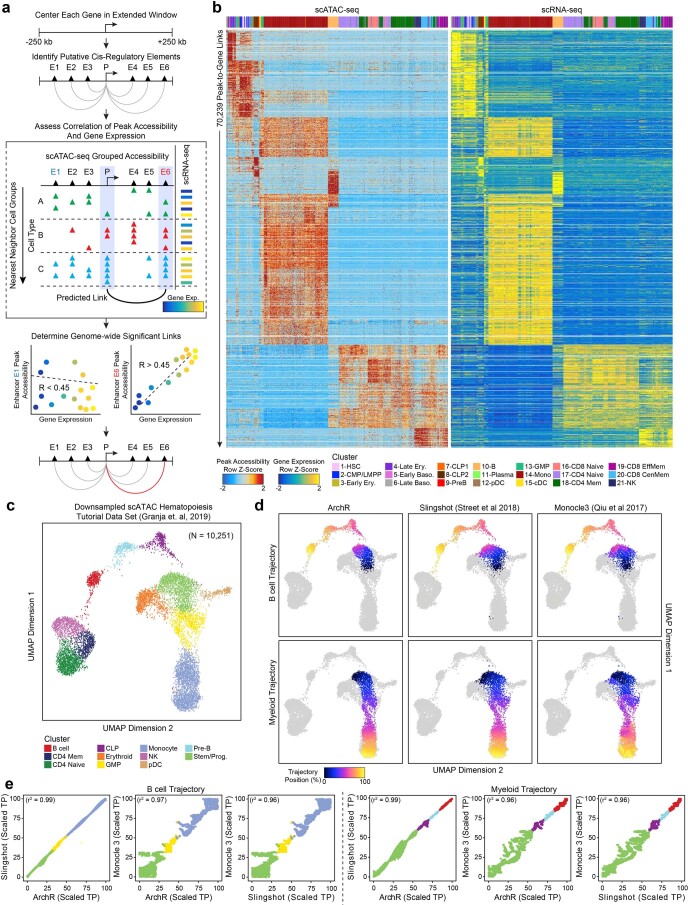
The advent of single-cell chromatin accessibility profiling has accelerated the ability to map gene regulatory landscapes but has outpaced the development of scalable software to rapidly extract biological meaning from these data. Here we present a software suite for single-cell analysis of regulatory chromatin in R (ArchR; https://www.archrproject.com/ ) that enables fast and comprehensive analysis of single-cell chromatin accessibility data. ArchR provides an intuitive, user-focused interface for complex single-cell analyses, including doublet removal, single-cell clustering and cell type identification, unified peak set generation, cellular trajectory identification, DNA element-to-gene linkage, transcription factor footprinting, mRNA expression level prediction from chromatin accessibility and multi-omic integration with single-cell RNA sequencing (scRNA-seq). Enabling the analysis of over 1.2 million single cells within 8 h on a standard Unix laptop, ArchR is a comprehensive software suite for end-to-end analysis of single-cell chromatin accessibility that will accelerate the understanding of gene regulation at the resolution of individual cells.


Conflict of interest statement

W.J.G. and H.Y.C. are consultants for 10x Genomics, which has licensed IP associated with ATAC-seq. W.J.G. has additional affiliations with Guardant Health (consultant) and Protillion Biosciences (cofounder and consultant). H.Y.C. is a cofounder of Accent Therapeutics and Boundless Bio and is a consultant for Arsenal Biosciences and Spring Discovery.

Figures

Fig. 1
Fig. 1. ArchR, a rapid, extensible and comprehensive scATAC-seq analysis platform.
a, Schematic of the ArchR workflow from pre-aligned scATAC-seq data as BAM or fragment files to diverse data analysis. b,c, Comparison of runtime and memory usage by ArchR, Signac and SnapATAC (Snap) for the analysis of ~20,000 PBMCs using 32 GB of RAM and eight cores (b) or ~70,000 PBMCs using 128 GB of RAM and 20 cores (c). Dots represent replicates of benchmarking analysis (n = 3). OoM corresponds to out of memory. d, Initial UMAP embedding of scATAC-seq data from two replicates of the cell line-mixing experiment (n = 38,072 total cells from ten different cell lines), colored by replicate number. e, Schematic of doublet identification with ArchR. KNN, k-nearest neighbors. f,g, Initial UMAP embedding of scATAC-seq data from two replicates of the cell line-mixing experiment (n = 38,072 total cells from ten different cell lines), colored by the enrichment of projected synthetic doublets (f) or the demuxlet identification labels based on genotype identification using single-nucleotide polymorphisms (SNPs) within accessible chromatin sites (g). h, ROC curves of doublet prediction using ArchR doublet identification or the number of fragments per cell compared to demuxlet as a ground truth. The AUCs for these ROC curves are annotated below. i, UMAP after ArchR doublet removal of scATAC-seq data from two replicates of the cell line-mixing experiment (n = 27,220 doublet-filtered cells from ten different cell lines), colored by demuxlet identification labels based on genotype identification using SNPs within accessible chromatin sites.
Fig. 2
Fig. 2. Optimized gene score inference models improve prediction of gene expression from scATAC-seq data.
a, UMAPs of scATAC-seq from PBMCs (top) and bone marrow cells (bottom), colored by aligned scRNA-seq clusters. This alignment was used for benchmarking of scATAC-seq gene score models. A list of abbreviations used in this figure appear in the Methods. b, Heatmaps summarizing the accuracy (measured by Pearson correlation) across 56 gene score models for both the top 1,000 differentially expressed (diff. exp.) and the top 2,000 variable genes for both PBMC and bone marrow cell datasets. Each heatmap entry is colored by the model rank in the given correlation test as described below the heatmap. The model class is indicated to the left of each heatmap by color. SA, SnapATAC; SN, Signac; CoA, co-accessibility. c, Illustration of the gene score model 42, which uses bi-directional exponential decays from the gene TSS (extended upstream by 5 kb) and the gene transcription termination site (TTS) while accounting for neighboring gene boundaries. This model was shown to be more accurate than other models, such as model 21 (exponential decay). d, Side-by-side UMAPs for PBMCs and bone marrow cells colored by gene scores from model 42 (left) and gene expression from the scRNA-seq alignment for key immune cell-related marker genes (right). Norm., normalized. e,f, Heatmaps of gene expression (top) or gene scores for the top 1,000 differentially expressed genes (bottom) (selected from scRNA-seq) across all cell aggregates for PBMCs (e) or bone marrow cells (f). Color bars to the left of each heatmap represent the PBMC or bone marrow cell cluster derived from scRNA-seq data.
Fig. 3
Fig. 3. ArchR enables comprehensive analysis of massive-scale scATAC-seq data.
a, Runtimes for ArchR-based analysis of over 220,000 and 1,200,000 single cells, respectively, using a small-cluster-based computational environment (32 GB of RAM and eight cores with HP Lustre storage) and a personal MacBook Pro laptop (32 GB of RAM and eight cores with an external (ext.) USB hard drive). Color indicates the relevant analytical step. b, UMAP of the hematopoiesis dataset colored by the 21 hematopoietic clusters. UMAP was constructed using LSI estimation with 25,000 landmark cells. c, Heatmap of 215,916 ATAC-seq marker peaks across all hematopoietic clusters identified with bias-matched differential testing. Color indicates the column Z score of normalized accessibility. d, Heatmap of motif hypergeometric enrichment-adjusted P values within the marker peaks of each hematopoietic cluster. Color indicates the motif enrichment (−log10 (P value)) based on the hypergeometric test. e, Side-by-side UMAPs of gene scores (left) and motif deviation scores for ArchR-identified TFs (right), for which the inferred gene expression is positively correlated with the chromVAR TF deviation across hematopoiesis. fh, Tn5 bias-adjusted TF footprints for GATA, proto-oncogene SPI1 and EOMES motifs, representing positive TF regulators of hematopoiesis. Lines are colored by the 21 clusters shown in c. i, Genome accessibility track visualization of marker genes with peak co-accessibility. Left, CD34 genome track (chromosome (chr)1, 208,034,682–208,134,683) showing greater accessibility in earlier hematopoietic clusters (1–5, 7–8 and 12–13). Right, CD14 genome track (chr5, 139,963,285–140,023,286) showing greater accessibility in earlier monocytic clusters (13–15).
Fig. 4
Fig. 4. Integration of scATAC-seq and scRNA-seq data by ArchR identifies gene regulatory trajectories of hematopoietic differentiation.
a, Schematic of scATAC-seq alignment with scRNA-seq data in m slices of n single cells. These slices are independently aligned to a reference scRNA-seq dataset and then the results are combined for downstream analysis. This integrative design facilitates rapid large-scale integration with low memory requirements. bd, UMAPs of scATAC-seq data from the hematopoiesis dataset colored by alignment to previously published hematopoietic scRNA-seq-derived clusters (b), integrated scRNA-seq gene expression for key marker TFs and genes (c) or cell alignment to the ArchR-defined B cell trajectory (d). In d, the smoothed arrow represents a visualization of the interpreted trajectory (determined in the LSI subspace) in the UMAP embedding. e, Heatmap of 11,999 peak-to-gene links identified across the B cell trajectory with ArchR. f,g, Genome track visualization of the HMGA1 locus (chr6, 34,179,577–34,249,577) (f) and the BLK locus (chr8, 11,301,521–11,451,521) (g). Single-cell gene expression (exp.) across pseudotime in the B cell trajectory is shown to the right. Inferred peak-to-gene links for distal regulatory elements across the hematopoiesis dataset are shown below. h, Heatmap of positive TF regulators for which gene expression is positively correlated with chromVAR TF deviation across the B cell trajectory. ik, Tn5 bias-adjusted TF footprints for nuclear factor, erythroid (NFE)2 (i), early B cell factor (EBF)1 (j) and interferon regulatory factor (IRF)8 (k) motifs, representing positive TF regulators across the B cell trajectory. Lines are colored by the position in pseudotime of B cell differentiation.
Extended Data Fig. 1
Extended Data Fig. 1. Comparison of supported features from currently available scATAC-seq software.
a, Comparison of comprehensiveness of supported scATAC-seq features across ArchR and other existing software packages.
Extended Data Fig. 2
Extended Data Fig. 2. Benchmarking comparisons of runtime and memory usage for ArchR, Signac, and SnapATAC.
a, Schematic describing the individual benchmarking steps compared across ArchR (blue), Signac (purple), and SnapATAC (orange) for (1) Data Import, (2) Dimensionality Reduction and Clustering, and (3) Gene Score Matrix Creation. b-i, Comparison of ArchR, Signac, and SnapATAC for run time and peak memory usage for the analysis of (b) ~20,000 cells from the PBMCs dataset using 128 GB of RAM and 20 cores (plot corresponds to Fig. 1b), (c) ~70,000 cells from the PBMCs dataset using 32 GB of RAM and 8 cores (plot corresponds to Fig. 1c), (d-e) ~10,000 cells from the PBMCs dataset using (d) 32 GB of RAM and 8 cores or (e) 128 GB of RAM and 20 cores, (f-g) ~30,000 cells from the PBMCs dataset using (f) 32 GB of RAM and 8 cores or (g) 128 GB of RAM and 20 cores, and (h-i) ~30,000 cells from the bone marrow dataset using (h) 32 GB of RAM and 8 cores or (i) 128 GB of RAM and 20 cores. Dots represent individual replicates of benchmarking analysis (N = 3). OoM corresponds to out of memory. j, Benchmarks from ArchR for run time and peak memory usage for the analysis of ~70,000 cells from the sci-ATAC-seq mouse atlas dataset (N = 13 tissues) for (left) 32 GB of RAM with 8 cores and (right) 128 GB of RAM with 20 cores. Dots represent individual replicates of benchmarking analysis. k, t-SNE of mouse atlas scATAC-seq data (N = 64,286 cells) colored by individual samples.
Extended Data Fig. 3
Extended Data Fig. 3. Optimization of doublet identification using admixtures of cell lines.
a, QC filtering plots from ArchR for (top) replicate 1 and (bottom) replicate 2 from the cell line mixing dataset showing the TSS enrichment score vs unique nuclear fragments per cell. Dot color represents the density in arbitrary units of points in the plot. b, Accuracy of various doublet prediction methods for (top) replicate 1 and (bottom) replicate 2 from the cell line mixing dataset, measured by the area under the curve (AUC) of the receiver operating characteristic (ROC), across different in silico cell loadings. Accuracy is determined with respect to genotype-based identification of doublets using demuxlet. Above each plot, ‘KNN’ represents the number of cells nearby each projected synthetic doublet to record when calculating doublet enrichment scores. The distance for KNN recording is determined in the LSI subspace for LSI projection and in the UMAP embedding for UMAP projection parameters. The smooth line represents a LOESS fit (shading represents 95% confidence interval). c-h, UMAP of scATAC-seq data showing the (c-d) simulated doublet density, (e-f) simulated doublet enrichment, or (g-h) cell line identity based on genotyping information and demuxlet for (c,e,g) replicate 1 (N = 15,345 cells) and (d,f,h) replicate 2 (N = 22,727 cells) of the cell line mixing dataset.
Extended Data Fig. 4
Extended Data Fig. 4. Benchmarking of doublet identification in ArchR.
a, Total number of sample-relevant single-nucleotide variants that overlapped scATAC-seq fragments for (blue) cells identified as doublets by demuxlet and not identified by ArchR, (red) cells identified as doublets by both demuxlet and ArchR, and (black) cells identified as singlets by demuxlet. Box-whisker plot; lower whisker is the lowest value greater than the 25% quantile minus 1.5 times the interquartile range (IQR), the lower hinge is the 25% quantile, the middle is the median, the upper hinge is the 75% quantile and the upper whisker is the largest value less than the 75% quantile plus 1.5 times the IQR. b, Posterior probability of demuxlet doublet assignment. Coloration and box-whisker plot as in (a). c, Receiver operating characteristic (ROC) curves of doublet prediction using Scrublet or the number of nuclear fragments per cell compared to demuxlet as a ground truth. The area under the curve (AUC) for these ROC curves is annotated below the plot. The Scrublet ROC curve can be directly compared to ArchR in Fig. 1h. d, Precision recall (PR) curves of doublet prediction using (left) ArchR and (right) Scrublet doublet identification or the number of nuclear fragments per cell compared to demuxlet as a ground truth. The AUC is annotated below the plot. e, UMAP of PBMC mixing scRNA-seq from Kang et. al, 2017. Cells are colored as doublets (black) or singlets (gray) as identified by (left) demuxlet or (right) ArchR. f-g. (f) ROC curves or (g) PR curves of doublet prediction using ArchR (dark blue), Scrublet (red), or the number of total counts per cell (light blue) compared to demuxlet as a ground truth. The AUC is annotated below the plot. h, Schematic of 10x Genomics Multiome workflow. i, (left) TSS enrichment score vs unique nuclear fragments per cell (color is density), or (right) aggregate fragment size distributions for the cells passing ArchR QC thresholds from the PBMC Multiome data. j, Distribution of (top) the number of unique molecular identifiers (nUMIs) per cell passing scATAC-seq filtration and (bottom) the number of unique genes (nGenes) identified with at least 1 UMI per cell. Box-whisker plot as in (a). k, UMAPs of (left) scATAC-seq data or (right) scRNA-seq data from the Multiome dataset shown (top) with doublets present (black, N = 10,887) and (bottom) with ArchR-identified doublets removed (N = 9,702). l-m, (l) ROC and (m) PR curves of doublet prediction using ArchR (red) compared to the top doublets (N = 750) identified by Scrublet as a ground truth and vice versa (blue). The AUC is annotated below the plot. n, UMAP of scATAC-seq data from CD34 + bone marrow cells (green, purple, orange) and unfractionated bone marrow cells (blue and red) colored by (left) sample and (right) ArchR identified clusters (N ~ 30,000 cells total). Plots are shown (left pair) without doublet removal and (right pair) with ArchR-based doublet removal.
Extended Data Fig. 5
Extended Data Fig. 5. Benchmarking of performance of clustering approaches in ArchR, SnapATAC, and Signac.
a, Schematic of the iterative LSI procedure implemented in ArchR for dimensionality reduction. b, Schematic of the downsampling approach used on bulk ATAC-seq data to enable evaluation of clustering performance for simulated scATAC-seq data. c, Bar plot showing the number of replicates generated per cell type by downsampling of bulk ATAC-seq data from hematopoietic cells. d, t-distributed stochastic neighbor embedding (t-SNE) of downsampled bulk ATAC-seq data from hematopoeitc cells (N = 7,200) to various data quality scales. Left; low-quality scATAC-seq data (~1,000 fragments/cell). Middle; medium-quality scATAC-seq data (~5,000 fragments/cell). Right; high-quality scATAC-seq data (~10,000 fragments/cell). t-SNE plots were created for (top) ArchR (iterative LSI), (middle) SnapATAC (LDM), and (bottom) Signac (LSI). Within each group, these t-SNE plots are colored by (top) cell type and (bottom) sample replicate. e, Adjusted Rand Index (ARI) of clusters identified by ArchR (blue), SnapATAC (orange), and Signac (purple) for low-quality, medium-quality and high-quality downsampling of bulk ATAC-seq data from hematopoietic cells.
Extended Data Fig. 6
Extended Data Fig. 6. Assessment of gene score models.
a-h, Distribution of Pearson correlations of inferred gene score and aligned gene expression for (a,c,e,g) each gene or (b,d,f,h) each cell group across groups of 100 cells (N = 500 groups). Distributions are either presented for (a,b,e,f) the top 1,000 differentially expressed genes or (c,d,g,h) the top 2,000 most variable genes for each of the 56 gene score models. The red dotted line represents the median value of the best-performing model. Violin plots represent the smoothed density of the distribution of the data. In box plots, the lower whisker is the lowest value greater than the 25% quantile minus 1.5 times the interquartile range, the lower hinge is the 25% quantile, the middle is the median, the upper hinge is the 75% quantile and the upper whisker is the largest value less than the 75% quantile plus 1.5 times the interquartile range. SA, SnapATAC; SN, Signac; CoA, Co-accessibility. i-j, UMAPs of scATAC-seq data from (i) cells from the PBMCs dataset (N = 27,845 cells) or (j) cells from the bone marrow cell dataset (N = 26,748 cells) colored by (top) inferred gene scores or (bottom) gene expression for several marker genes. k, Schematic illustrating the methodology used to assess the accuracy of inferred gene scores. l, Heatmaps summarizing the accuracy (Pearson correlation) across all models for both the top 1,000 differentially expressed and top 2,000 variable genes for bulk ATAC-seq and RNA-seq from hematopoietic cell types. Each entry is colored by the model rank in the given test as described below the heatmap. The model class is indicated to the left. SA, SnapATAC; SN, Signac; CoA, Co-accessibility. m, Heatmaps of (left) gene expression or (right) gene scores for the top 1,000 differentially expressed genes (selected from bulk RNA-seq) across all cell types from the matched bulk ATAC-seq and RNA-seq data.
Extended Data Fig. 7
Extended Data Fig. 7. Confirmation of gene score model performance using paired scATAC-seq and scRNA-seq data from the same single cells.
a, Schematic of 10x Genomics Multiome profiling of scATAC-seq and scRNA-seq in the same single cells. b, UMAPs of Multiome data from PBMCs (N = 9,702 cells) with removal of ArchR-identified doublets using (left) iterative LSI of scATAC-seq data, (middle) iterative LSI of scRNA-seq data, and (right) iterative LSI of combined scATAC-seq and scRNA-seq. Cells are colored by clusters identified from the combined analysis. Adjusted Rand Index (ARI) of clusters identified from (left) scATAC-seq and (middle) scRNA-seq compared to the combination are shown in the top right of each plot. c-f, Distribution of Pearson correlations of inferred gene score and aligned gene expression for (c,e) each gene or (d,f) each cell group across groups of 100 cells (N = 500 groups). Distributions are either presented for (c,d) the top 1,000 differentially expressed genes or (e,f) the top 2,000 most variable genes for each of the 57 gene score models tested. See Extended Data Fig. 6 for further details. g, Heatmaps summarizing the accuracy (measured by Pearson correlation) across all models for both the top 1,000 differentially expressed and top 2,000 variable genes for paired scATAC-seq and scRNA-seq data. Each entry is colored by the model rank in the given test as described below the heatmap. The model class is indicated to the left of each heatmap. h, UMAPs of scATAC-seq data from the Multiome PBMCs dataset (N = 9,702 cells) colored by (bottom) inferred gene scores or (top) gene expression for several marker genes. i, Heatmaps of (left) gene expression or (right) gene scores for the top 1,000 differentially expressed genes (selected from scRNA-seq) across all cell types from the paired scATAC-seq and scRNA-seq data.
Extended Data Fig. 8
Extended Data Fig. 8. Analysis of the large hematopoiesis scATAC-seq dataset.
a, Schematic for the projection of bulk ATAC-seq data into an existing single-cell embedding using LSI projection. Bulk ATAC-seq data (10–20 million fragments) is down sampled to a fragment number corresponding to the average single-cell experiment, and LSI-projected into the single-cell subspace. b, LSI projection of bulk ATAC-seq data from diverse hematopoietic cell types into the scATAC-seq embedding of the hematopoiesis dataset. c-d, UMAP of scATAC-seq data from the hematopoiesis dataset (N = 215,031 cells) colored by (c) sorted cells processed with the Fluidigm C1 system or (d) inferred gene scores for marker genes of hematopoietic cells. e, Schematic of the scalable chromVAR method implemented in ArchR. ArchR computes global accessibility within each peak and then computes chromVAR deviations for each sample independently. f, Dot plot showing the identification of positive TF regulators through correlation of chromVAR TF deviation scores and inferred gene scores in cell groups (Correlation > 0.5 and Deviation Difference in the top 50th percentile). These TFs were additionally filtered by the maximum observed deviation score difference observed across each cluster average to remove TFs that are correlated but do not have large accessibility changes in hematopoiesis. g, Schematic of TF footprinting with Tn5 bias correction in ArchR. Base-pair resolution insertion coverage files from sample-aware pseudo-bulk replicates are used to compute the insertion frequency around each motif for each replicate. For each motif, the total observed k-mers relative to the motif center per bp are identified. This k-mer position frequency table can then be multiplied by the individual sample Tn5 k-mer frequencies to compute the Tn5 insertion bias per replicate. h, TF footprint for the NFIA motif. Lines are colored by cluster identity from the hematopoiesis dataset shown in Fig. 3b. i, Benchmarking of run time for TF footprinting with ArchR for the 102 sample-aware pseudo-bulk replicates from the hematopoiesis dataset.
Extended Data Fig. 9
Extended Data Fig. 9. Cross-platform integration in ArchR enables linkage of gene expression and chromatin accessibility in cell type-specific marker genes.
a, Side-by-side UMAPs for the hematopoiesis dataset cells colored by (top) gene expression (log2(Normalized Counts +1)) from scRNA-seq alignment or (bottom) inferred gene scores (log2(Gene Score +1)) from gene score Model 42 (see Fig. 2c) for key immune marker genes.
Extended Data Fig. 10
Extended Data Fig. 10. Peak-to-gene linkage and trajectory analysis in the large hematopoiesis dataset.
a, Schematic of identification of peak-to-gene links with ArchR. First, all combinations of peak-to-gene linkages are identified. Second, the peak accessibility and gene expression for cell groups are calculated. Finally, all potential peak-to-gene linkages are tested and significant links (R > 0.45 and FDR < 0.1) are kept. b, Heatmap of 70,239 peak-to-gene links identified across the hematopoiesis dataset with ArchR. c, UMAP of scATAC-seq data from a subset of cells derived from Granja et al. 2019. This data is the same as the hematopoietic tutorial data set (N = 10,251) used in the ArchR user manual. Cells are colored by ArchR identified clusters. d, UMAP as shown in Extended Data Fig. 10c but colored by trajectory position along the (top) B cell trajectory and (bottom) Myeloid trajectory for (left) ArchR, (middle) Slingshot, and (right) Monocle3. e, One-to-one comparisons of ArchR, Slingshot and Monocle3 scaled trajectory positions (Scaled TP) across the (left) B cell trajectory and (right) Myleoid trajectory.

References

    1. Buenrostro JD, et al. Single-cell chromatin accessibility reveals principles of regulatory variation. Nature. 2015;523:486–490. doi: 10.1038/nature14590. - DOI - PMC - PubMed
    1. Cusanovich DA, et al. Multiplex single cell profiling of chromatin accessibility by combinatorial cellular indexing. Science. 2015;348:910–914. doi: 10.1126/science.aab1601. - DOI - PMC - PubMed
    1. Cusanovich DA, et al. The cis-regulatory dynamics of embryonic development at single-cell resolution. Nature. 2018;555:538–542. doi: 10.1038/nature25981. - DOI - PMC - PubMed
    1. Buenrostro JD, et al. Integrated single-cell analysis maps the continuous regulatory landscape of human hematopoietic differentiation. Cell. 2018;173:1535–1548. doi: 10.1016/j.cell.2018.03.074. - DOI - PMC - PubMed
    1. Cusanovich DA, et al. A single-cell atlas of in vivo mammalian chromatin accessibility. Cell. 2018;174:1309–1324. doi: 10.1016/j.cell.2018.06.052. - DOI - PMC - PubMed

Publication types