. 2021 Feb 9:13:605970.
doi: 10.3389/fnagi.2021.605970. eCollection 2021.

Immune Profiling of Parkinson's Disease Revealed Its Association With a Subset of Infiltrating Cells and Signature Genes

Affiliations

Immune Profiling of Parkinson's Disease Revealed Its Association With a Subset of Infiltrating Cells and Signature Genes

Xi Zhang et al. Front Aging Neurosci. .

Abstract

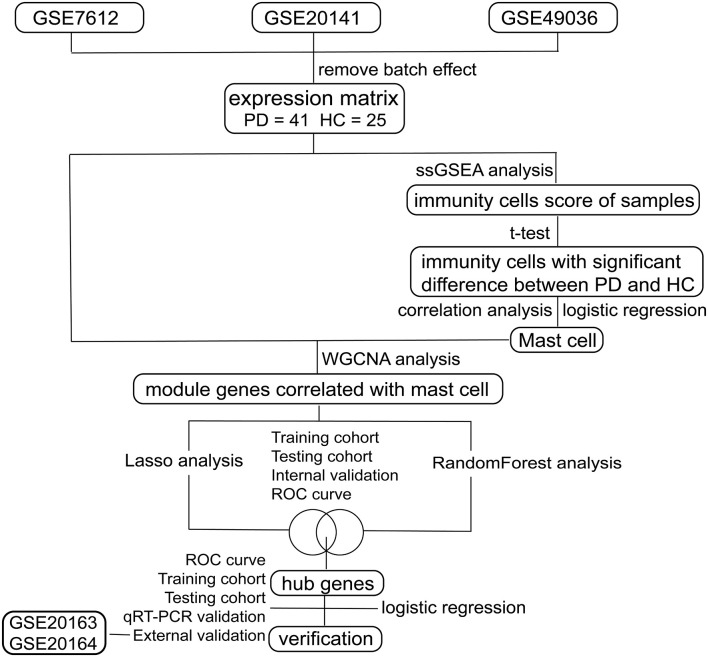
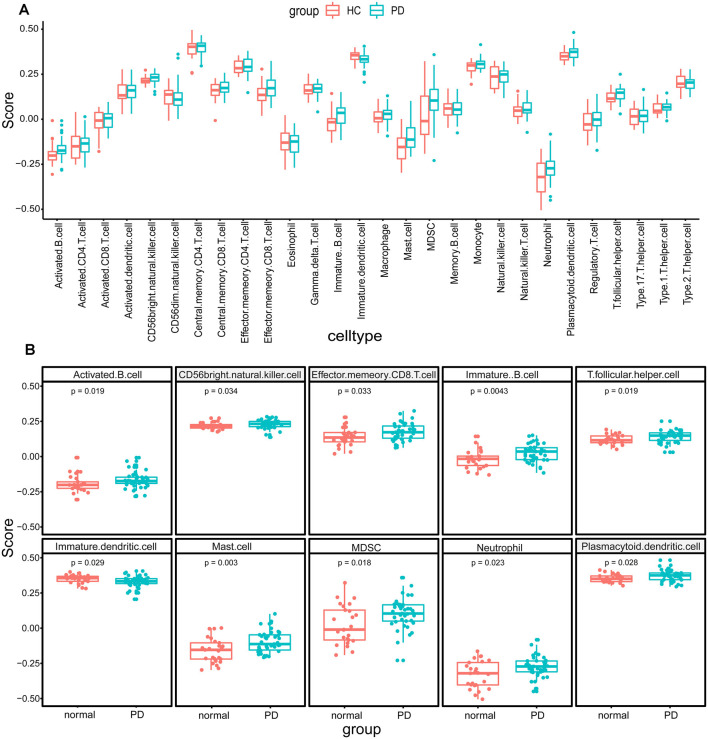
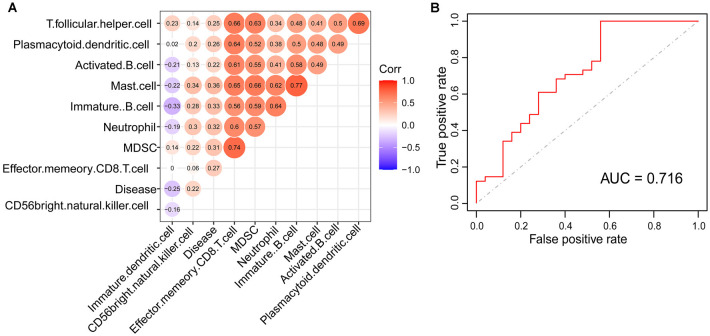
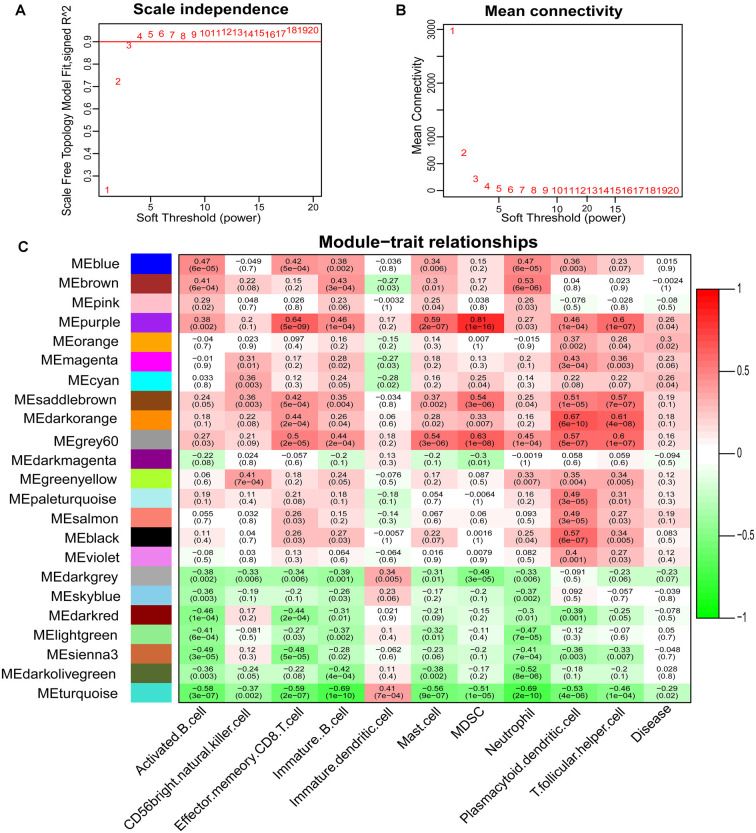
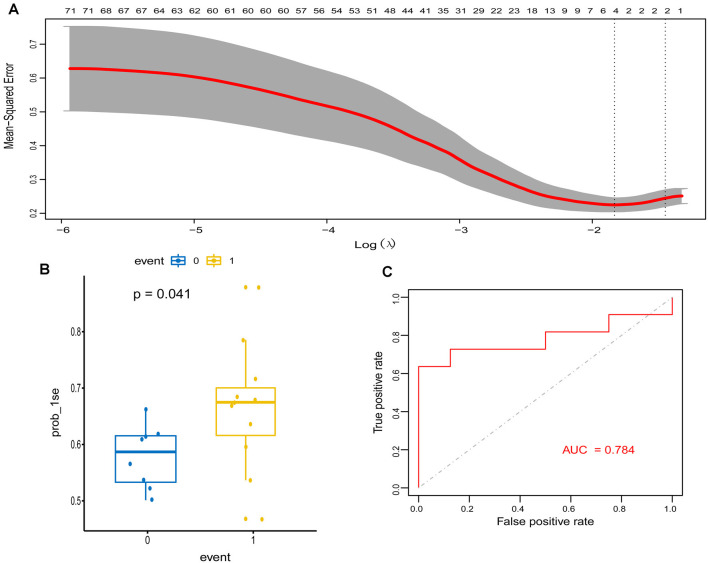
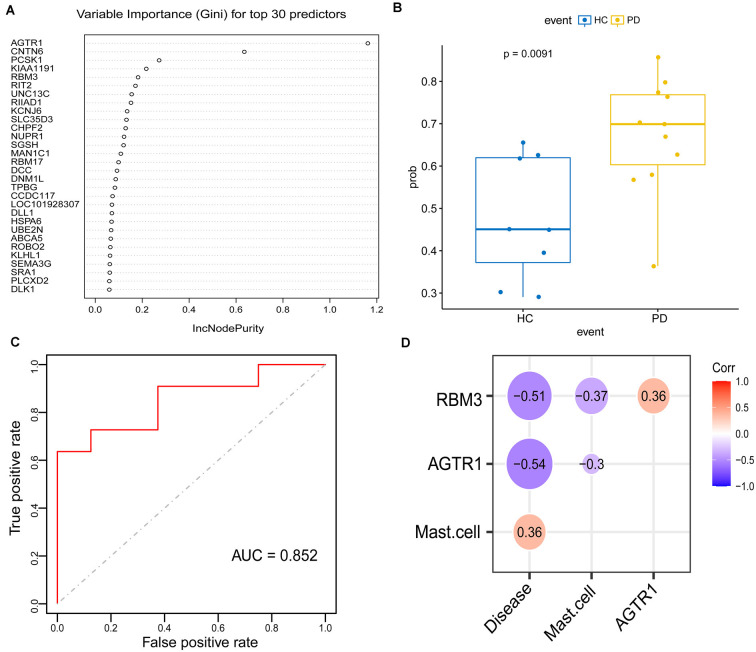
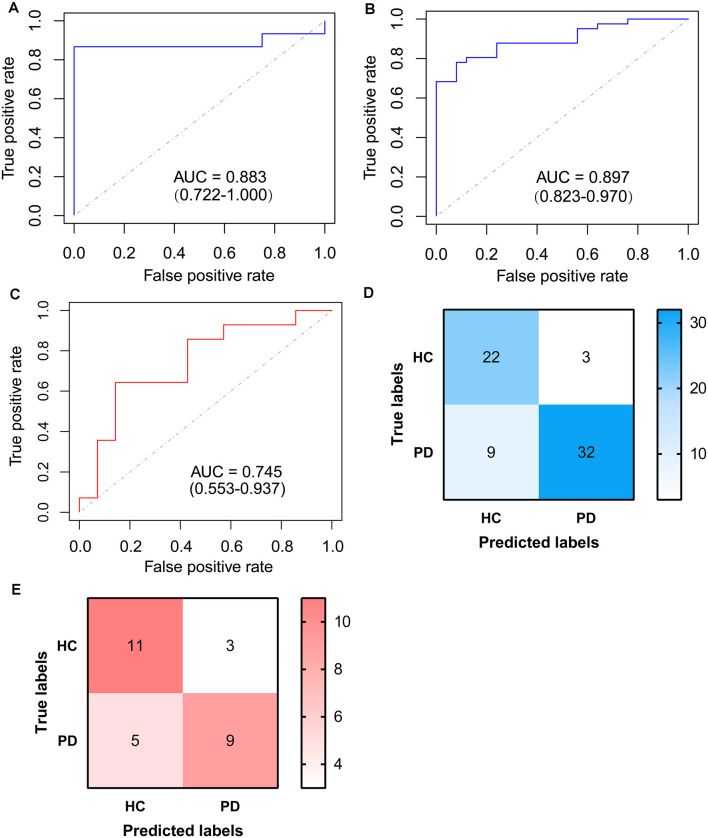
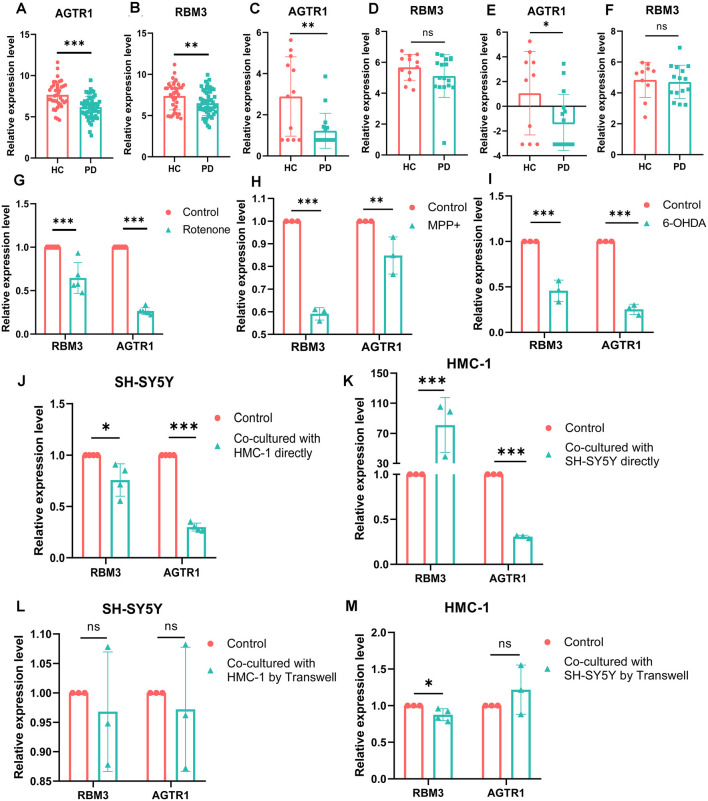
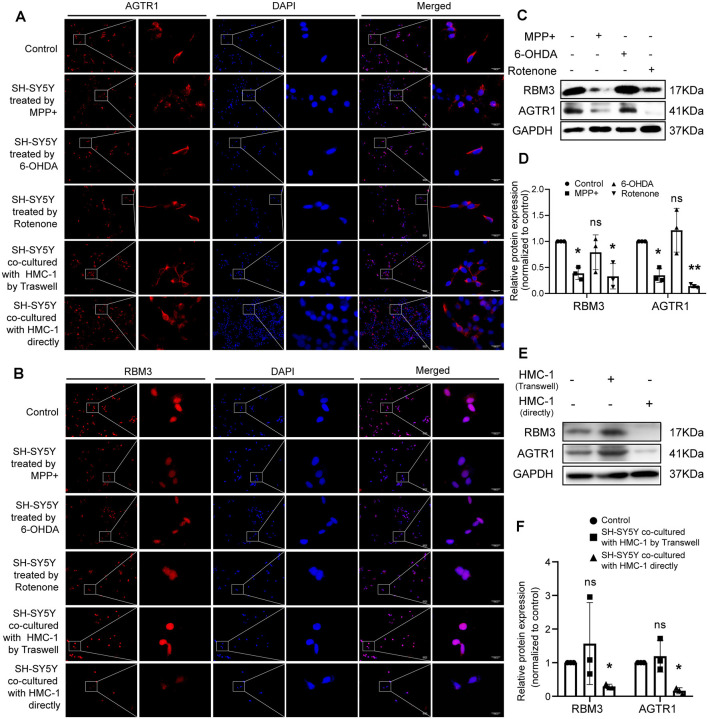
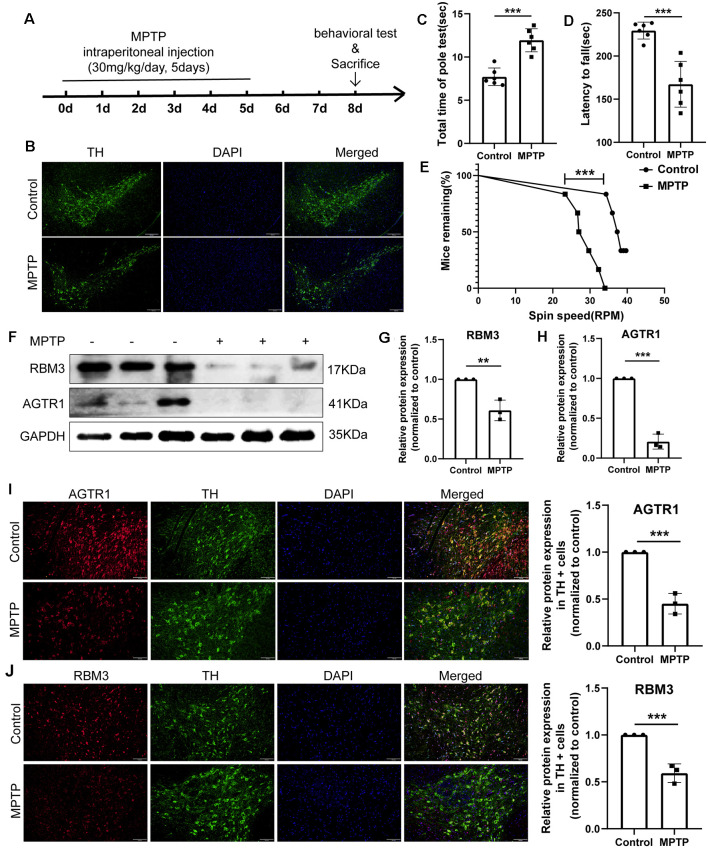
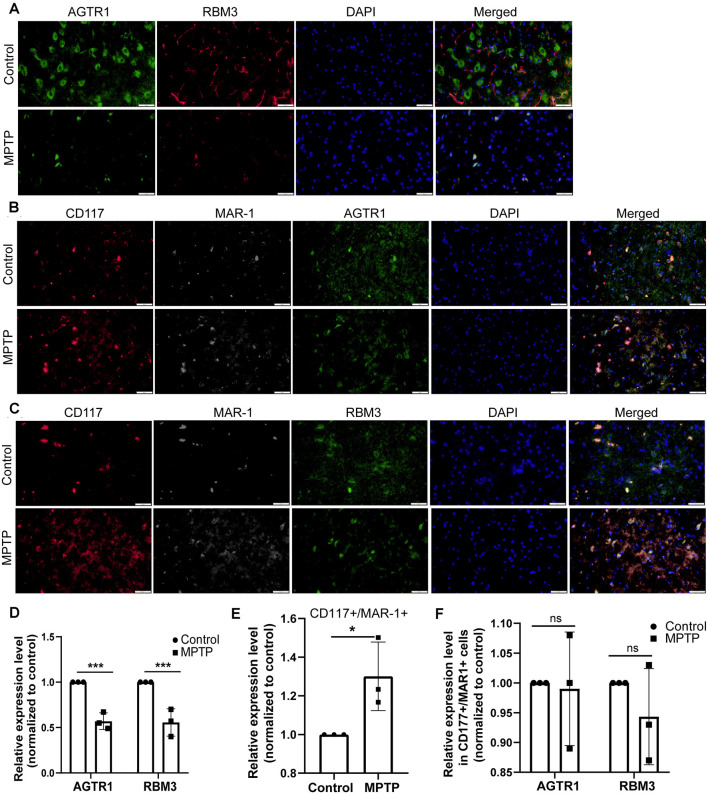
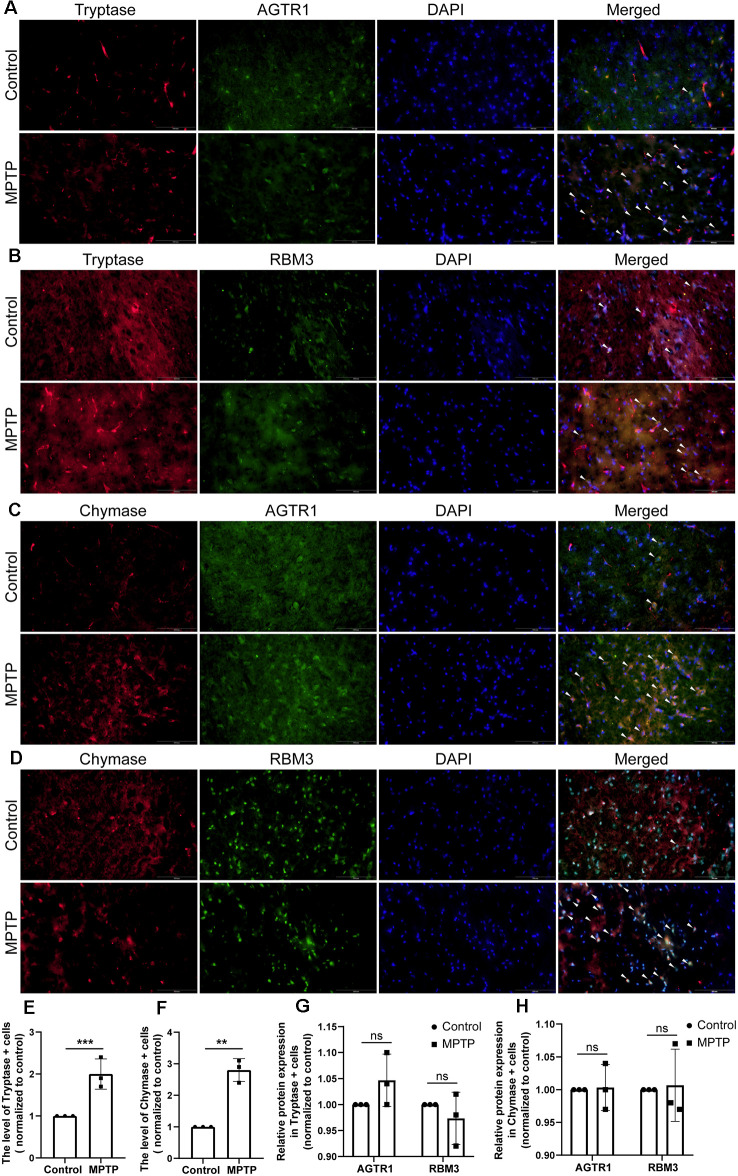
Parkinson's disease (PD) is an age-related and second most common neurodegenerative disorder. In recent years, increasing evidence revealed that peripheral immune cells might be able to infiltrate into brain tissues, which could arouse neuroinflammation and aggravate neurodegeneration. This study aimed to illuminate the landscape of peripheral immune cells and signature genes associated with immune infiltration in PD. Several transcriptomic datasets of substantia nigra (SN) from the Gene Expression Omnibus (GEO) database were separately collected as training cohort, testing cohort, and external validation cohort. The immunoscore of each sample calculated by single-sample gene set enrichment analysis was used to reflect the peripheral immune cell infiltration and to identify the differential immune cell types between PD and healthy participants. According to receiver operating characteristic (ROC) curve analysis, the immunoscore achieved an overall accuracy of the area under the curve (AUC) = 0.883 in the testing cohort, respectively. The immunoscore displayed good performance in the external validation cohort with an AUC of 0.745. The correlation analysis and logistic regression analysis were used to analyze the correlation between immune cells and PD, and mast cell was identified most associated with the occurrence of PD. Additionally, increased mast cells were also observed in our in vivo PD model. Weighted gene co-expression network analysis (WGCNA) was used to selected module genes related to a mast cell. The least absolute shrinkage and selection operator (LASSO) analysis and random-forest analysis were used to analyze module genes, and two hub genes RBM3 and AGTR1 were identified as associated with mast cells in the training cohort. The expression levels of RBM3 and AGTR1 in these cohorts and PD models revealed that these hub genes were significantly downregulated in PD. Moreover, the expression trend of the aforementioned two genes differed in mast cells and dopaminergic (DA) neurons. In conclusion, this study not only exhibited a landscape of immune infiltrating patterns in PD but also identified mast cells and two hub genes associated with the occurrence of PD, which provided potential therapeutic targets for PD patients (PDs).

Keywords: AGTR1; Parkinson’s disease; RBM3; immune cell infiltration; mast cell.


Conflict of interest statement

The authors declare that the research was conducted in the absence of any commercial or financial relationships that could be construed as a potential conflict of interest.

Figures

Figure 1
Figure 1
Flow chart of this study.
Figure 2
Figure 2
The immune cell infiltration analysis of substantia nigra between Parkinson’s disease patients (PDs) and healthy controls (HCs). (A) The landscape of immune cell infiltration based on expression data from the Gene Expression Omnibus (GEO) database. (B) The immune cell types with significant differences between PDs and HCs.
Figure 3
Figure 3
Mast cell was identified to be tightly correlated with PD. (A) The correlation of disease state and immune cell types with significant differences between PDs and HCs. (B) The receiver operating characteristic (ROC) curve of logistic model for verifying the association between mast cell and the occurrence of PD.
Figure 4
Figure 4
Determination of soft-thresholding power in the weighted gene co-expression network analysis (WGCNA) and identification of modules. (A) Analysis of the scale-free fit index for various soft-thresholding powers. (B) Analysis of the mean connectivity for various soft-thresholding powers. (C) Heatmap of the correlation between module eigengenes and clinical traits of PD.
Figure 5
Figure 5
Construction and validation of the least absolute shrinkage and selection operator (LASSO) model in PD patients. (A) The relationship between cross-validated mean square error and model size. Partial likelihood deviance is plotted against log (λ), where λ is the tuning parameter. Dotted vertical lines were drawn at the optimal values by minimum criteria and 1-s.e. criteria, and we selected 1-s.e. criteria to construct the model. (B) The distribution of the LASSO model in the testing cohort. (C) ROC curve of LASSO model for differentiating PDs from HCs of the testing cohort.
Figure 6
Figure 6
Construction and validation of the random forest (RF) model in PDs. (A) Top 30 genes based on the parameter of increase in node purity in RF analysis. (B) The distribution of the RF model is based on these 30 genes in the testing cohort. (C) ROC curve of RF model for differentiating PDs from HCs of the testing cohort. (D) The correlation between the intersection gene of lasso and RF analysis (RBM3, AGTR1), mast cell, and disease state.
Figure 7
Figure 7
ROC curve of logistic model based on RBM3 and AGTR1. (A) ROC curve of logistic model for differentiating PDs from HCs of the testing cohort. (B) ROC curve of logistic model for differentiating PDs from HCs of the internal cohort. (C) ROC curve of logistic model for differentiating PDs from HCs of the external cohort. (D) Confusion matrix based on the internal cohort. (E) Confusion matrix based on the external cohort.
Figure 8
Figure 8
The mRNA relative expression levels of RBM3 and AGTR1 in GEO datasets and PD cell culture model. (A) The expression levels of AGTR1 of PDs and HCs in a total of five array datasets. (B) The expression levels of RBM3 of PDs and HCs in a total of five array datasets. (C) The expression levels of AGTR1 of PDs and HCs in GSE114517. (D) The expression levels of RBM3 of PDs and HCs in GSE114517. (E) The expression levels of AGTR1 of PDs and HCs in GSE133101. (F) The expression levels of RBM3 of PDs and HCs in GSE133101. (G) The expression levels of RBM3 and AGTR1 in cell culture model in vitro constructed by SH-SY5Y cell using rotenone. (H) The expression levels of RBM3 and AGTR1 in cell culture model in vitro constructed by SH-SY5Y cell using MPP+. (I) The expression levels of RBM3 and AGTR1 in cell culture model in vitro constructed by SH-SY5Y cell using 6-OHDA. (J) The expression levels of RBM3 and AGTR1 in SH-SY5Y cell co-cultured with HMC-1 cell directly. (K) The expression levels of RBM3 and AGTR1 in HMC-1 cell co-cultured with SH-SY5Y cell directly. (L) The expression levels of RBM3 and AGTR1 in SH-SY5Y cell co-cultured with HMC-1 cell by Transwell. (M) The expression levels of RBM3 and AGTR1 in HMC-1 cell co-cultured with SH-SY5Y cell by Transwell (ns p > 0.05, *p < 0.05, **p < 0.01, ***p < 0.001 vs. Control group).
Figure 9
Figure 9
The protein relative expression levels of RBM3 and AGTR1 in PD cell culture model. (A) AGTR1 expression level in each treated group was detected by fluorescence microscope after immunofluorescence staining. Scale bars: 100 μm; 1,000 μm. (B) RBM3 expression level in each treated group was detected by fluorescence microscope after immunofluorescence staining. (C,D) Western blot analyses of specific genes’ expression in SH-SY5Y cells treated by MPP+, 6-OHDA, and Rotenone. GAPDH was used as an endogenous control. (E,F) Western blot analyses of specific genes’ expression in SH-SY5Y cells co-cultured with HMC-1 by Transwell or directly. GAPDH was used as an endogenous control (ns p > 0.05, *p < 0.05, **p < 0.01, vs. Control group).
Figure 10
Figure 10
The relative protein expression levels of RBM3 and AGTR1 in the PD animal model. (A) The flowchart of the construction of the MPTP subacute model, behavioral tests, and sacrifice. (B) Tyrosine hydroxylase (TH) staining of the substantia nigra (SN) of the above mice. Scale bars: 200 μm. (C) Pole tests were conducted by a blinded observer after MPTP treatment. (D,E) Rotarod tests were conducted by a blinded observer after MPTP treatment. (F–H) Western blot analyses of RBM3 and AGTR1 in SN of the above mice. (I) The co-localization of AGTR1 and TH in SN of the control group and MPTP group was detected by fluorescence microscope after immunofluorescence staining. Scale bars: 100 μm. (J) The co-localization of RBM3 and TH in SN of two groups was detected by fluorescence microscope (**p < 0.01, ***p < 0.001 vs. Control group).
Figure 11
Figure 11
The relative protein expression levels of RBM3 and AGTR1 in the PD animal model. (A) The co-localization of AGTR1 and RBM3 in SN of two groups was detected by fluorescence microscope. Scale bars: 50 μm. (B) The co-localization of AGTR1, MAR-1, and CD117 in SN of two groups was detected by fluorescence microscope. (C) The co-localization of RBM3, MAR-1, and CD117 in SN of two groups was detected by fluorescence microscope. (D) The relative expression levels of AGTR1 and RBM3 in SN of the two groups are based on the co-localization of AGTR1 and RBM3. (E) The relative co-expression level of CD117/MAR-1 in SN of two groups based on the co-localization of CD117 and MAR-1. (F) The relative expression levels of AGTR1 and RBM3 in SN of two groups separately based on the co-localization of AGTR1/CD117/MAR-1 and RBM3/CD117/ MAR-1 (ns p > 0.05, *p < 0.05, ***p < 0.001 vs. Control group).
Figure 12
Figure 12
The relative protein expression levels of RBM3 and AGTR1 in the PD animal model. (A) The co-localization of AGTR1 and Tryptase in SN of two groups was detected by fluorescence microscope. Scale bars: 100 μm. (B) The co-localization of RBM3 and Tryptase in SN of two groups was detected by fluorescence microscope. (C) The co-localization of AGTR1 and Chymase in SN of two groups was detected by fluorescence microscope. (D) The co-localization of RBM3 and Chymase in SN of two groups was detected by fluorescence microscope. (E) The relative expression levels of Tryptase in SN of two groups. (F) The relative expression levels of Chymase in SN of two groups. (G) The relative expression levels of AGTR1 and RBM3 in SN of two groups separately based on the co-localization of AGTR1/Tryptase and RBM3/ Tryptase. (H) The relative expression levels of AGTR1 and RBM3 in SN of two groups separately based on the co-localization of AGTR1/Chymase and RBM3/ Chymase (ns p > 0.05, **p < 0.01, ***p < 0.001 vs. Control group).

Similar articles

Cited by

References

    1. Barrett T., Wilhite S. E., Ledoux P., Evangelista C., Kim I. F., Tomashevsky M., et al. . (2013). NCBI GEO: archive for functional genomics data sets—update. Nucleic Acids Res. 41, D991–D995. 10.1093/nar/gks1193 - DOI - PMC - PubMed
    1. Calabrese V., Santoro A., Monti D., Crupi R., Di Paola R., Latteri S., et al. . (2018). Aging and Parkinson’s disease: inflammaging, neuroinflammation and biological remodeling as key factors in pathogenesis. Free Radic. Biol. Med. 115, 80–91. 10.1016/j.freeradbiomed.2017.10.379 - DOI - PubMed
    1. Cao J.-J., Li K.-S., Shen Y.-Q. (2011). Activated immune cells in Parkinson’s disease. J. Neuroimmune Pharmacol. 6, 323–329. 10.1007/s11481-011-9280-9 - DOI - PubMed
    1. Charoentong P., Finotello F., Angelova M., Mayer C., Efremova M., Rieder D., et al. . (2017). Pan-cancer immunogenomic analyses reveal genotype-immunophenotype relationships and predictors of response to checkpoint blockade. Cell Rep. 18, 248–262. 10.1016/j.celrep.2016.12.019 - DOI - PubMed
    1. Fasano A., Visanji N. P., Liu L. W. C., Lang A. E., Pfeiffer R. F. (2015). Gastrointestinal dysfunction in Parkinson’s disease. Lancet Neurol. 14, 625–639. 10.1016/S1474-4422(15)00007-1 - DOI - PubMed

LinkOut - more resources