. 2021 Feb 9:11:600266.
doi: 10.3389/fphar.2020.600266. eCollection 2020.

Deletion of Orphan G Protein-Coupled Receptor GPR37L1 in Mice Alters Cardiovascular Homeostasis in a Sex-Specific Manner

Affiliations

Deletion of Orphan G Protein-Coupled Receptor GPR37L1 in Mice Alters Cardiovascular Homeostasis in a Sex-Specific Manner

Margaret A Mouat et al. Front Pharmacol. .

Abstract

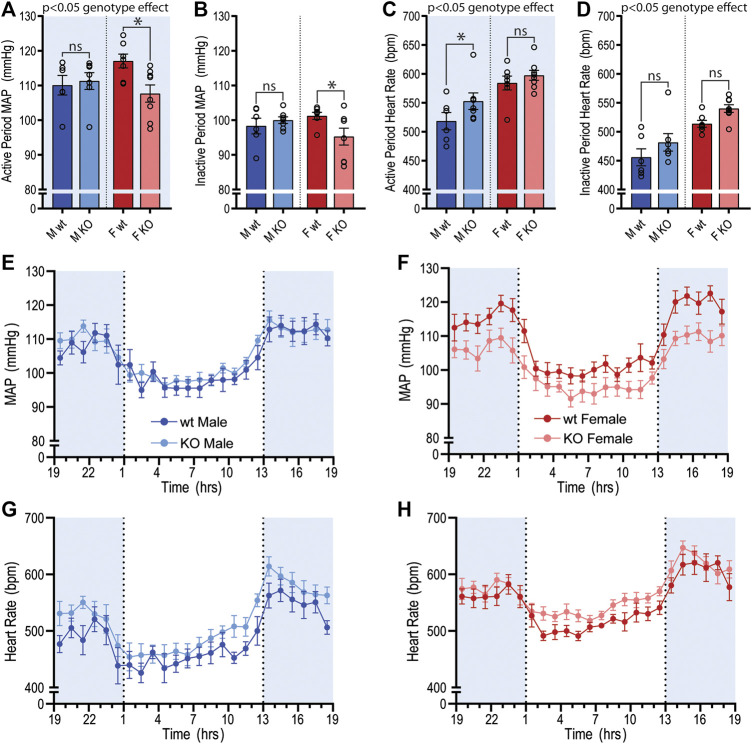
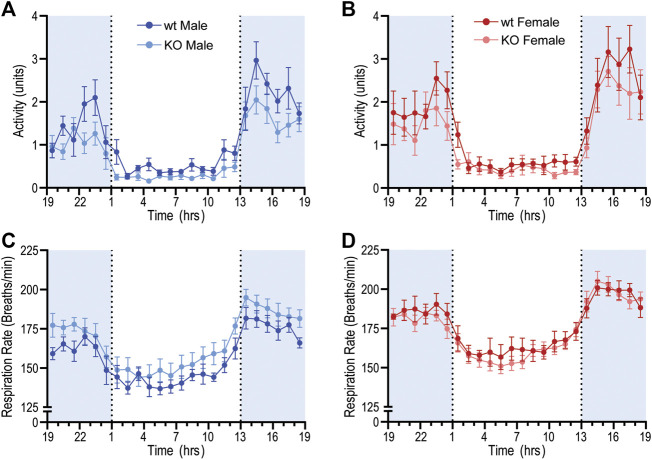
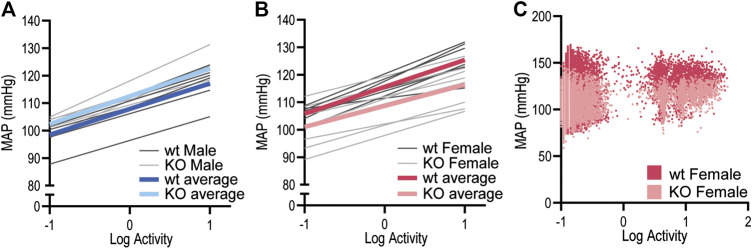
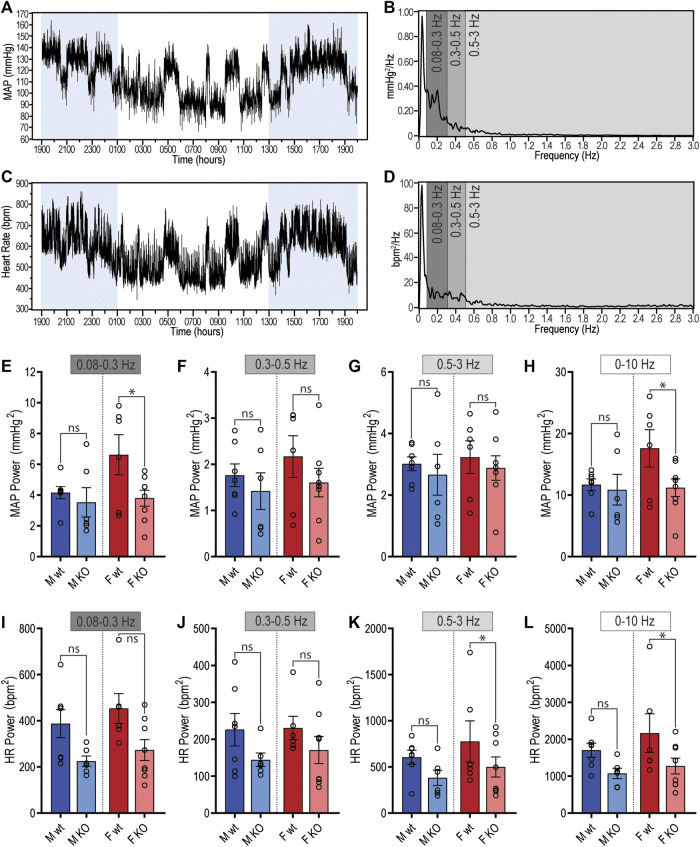
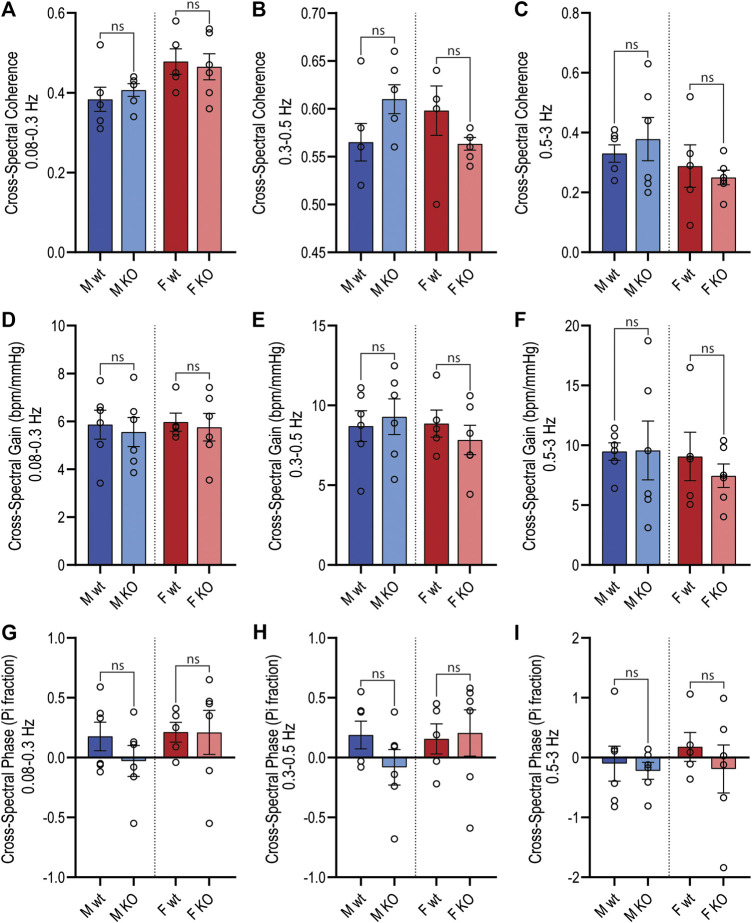
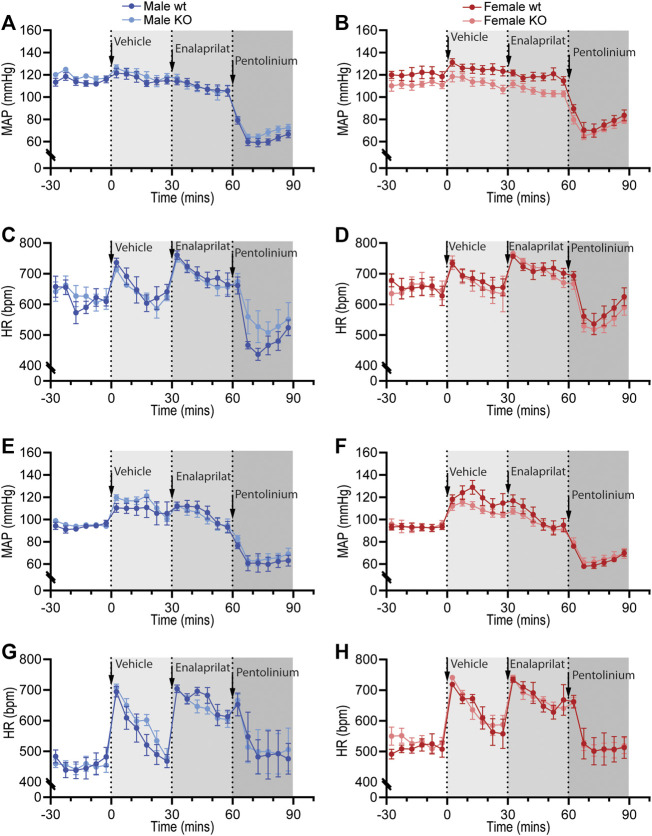
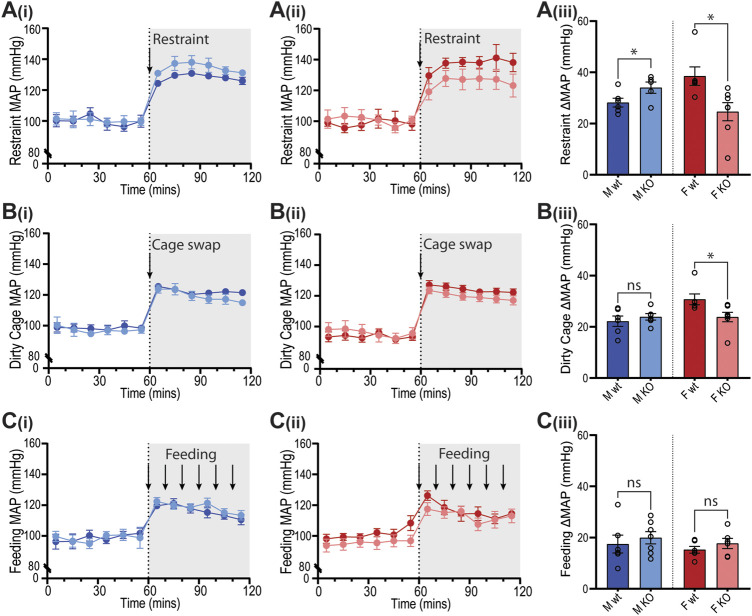
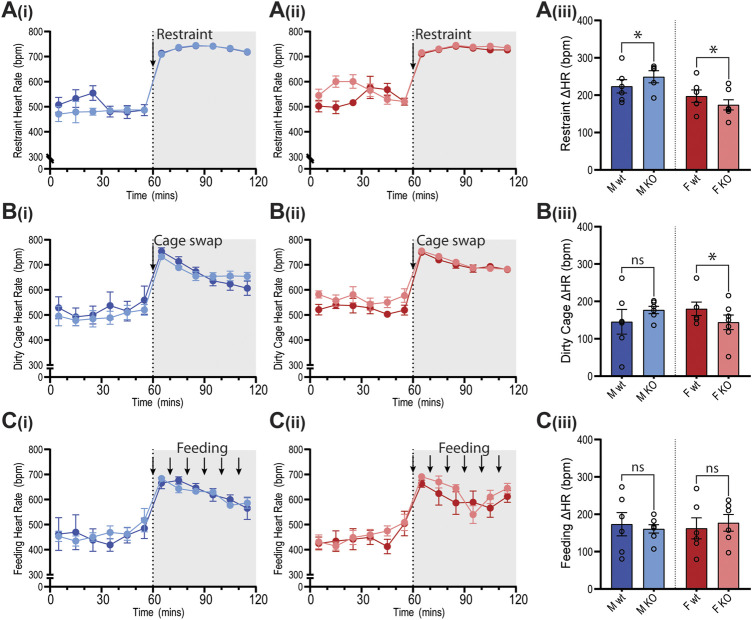
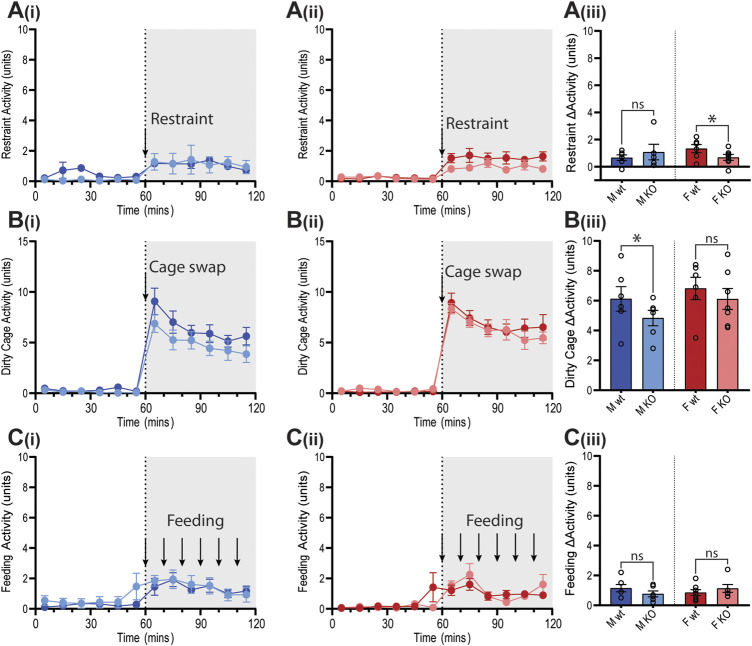
GPR37L1 is a family A orphan G protein-coupled receptor (GPCR) with a putative role in blood pressure regulation and cardioprotection. In mice, genetic ablation of Gpr37l1 causes sex-dependent effects; female mice lacking Gpr37l1 (GPR37L1-/-) have a modest but significant elevation in blood pressure, while male GPR37L1-/- mice are more susceptible to cardiovascular dysfunction following angiotensin II-induced hypertension. Given that this receptor is highly expressed in the brain, we hypothesize that the cardiovascular phenotype of GPR37L1-/- mice is due to changes in autonomic regulation of blood pressure and heart rate. To investigate this, radiotelemetry was employed to characterize baseline cardiovascular variables in GPR37L1-/- mice of both sexes compared to wildtype controls, followed by power spectral analysis to quantify short-term fluctuations in blood pressure and heart rate attributable to alterations in autonomic homeostatic mechanisms. Additionally, pharmacological ganglionic blockade was performed to determine vasomotor tone, and environmental stress tests were used to assess whether cardiovascular reactivity was altered in GPR37L1-/- mice. We observed that mean arterial pressure was significantly lower in female GPR37L1-/- mice compared to wildtype counterparts, but was unchanged in male GPR37L1-/- mice. GPR37L1-/- genotype had a statistically significant positive chronotropic effect on heart rate across both sexes when analyzed by two-way ANOVA. Power spectral analysis of these data revealed a reduction in power in the heart rate spectrum between 0.5 and 3 Hz in female GPR37L1-/- mice during the diurnal active period, which indicates that GPR37L1-/- mice may have impaired cardiac vagal drive. GPR37L1-/- mice of both sexes also exhibited attenuated depressor responses to ganglionic blockade with pentolinium, indicating that GPR37L1 is involved in maintaining sympathetic vasomotor tone. Interestingly, when these mice were subjected to aversive and appetitive behavioral stressors, the female GPR37L1-/- mice exhibited an attenuation of cardiovascular reactivity to aversive, but not appetitive, environmental stimuli. Together, these results suggest that loss of GPR37L1 affects autonomic maintenance of blood pressure, giving rise to sex-specific cardiovascular changes in GPR37L1-/- mice.

Keywords: G protein-coupled receptor; blood pressure; heart rate variability; hypertension; radiotelemetry; sex differences.


Conflict of interest statement

The authors declare that the research was conducted in the absence of any commercial or financial relationships that could be construed as a potential conflict of interest.

Figures

Figure 1
Figure 1
Baseline mean arterial pressure and heart rate recordings using radiotelemetry in GPR37L1−/− mice. Cardiovascular parameters were recorded by radiotelemetry for male and female wildtype (C57BL/6J; wt) and GPR37L1−/− (KO) mice over a continuous period of ≥60 h at 14–15 weeks of age. Average mean arterial pressure (MAP) over the active period (1300–0100h; (A)) and inactive period (0100–1300h; (B)). Average heart rate over the active period (C) and the inactive period (D). For clarity, sexes are plotted separately; plot of hourly average MAP for males (E) and females (F), heart rate for males (G) and females (H). Males n = 6–7, females n = 7–8. XY plot data points are mean ± SEM averaged over each hour (average of ≥60 h recording). Bar graphs show mean ± SEM, open circles represent 12 h averages for individual subjects, statistical analysis was performed on hourly averages using split plot ANOVA with Bonferroni correction for multiple comparisons. Shaded areas indicate dark period (lights off 1300 to 0100 h).
Figure 2
Figure 2
Baseline radiotelemetry recordings for locomotor activity and respiration rate. Locomotor activity and respiratory rate was recorded via radiotelemeter for male and female wildtype (C57BL/6J; wt) and GPR37L1−/− (KO) mice over a continuous period of ≥60 h at 14–15 weeks of age. Locomotor activity (arbitrary units) for males (A) and females (B). Respiratory rate for males (C) and females (D). Data points are mean ± SEM averaged over each hour (average of ≥60 h recording), males n = 6–7, females n = 7–8. Shaded areas indicate dark period (lights off 1300 to 0100 h).
Figure 3
Figure 3
Relationship between MAP and locomotor activity in GPR37L1−/− mice. Linear regressions for mean arterial pressure (MAP) vs. log-locomotor activity in male (n = 6–7) (A) and female (n = 7–8) (B) GPR37L1−/− (KO; light gray) and wildtype (wt; C57BL/6J; dark gray) mice during baseline radiotelemetry recordings over a 12-h period (6 h of dark and 6 h of light), with colored lines representing average regression for each genotype. Representative plot of 2-s averages of log-locomotor activity against 6-s-offset MAP over the 12-h period for one wildtype female (darker red) and one GPR37L1−/− female (lighter red) (C).
Figure 4
Figure 4
Spectral power analysis of radiotelemetry cardiovascular recordings in GPR37L1−/− (KO) mice. Representative mean arterial pressure (MAP; (A)) and heart rate (C) recording of a C57BL/6J mouse over a 24-h period (lights on 0100–1300 h). Segments of this recording were subjected to spectral power analysis, with representative power spectra in the frequency domain given for MAP (B) and heart rate (D). Cumulative spectral power was calculated in the low (0.08–0.3 Hz), medium (0.3–0.5 Hz), high (0.5–3 Hz) and total (0–10 Hz) frequency bands for both MAP (E)–(H) and heart rate (I)–(L) radiotelemetry recordings from C57BL/6J wildtype (wt) and GPR37L1−/− (KO) mice during active period at 14–15 weeks of age. Males n = 6–7, females n = 6–8, analyzed by split plot ANOVA of four spectral sequences with Bonferroni correction for multiple comparisons. Bar graphs represent mean ± SEM; * represents p < 0.05 vs. wt, ns is not significant.
Figure 5
Figure 5
Active period cross-spectral analysis. Cross-spectral parameters for MAP and HR spectra in male and female wildtype (wt, C57BL/6) and GPR37L1−/− (KO) mice derived from radiotelemetry recordings during the active period (1300–0100 h) subjected to cross-spectral power analysis. Spectral coherence (correlation coefficient) between MAP and HR spectra is given in the frequency bands: 0.08–0.3 Hz (A), 0.3–0.5 Hz (B) (mid frequency band, associated with SNS fluctuations), and 0.5–3 Hz (C). Cross-spectral gain (change in HR in bpm per mmHg change in MAP) is given in 0.08–0.3 Hz (D), 0.3–0.5 Hz (E), and 0.5–3 Hz (F) frequency bands. The phase of HR spectra in relation to MAP spectra is shown in 0.08–0.3 Hz (G), 0.3–0.5 Hz (H), and 0.5–3 Hz (I) frequency bands. Males n = 6, females n = 5–6. Analyzed by split plot ANOVA of four spectral sequences with Bonferroni correction for multiple comparisons. Graphs represent mean ± SEM with individual data points represented by open circles; * represents p < 0.05 vs. wt, ns is not significant.
Figure 6
Figure 6
Pharmacological blockade of the renin-angiotensin system and sympathetic nervous system in GPR37L1−/− (KO) mice. Sequential pharmacological blockade of the renin-angiotensin system (enalaprilat, 1 mg/kg IP) and the sympathetic nervous system (pentolinium, 5 mg/kg IP) in 15–17 week old wildtype and GPR37L1−/− mice was performed during the active (A)–(D) and inactive (E)–(H) periods. MAP was derived from telemetry recordings for both male (A), (E) and female mice (B), (F). HR over this period was also recorded for males (C), (G) and females (D), (H). Arrows indicate time of IP drug administration. Data points are mean ± SEM for each 5 min interval. Active period male n = 6, female n = 7; inactive period male n = 5–6, female n = 6–7.
Figure 7
Figure 7
Blood pressure responses of GPR37L1−/− mice to physical stress tests. Wildtype (wt, C57BL/6) and GPR37L1−/− (KO) mice were subjected to a series of stress tests while blood pressure was recorded via radiotelemeter at 14–17 weeks of age. One hour of stable baseline recording was acquired prior to testing; confining mouse inside a plexiglass restraint apparatus (‘restraint’, n = 5–6, females n = 6–7) (A), swapping mouse into a soiled cage (‘cage swap’, males n = 6, females n = 6–7) (B) and feeding with almond every 10 min (‘feeding’, males n = 6–7, females n = 6) (C). 10 min averages of mean arterial pressure (MAP) are shown for males (Ai)(Ci) and females (Aii)(Cii) over the course of each experiment. Change in MAP was determined as the difference between baseline MAP average vs test MAP average (Aiii)(Ciii). XY plot data points are mean ± SEM for 5-min averages. For simplicity, bar graphs show mean ± SEM, with open circles representing average MAP change between control (0–60 min) and test (60–120 min) for individual subjects, though statistical analysis was performed on 5-min averages (XY plot data) using split plot ANOVA with Bonferroni correction for multiple comparisons, * represents p < 0.05 vs. wt, ns is not significant.
Figure 8
Figure 8
Heart rate of GPR37L1−/− mice in response to physical stress tests. Wildtype (wt, C57BL/6) and GPR37L1−/− (KO) mice were subjected to a series of stress tests while heart rate was recorded via radiotelemeter at 14–17 weeks of age. One hour of stable baseline recording was acquired prior to testing; placing the mouse inside a confined plexiglass restrainer (‘restraint’, n = 5-6, females n = 6–7) (A), swapping mouse into a soiled cage (‘cage swap’, males n = 6, females n = 6–7) (B) and feeding with almond every 10 min (‘feeding’, males n = 6–7, females n = 6) (C). 10-min averages of heart rate are shown for males (Ai)(Ci) and females (Aii)(Cii) over the course of each experiment. Change in heart rate was determined as the difference between baseline heart rate average vs test heart rate average (Aiii)(Ciii). XY plot data points are mean ± SEM for 5-min averages. For simplicity, bar graphs show mean ± SEM, with open circles representing average HR change between control (0–60 min) and test (60–120 min) for individual subjects, though statistical analysis was performed on 5-min averages (XY plot data) using split plot ANOVA with Bonferroni correction for multiple comparisons, * represents p < 0.05 vs. wt, ns is not significant.
Figure 9
Figure 9
Locomotor responses of GPR37L1−/− mice to physical stress tests. Wildtype (wt, C57BL/6) and GPR37L1−/− (KO) mice were subjected to a series of stress tests while locomotor activity was recorded via radiotelemeter at 14–17 weeks of age. One hour of stable baseline recording was acquired prior to testing; placing the mouse inside a confined plexiglass restrainer (males n = 5-6, females n = 6–7) (A), swapping mouse into a soiled cage (males n = 6, females n = 6–7) (B) and feeding with almond every 10 min (males n = 6-7, females n = 6) (C). 10-min averages of locomotor activity are shown for males (Ai, Bi, Ci) and females (Aii, Bii, Cii) over the course of each experiment. Change in activity was determined by the average activity during test compared to the average of the baseline period for each test (Aiii, Biii, Ciii). XY plot data points are mean ± SEM for 5-min averages. For simplicity, bar graphs show mean ± SEM, with open circles representing average activity change between control (0–60 min) and test (60–120 min) for individual subjects, though statistical analysis was performed on 5-min averages (XY plot data) using split plot ANOVA with Bonferroni correction for multiple comparisons, * represents p < 0.05 vs. wt, ns is not significant.
Figure 10
Figure 10
Light-dark transition anxiety test. Wildtype (wt, C57BL/6) and GPR37L1−/− (KO) mice were placed into the light-dark test apparatus and parameters indicative of anxiety behaviors were scored; percentage of time spent in the light section of apparatus (A), number of transitions between sections (B), number of rearing events (C) and number of nose pokes not followed by complete transition (D). Males n = 7–8, females n = 7–9. Analyzed by ordinary two-way ANOVA with Bonferroni correction for multiple comparisons. Graphs represent mean ± SEM with open circles representing individual subjects, * represents p < 0.05 vs. wt, ns is not significant.

Similar articles

Cited by

References

    1. Abegaz B., Davern P. J., Jackson K. L., Nguyen-Huu T. P., Bassi J. K., Connelly A., et al. (2013). Cardiovascular role of angiotensin type1A receptors in the nucleus of the solitary tract of mice. Cardiovasc. Res. 100, 181–191. 10.1093/cvr/cvt183 - DOI - PubMed
    1. Adams D. J., Head G. A., Markus M. A., Lovicu F. J., Van Der Weyden L., Köntgen F., et al. (2006). Renin enhancer is critical for control of renin gene expression and cardiovascular function. J. Biol. Chem. 281, 31753–31761. 10.1074/jbc.M605720200 - DOI - PubMed
    1. Åstrand A., Bohlooly-Y M., Larsdotter S., Mahlapuu M., Andersén H., Tornell J., et al. (2004). Mice lacking melanin-concentrating hormone receptor 1 demonstrate increased heart rate associated with altered autonomic activity. Am. J. Physiol. Regul. Integr. Comp. Physiol. 287, R749–R758. 10.1152/ajpregu.00134.2004 - DOI - PubMed
    1. Baudrie V., Laude D., Elghozi J. L. (2007). Optimal frequency ranges for extracting information on cardiovascular autonomic control from the blood pressure and pulse interval spectrograms in mice. Am. J. Physiol. Regul. Integr. Comp. Physiol. 292, R904–R912. 10.1152/ajpregu.00488.2006 - DOI - PubMed
    1. Bruder-Nascimento T., Ekeledo O. J., Anderson R., Le H. B., Belin de Chantemèle E. J. (2017). Long term high fat diet treatment: an appropriate approach to study the sex-specificity of the autonomic and cardiovascular responses to obesity in mice. Front. Physiol. 8, 32 10.3389/fphys.2017.00032 - DOI - PMC - PubMed

LinkOut - more resources