. 2021 Feb 3:12:583453.
doi: 10.3389/fphys.2021.583453. eCollection 2021.

Unilateral Nephrectomy Stimulates ERK and Is Associated With Enhanced Na Transport

Affiliations

Unilateral Nephrectomy Stimulates ERK and Is Associated With Enhanced Na Transport

Robert Repetti et al. Front Physiol. .

Abstract

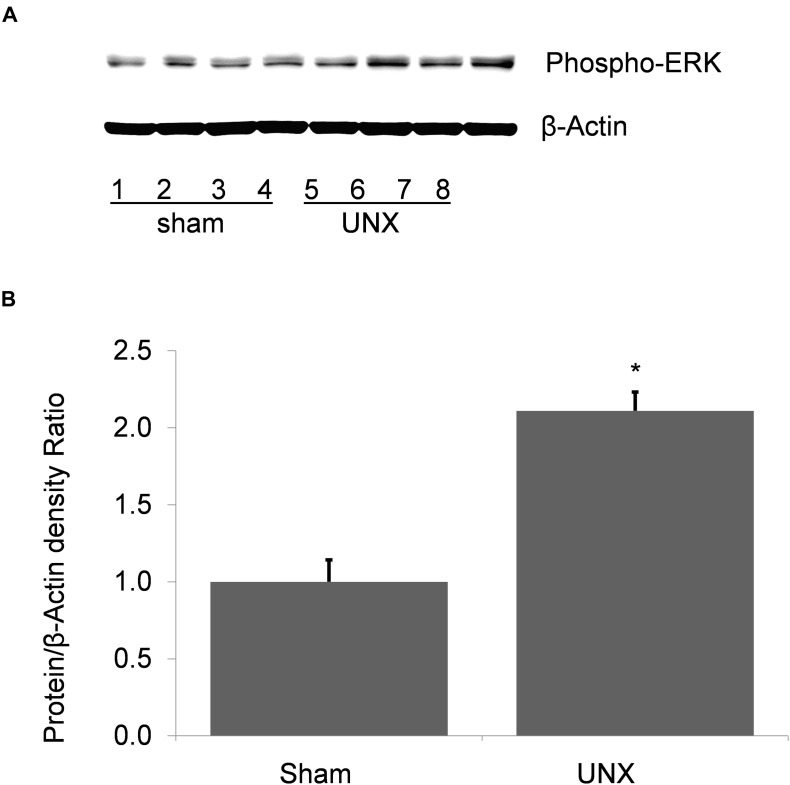
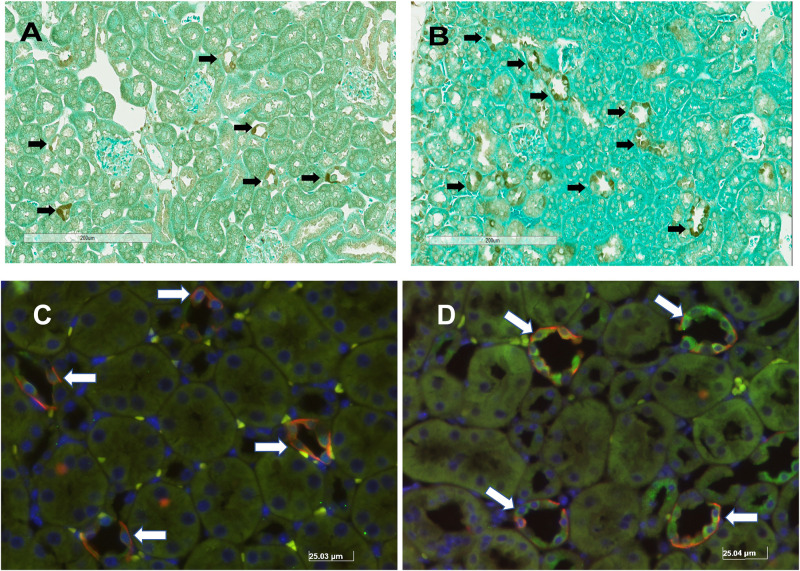
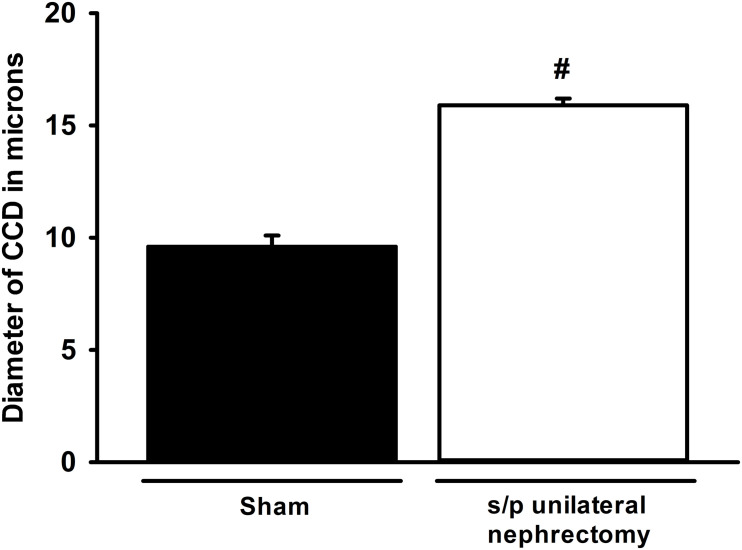
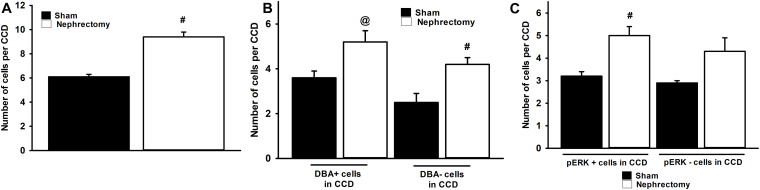
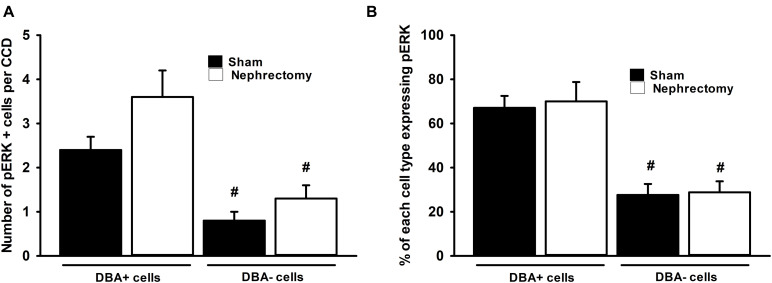
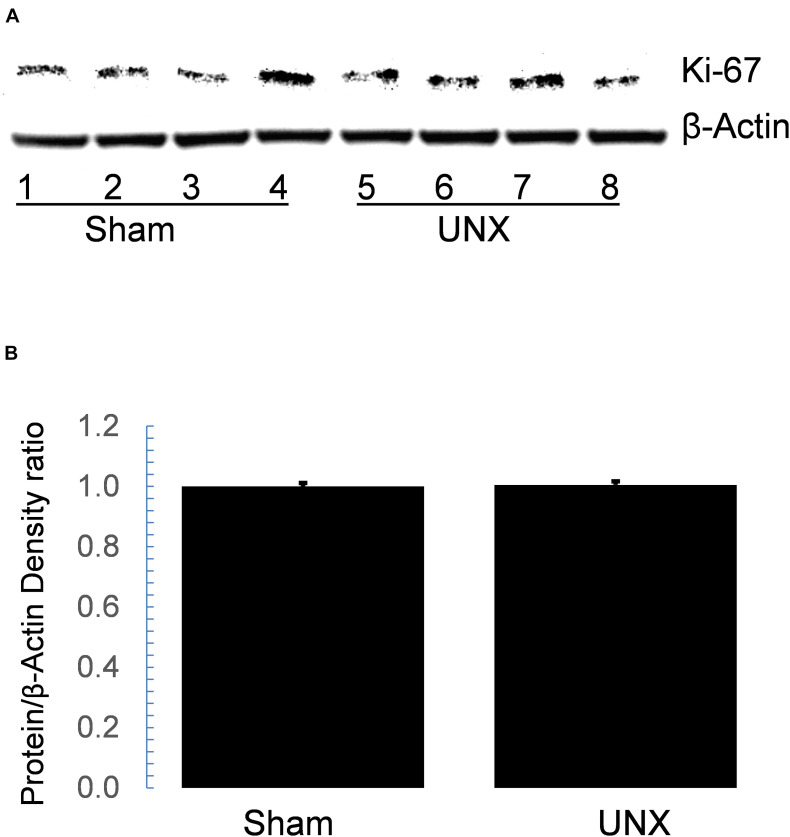
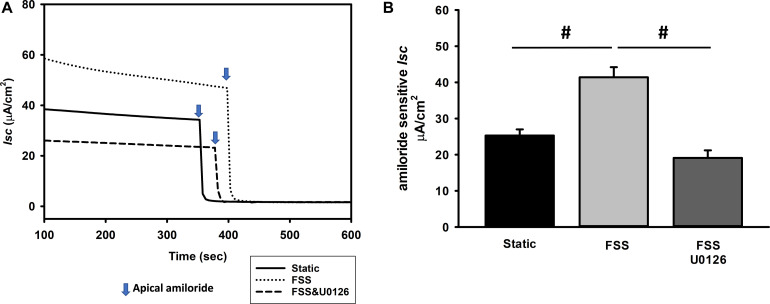
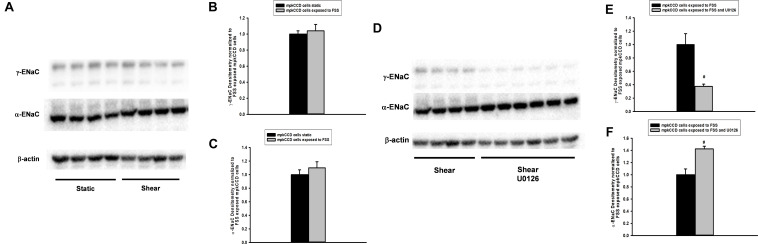
Nephron loss initiates compensatory hemodynamic and cellular effects on the remaining nephrons. Increases in single nephron glomerular filtration rate and tubular flow rate exert higher fluid shear stress (FSS) on tubules. In principal cell (PC) culture models FSS induces ERK, and ERK is implicated in the regulation of transepithelial sodium (Na) transport, as well as, proliferation. Thus, we hypothesize that high tubular flow and FSS mediate ERK activation in the cortical collecting duct (CCD) of solitary kidney which regulates amiloride sensitive Na transport and affects CCD cell number. Immunoblotting of whole kidney protein lysate was performed to determine phospho-ERK (pERK) expression. Next, sham and unilateral nephrectomized mice were stained with anti-pERK antibodies, and dolichos biflorus agglutinin (DBA) to identify PCs with pERK. Murine PCs (mpkCCD) were grown on semi-permeable supports under static, FSS, and FSS with U0126 (a MEK1/2 inhibitor) conditions to measure the effects of FSS and ERK inhibition on amiloride sensitive Na short circuit current (Isc). pERK abundance was greater in kidney lysate of unilateral vs. sham nephrectomies. The total number of cells in CCD and pERK positive PCs increased in nephrectomized mice (9.3 ± 0.4 vs. 6.1 ± 0.2 and 5.1 ± 0.5 vs. 3.6 ± 0.3 cell per CCD nephrectomy vs. sham, respectively, n > 6 per group, p < 0.05). However, Ki67, a marker of proliferation, did not differ by immunoblot or immunohistochemistry in nephrectomy samples at 1 month compared to sham. Next, amiloride sensitive Isc in static mpkCCD cells was 25.3 ± 1.7 μA/cm2 (n = 21), but after exposure to 24 h of FSS the Isc increased to 41.4 ± 2.8 μA/cm2 (n = 22; p < 0.01) and returned to 19.1 ± 2.1 μA/cm2 (n = 18, p < 0.01) upon treatment with U0126. Though FSS did not alter α- or γ-ENaC expression in mpkCCD cells, γ-ENaC was reduced in U0126 treated cells. In conclusion, pERK increases in whole kidney and, specifically, CCD cells after nephrectomy, but pERK was not associated with active proliferation at 1-month post-nephrectomy. In vitro studies suggest high tubular flow induces ERK dependent ENaC Na absorption and may play a critical role in Na balance post-nephrectomy.

Keywords: cortical collecting duct; electrophysiology; mitogen activated protein kinase; nephrectomy; sodium transport.


Conflict of interest statement

The authors declare that the research was conducted in the absence of any commercial or financial relationships that could be construed as a potential conflict of interest.

Figures

FIGURE 1
FIGURE 1
Phospho-ERK abundance in whole kidney protein lysate from sham and unilateral nephrectomy (UNX). (A) Western blot of sham (n = 4) and unilateral nephrectomy kidney (n = 4) shows an increase in steady state abundance of pERK in kidney unilateral nephrectomy. (B) Densitometric analysis demonstrates a significant increase of pERK in solitary kidney vs. sham (*, p < 0.001).
FIGURE 2
FIGURE 2
Immunohistochemical pERK staining in murine kidney of sham (A) and solitary kidney (B) and dual immunofluorescence staining of pERK (GREEN) and DBA (RED) in sham (C) and unilateral nephrectomy (D). The black arrows identify the cells staining for pERK in the kidneys of sham (A) and after nephrectomy (B). Based on the morphology of pERK expressing cells, most of the staining localizes to the distal nephron in the cortex. To identify the tubular segment staining for pERK, sham (C) and nephrectomy (D) kidney samples were stained with DBA, to identify principal cells, and anti-pERK antibody. The white arrows identify areas of co-localization of DBA and pERK fluorescent signal.
FIGURE 3
FIGURE 3
Cortical collecting duct (CCD) diameter is greater in nephrectomized (□) kidneys compared to sham (■) controls. The diameter of CCDs of nephrectomized mice (n = 7) increased by approximately 50% compared to sham (n = 6) controls (#, p < 0.05 compared to sham).
FIGURE 4
FIGURE 4
The CCDs of nephrectomy kidney specimens (n = 7) contain an absolute increase in number of cells (A), DBA positive and negative cells (B), and pERK expressing cells (C) than sham (n = 6) controls. The kidneys of mice that received nephrectomy 4 weeks prior to euthanasia contained more cells in the CCD than sham controls (A). A significant increase in DBA negative cells was noted in the nephrectomized mice vs. sham controls (B, ANOVA, #, p < 0.05) while a trend to increased DBA positive cells was observed in nephrectomized mice (@; p = 0.0588). The number of cells that express pERK in the CCD (C) was greater nephrectomy specimens than sham (ANOVA, #, p < 0.05) but no increase in the number of pERK negative cells in CCD of nephrectomy specimens was noted.
FIGURE 5
FIGURE 5
No difference in pERK expression was seen in DBA positive or negative cells between sham (n = 6) and nephrectomized (n = 7) mice (A) and ratio pERK expression in each cell type was unchanged (B). Though overall pERK expression was greater in CCDs of nephrectomized mice, pERK expression in DBA positive or negative cells did not differ in sham compared to nephrectomized mice (A); however, the overall expression of pERK was less in DBA negative compared to positive cells (ANOVA, #; p < 0.05 compared to the DBA positive cells in sham or nephrectomy). Also the percent of pERK expression in DBA positive or negative cells did not change based on the sham or nephrectomy status of the CCD (B); however, the percent of pERK expression in DBA negative cell was consistently less than DBA positive cell regardless of sham or nephrectomy status (ANOVA, #; p < 0.05 compared to the DBA positive cells in sham or nephrectomy).
FIGURE 6
FIGURE 6
Western blot of Ki67 in whole cell protein lysate did not differ between sham and unilateral nephrectomy (UNX). Steady state abundance of Ki67 protein on immunoblot (A) of whole kidney lysate from sham (n = 4) and unilateral nephrectomy (n = 4) did not differ (B).
FIGURE 7
FIGURE 7
Amiloride sensitive Isc is stimulated by an ERK dependent mechanism as demonstrated in a single experiment (A) and the composite data (B). MpkCCD cells were exposed either to static, FSS, or FSS with 10 μM U0126 (A). After the Isc stabilized, 10 μM amiloride was administered to the apical compartment and the difference in Isc before and after amiloride measured. Amiloride Isc increased in cells exposed to 0.4 dynes/cm2 of FSS (#, p < 0.05) compared to static cells and this response was suppressed by U0126 (#, p < 0.05) compared to FSS alone.
FIGURE 8
FIGURE 8
Fluid shear stress (FSS) does not alter abundance of α- or γ-ENaC in whole cell protein lysate (A–C), but treatment with U0126 reduces γ-ENaC and raises α-ENaC expression (D–F). MpkCCD cells grown in plastic plates were either exposed to static (n = 8) conditions or FSS of 0.4 dynes/cm2 for 24 h (n = 9) and then whole cell protein isolated. Immunoblotting (A) showed that γ- and α-ENaC subunit (B,C) expression was unaffected by FSS. On the other hand, steady state γ-ENaC protein expression was reduced in FSS and U0126 (n = 6; #, p < 0.05) exposed mpkCCD cells compared shear (n = 4) controls (D,E); however, α-ENaC expression increased in the same FSS and U0126 treated cells (D,F).

Similar articles

Cited by

References

    1. Beer D. G., Zweifel K. A., Simpson D. P., Pitot H. C. (1987). Specific gene expression during compensatory renal hypertrophy in the rat. J. Cell Physiol. 131 29–35. 10.1002/jcp.1041310106 - DOI - PubMed
    1. Carattino M. D., Sheng S., Kleyman T. R. (2004). Epithelial Na+ channels are activated by laminar shear stress. J. Biol. Chem. 279 4120–4126. 10.1074/jbc.m311783200 - DOI - PubMed
    1. Carrisoza-Gaytan R., Liu Y., Flores D., Else C., Lee H. G., Rhodes G., et al. (2014). Effects of biomechanical forces on signaling in the cortical collecting duct (CCD). Am. J. Physiol. Renal Physiol. 307 F195–F204. - PMC - PubMed
    1. Cortell S., Gennari F. J., Davidman M., Bossert W. H., Schwartz W. B. (1973). A definition of proximal and distal tubular compliance. Practical and theoretical implications. J. Clin. Invest. 52 2330–2339. 10.1172/jci107422 - DOI - PMC - PubMed
    1. Diezi J., Michoud P., Grandchamp A., Giebisch G. (1976). Effects of nephrectomy on renal salt and water transport in the remaining kidney. Kidney Int. 10 450–462. 10.1038/ki.1976.132 - DOI - PubMed

LinkOut - more resources