. 2021 Feb 9:12:590638.
doi: 10.3389/fphys.2021.590638. eCollection 2021.

Serum Metabolomic Profiling to Reveal Potential Biomarkers for the Diagnosis of Fatty Liver Hemorrhagic Syndrome in Laying Hens

Affiliations

Serum Metabolomic Profiling to Reveal Potential Biomarkers for the Diagnosis of Fatty Liver Hemorrhagic Syndrome in Laying Hens

Lianying Guo et al. Front Physiol. .

Abstract

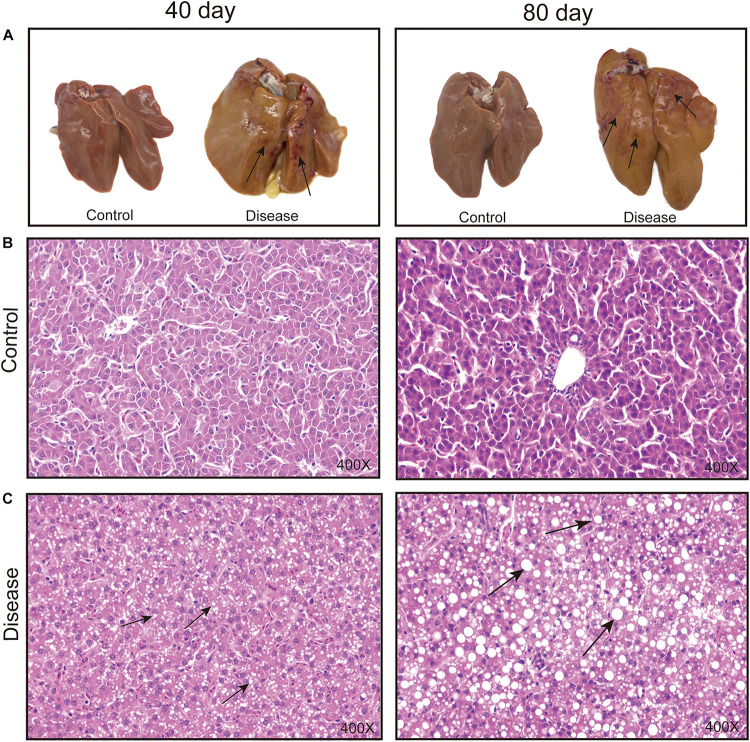
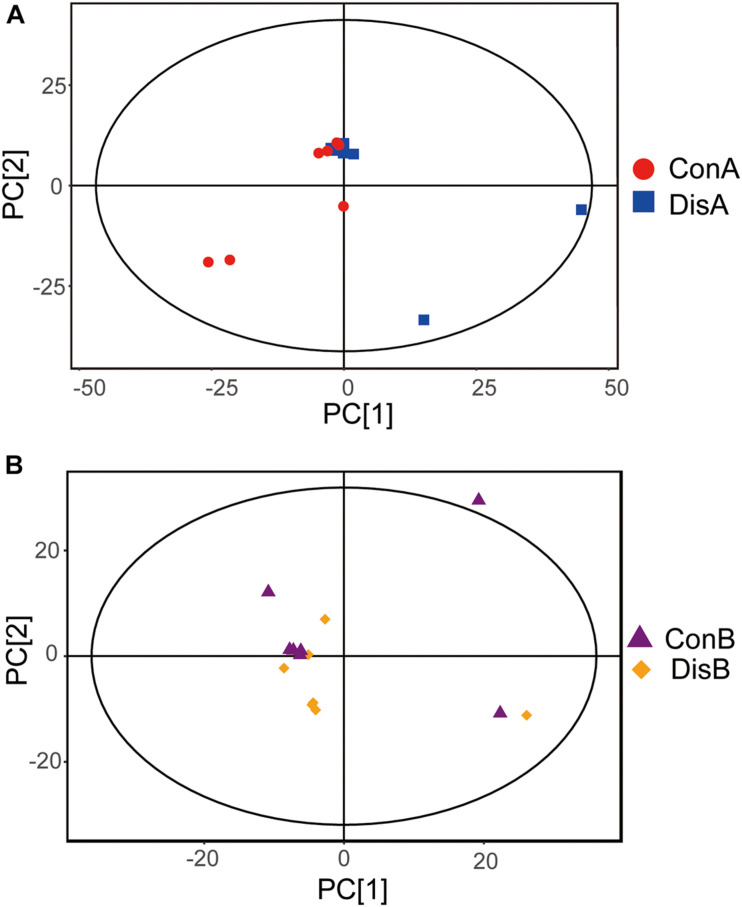
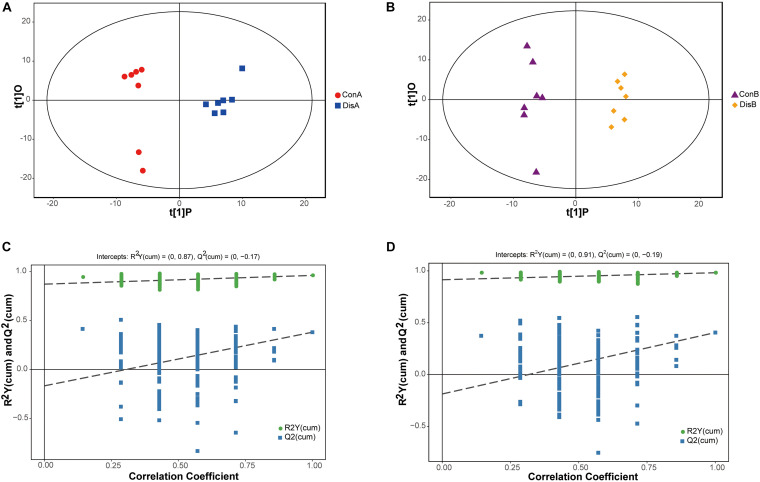
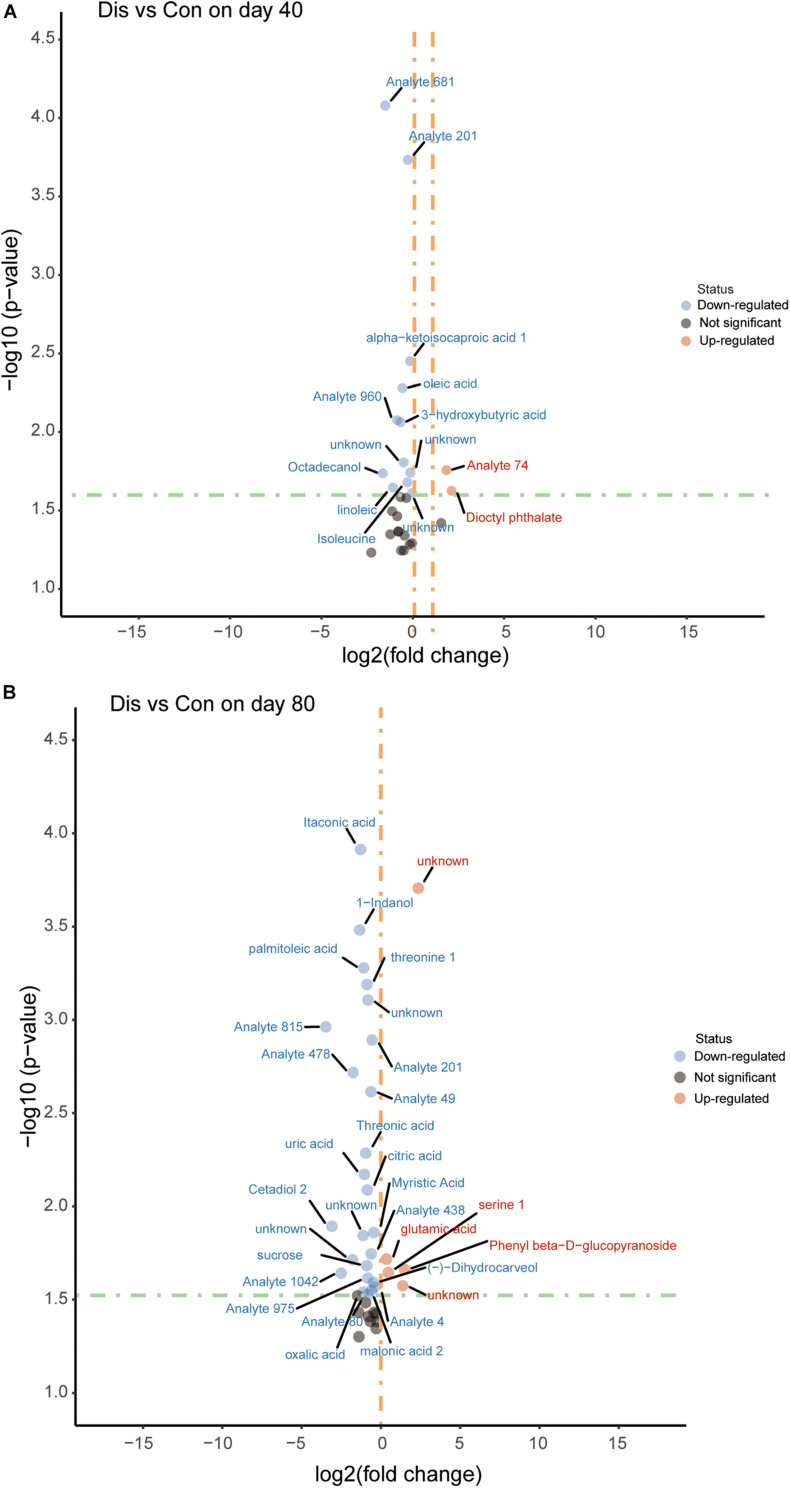
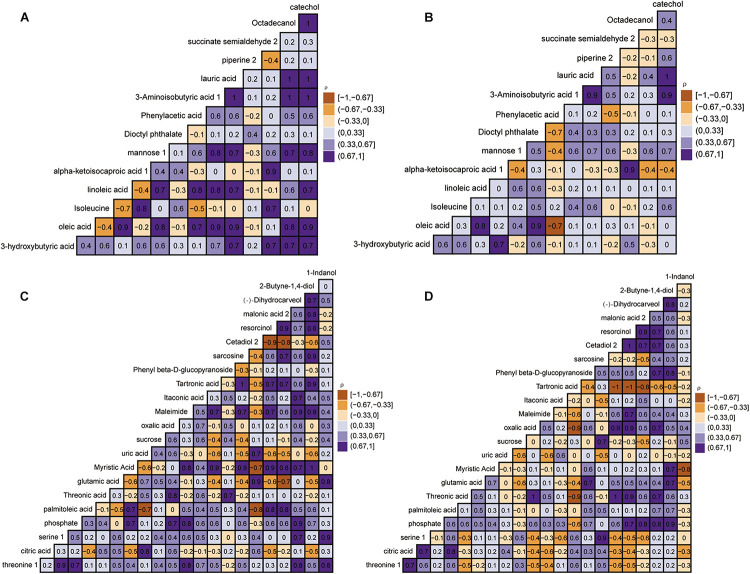
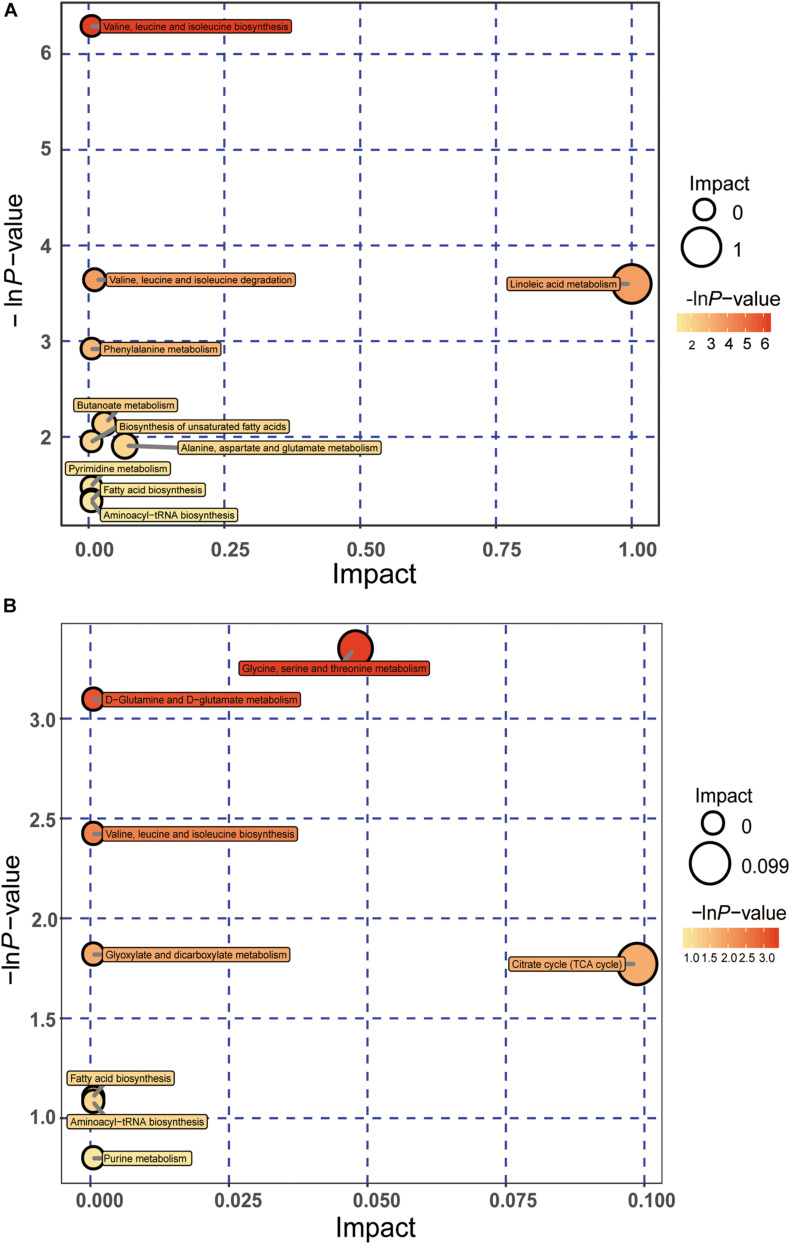
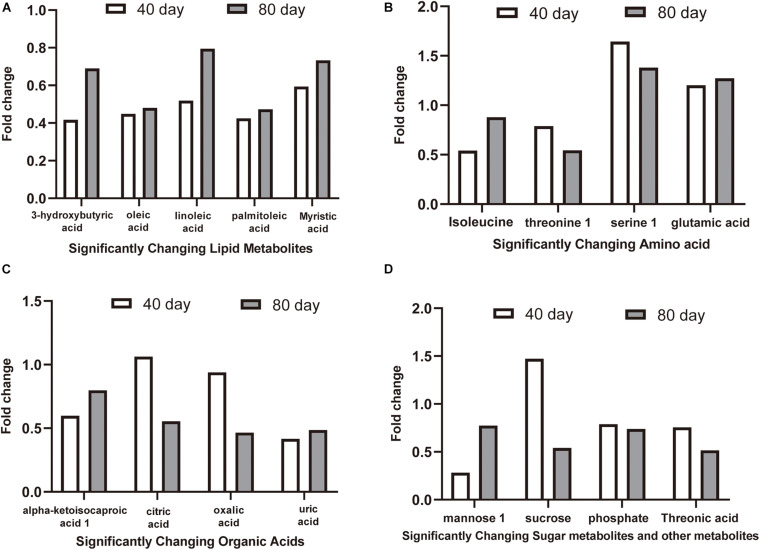
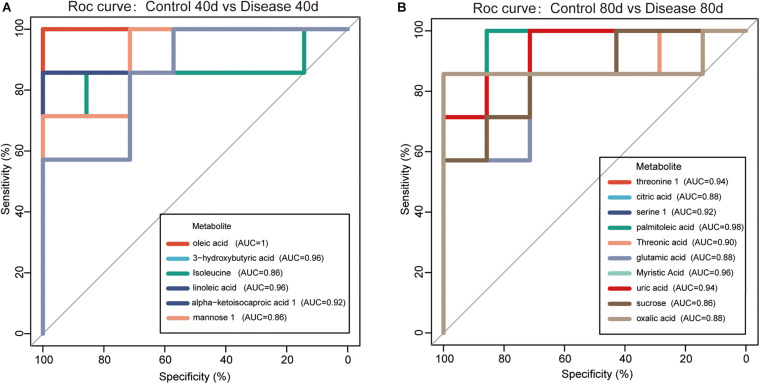
Fatty liver hemorrhage syndrome (FLHS), a nutritional and metabolic disease that frequently occurs in laying hens, causes serious losses to the poultry industry. Nowadays, the traditional clinical diagnosis of FLHS still has its limitations. Therefore, searching for some metabolic biomarkers and elucidating the metabolic pathway in vivo are useful for the diagnosis and prevention of FLHS. In the present study, a model of FLHS in laying hens induced by feeding a high-energy, low-protein diet was established. Gas chromatography time-of-flight mass spectrometry (GC-TOF-MS) was used to analyze the metabolites in serum at days 40 and 80. The result showed that, in total, 40 differential metabolites closely related to the occurrence and development of FLHS were screened and identified, which were mainly associated with lipid metabolism, amino acid metabolism, and energy metabolism pathway disorders. Further investigation of differential metabolites showed 10 potential biomarkers such as 3-hydroxybutyric acid, oleic acid, palmitoleic acid, and glutamate were possessed of high diagnostic values by analyzing receiver operating characteristic (ROC) curves. In conclusion, this study showed that the metabolomic method based on GC-TOF-MS can be used in the clinical diagnosis of FLHS in laying hens and provide potential biomarkers for early risk evaluation of FLHS and further insights into FLHS development.

Keywords: biomarkers; diagnosis; fatty liver hemorrhage syndrome; gas chromatography time-of-flight mass spectrometry; metabolomics; serum.


Conflict of interest statement

The authors declare that the research was conducted in the absence of any commercial or financial relationships that could be construed as a potential conflict of interest.

Figures

FIGURE 1
FIGURE 1
Effects of a high-energy, low-protein diet on hepatic tissue pathological change at different time points after induction. (A) Liver morphology alteration. The black arrowhead shows the bleeding spots and bleeding areas. (B,C) Histopathological changes in the liver of laying hens fed a high-energy, low-protein diet for 40 and 80 days (H&E staining). The black arrowhead shows the fat droplets.
FIGURE 2
FIGURE 2
Principal component analysis (PCA) plots based on the gas chromatography time-of-flight mass spectrometry (GC-TOF-MS) analyses of serum samples from the control and disease groups laying hens after (A) 40 and (B) 80 days of feeding.
FIGURE 3
FIGURE 3
Orthogonal partial least-squares discriminant analysis (OPLS-DA) score plots (A,B) and corresponding validation plots of the permutation tests (200 times) of the OPLS-DA models (C,D). Panels (A,C) are for 40 days, and panels (B,D) are for 80 days.
FIGURE 4
FIGURE 4
Volcano plot of serum metabolites for the disease group and the control group at days 40 (A) and 80 (B). The x-axis represents log2 [fold change (FC)] value, and the y-axis means –log10 (P value). The red dots indicate that the metabolite is more abundant in the disease group, whereas blue dots indicate significantly lower metabolites compared to the control group.
FIGURE 5
FIGURE 5
Heat map based on Pearson’s correlations between metabolites in the control group and disease group by gas chromatography time-of-flight mass spectrometry (GC-TOF-MS) analysis. The color scale represents Pearson’s correlation coefficients, with brown-yellow and purple representing negative and positive correlations, respectively. The control group at days 40 and 80 (A,C). Disease group at days 40 and 80 (B,D).
FIGURE 6
FIGURE 6
Pathway analyses of significantly differential metabolites using MetaboAnalyst, as shown in bubble plots. Bubble size is proportional to the impact of each pathway, and bubble color represents the degree of significance, from the highest (red) to the lowest (white). Panels (A,B) represent bubble plots enriched for metabolic pathways at days 40 and 80, respectively.
FIGURE 7
FIGURE 7
The fold change (FC) of candidate biomarkers at day 40 and day 80. FC > 1.00 indicates that the concentration of metabolites in the disease group is higher than that in the control group, and FC < 1.00 indicates that the metabolite concentration in the disease group is lower than that in the control group. (A) significantly changing lipid metabolites, (B) significantly changing amino acid metabolites, (C) significantly changing organic acids metabolites, (D) significantly changing sugar metabolites and other metabolites.
FIGURE 8
FIGURE 8
Receiver operating characteristic (ROC) curves for the diagnosis of fatty liver hemorrhage syndrome (FLHS) according to the candidate biomarkers (significant differential metabolites with similarity >700) in serum (A) at days 40 and (B) 80. The potential biomarkers were selected based on the criterion that area under the curve (AUC) values were higher than 0.9.

Similar articles

Cited by

References

    1. An Y., Xu W., Li H., Lei H., Zhang L., Hao F., et al. (2013). High-fat diet induces dynamic metabolic alterations in multiple biological matrices of rats. J. Proteome Res. 12 3755–3768. 10.1021/pr400398b - DOI - PubMed
    1. Arrol S., Mackness M. I., Durrington P. N. (2000). The effects of fatty acids on apolipoprotein B secretion by human hepatoma cells (HEP G2). Atherosclerosis 150 255–264. 10.1016/s0021-9150(99)00374-3 - DOI - PubMed
    1. Bui D., Ravasz D., Chinopoulos C. (2019). The effect of 2-ketobutyrate on mitochondrial substrate-level phosphorylation. Neurochem. Res. 44 2301–2306. 10.1007/s11064-019-02759-8 - DOI - PMC - PubMed
    1. Butler E. J. (1976). Fatty liver diseases in the domestic fowl–a review. Avian Pathol. 5 1–14. 10.1080/03079457608418164 - DOI - PubMed
    1. Chang C., Guo Z. G., He B., Yao W. Z. (2015). Metabolic alterations in the sera of Chinese patients with mild persistent asthma: a GC-MS-based metabolomics analysis. Acta Pharmacol. Sin. 36 1356–1366. 10.1038/aps.2015.102 - DOI - PMC - PubMed

LinkOut - more resources