Clinical Trial
. 2021 Feb 3:11:498703.
doi: 10.3389/fimmu.2020.498703. eCollection 2020.

Interferon α Enhances B Cell Activation Associated With FOXM1 Induction: Potential Novel Therapeutic Strategy for Targeting the Plasmablasts of Systemic Lupus Erythematosus

Affiliations
Clinical Trial

Interferon α Enhances B Cell Activation Associated With FOXM1 Induction: Potential Novel Therapeutic Strategy for Targeting the Plasmablasts of Systemic Lupus Erythematosus

Kanae Akita et al. Front Immunol. .

Abstract

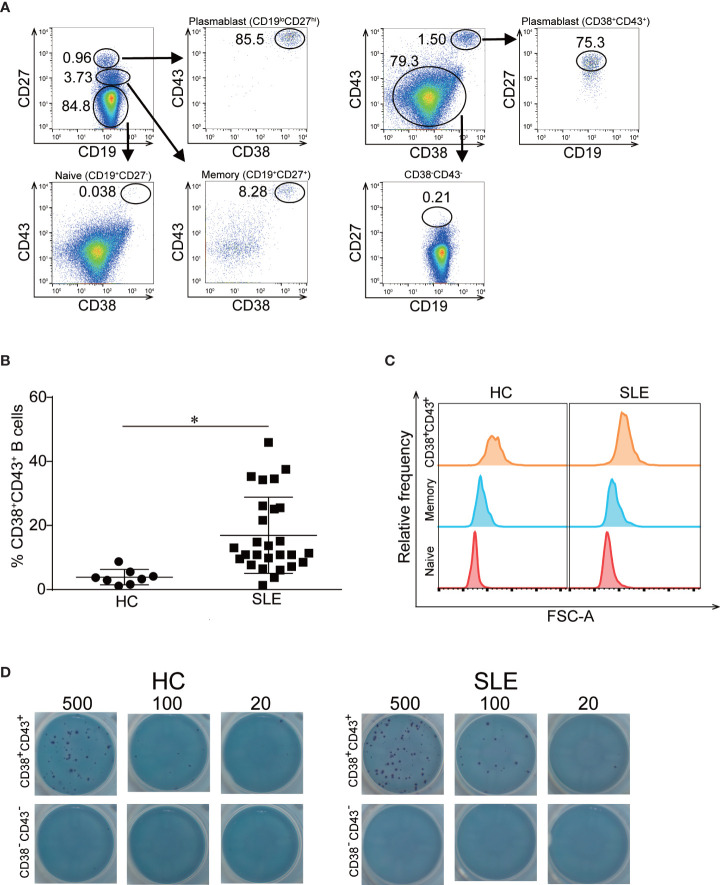
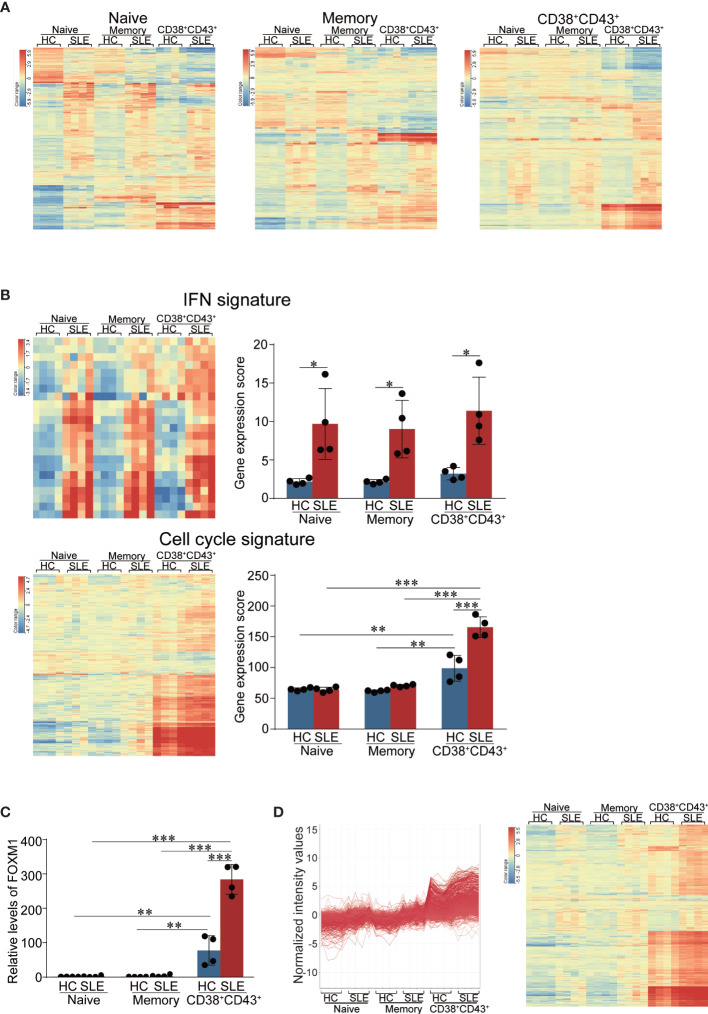
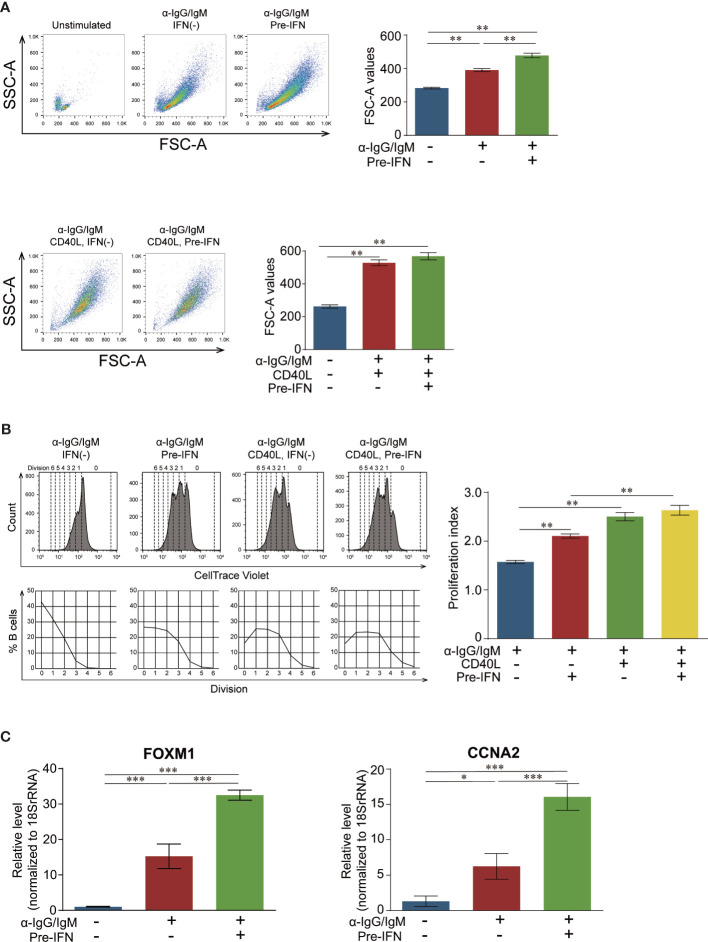
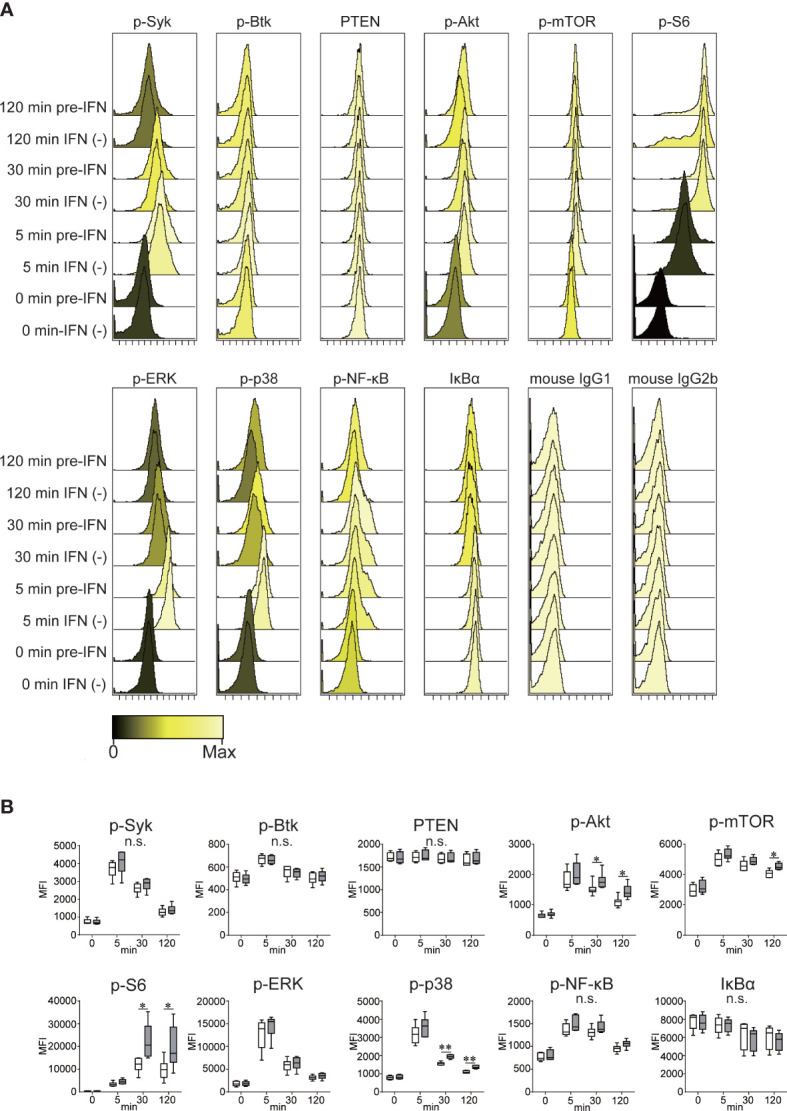
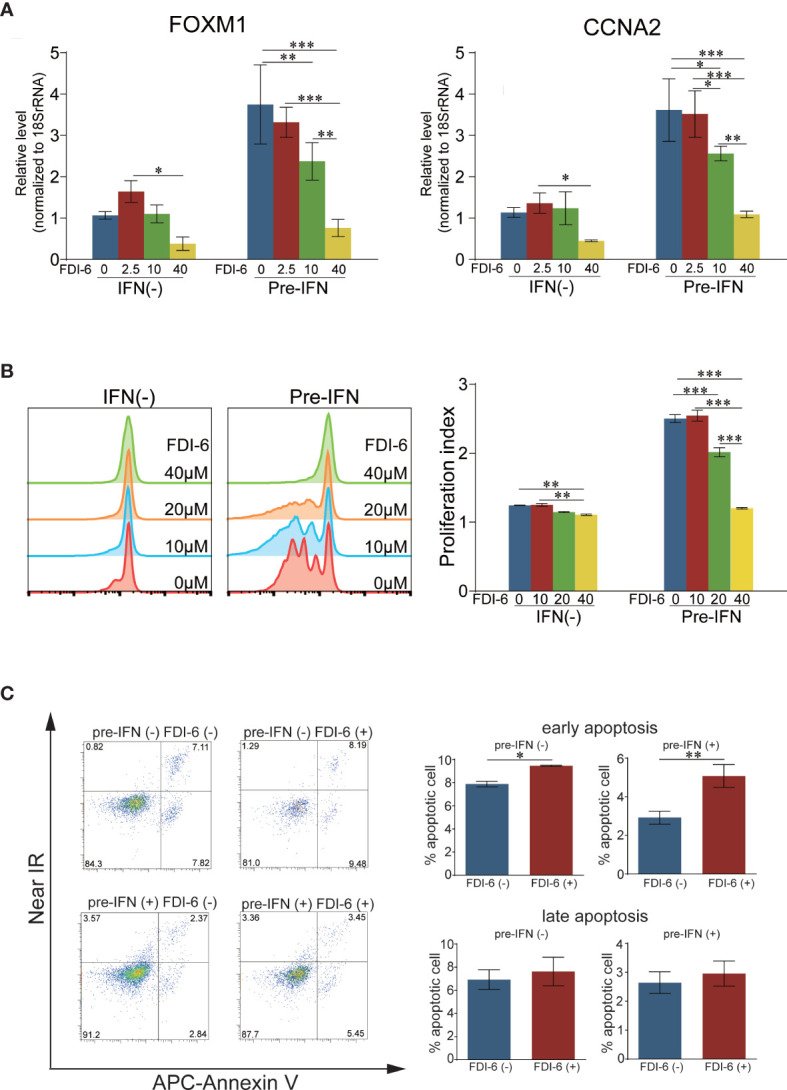
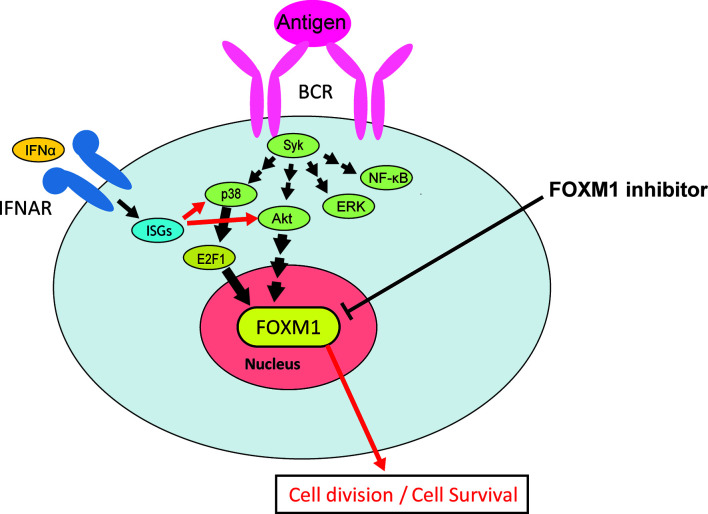
Systemic lupus erythematosus (SLE) is an autoimmune disease. It is characterized by the production of various pathogenic autoantibodies and is suggested to be triggered by increased type I interferon (IFN) signature. Previous studies have identified increased plasmablasts in the peripheral blood of SLE patients. The biological characteristics of SLE plasmablasts remain unknown, and few treatments that target SLE plasmablasts have been applied despite the unique cellular properties of plasmablasts compared with other B cell subsets and plasma cells. We conducted microarray analysis of naïve and memory B cells and plasmablasts (CD38+CD43+ B cells) that were freshly isolated from healthy controls and active SLE (n = 4, each) to clarify the unique biological properties of SLE plasmablasts. The results revealed that all B cell subsets of SLE expressed more type I IFN-stimulated genes. In addition, SLE plasmablasts upregulated the expression of cell cycle-related genes associated with higher FOXM1 and FOXM1-regulated gene expression levels than that in healthy controls. This suggests that a causative relationship exists between type I IFN priming and enhanced proliferative capacity through FOXM1. The effects of pretreatment of IFNα on B cell activation and FOXM1 inhibitor FDI-6 on B cell proliferation and survival were investigated. Pretreatment with IFNα promoted B cell activation after stimulation with anti-IgG/IgM antibody. Flow cytometry revealed that pretreatment with IFNα preferentially enhanced the Atk and p38 pathways after triggering B cell receptors. FDI-6 inhibited cell division and induced apoptosis in activated B cells. These effects were pronounced in activated B cells pretreated with interferon α. This study can provide better understanding of the pathogenic mechanism of interferon-stimulated genes on SLE B cells and an insight into the development of novel therapeutic strategies.

Keywords: B cell; FOXM1; interferon α; plasmablast; systemic lupus erythematosus.


Conflict of interest statement

The authors declare that the research was conducted in the absence of any commercial or financial relationships that could be construed as a potential conflict of interest.

Figures

Figure 1
Figure 1
Validation of CD38+CD43+ B cells as plasmablasts. (A) Consistency in B cell surface markers. PBMCs from a healthy control (HC) were labeled with fluochrome-tagged antibodies to CD3, CD14, CD16, CD19, CD27, CD38, and CD43. After gating CD3CD14CD16 cells, CD19loCD27hi B cells or CD38+CD43+ B cells were gated and the consistency of these two subsets were analyzed. (B) Percentage of CD38+CD43+ cells among CD19+ B cells in HC and active SLE patients. PBMCs from HC (n = 8) and active SLE with SLEDAI ≥6 (n = 27) were isolated and evaluated the percentage of CD38+CD43+ B cells in CD19 gated cells. The error bars represent SD. Statistical analysis was performed with unpaired t-test. *p < 0.01. (C) Cell size of B cell subsets. The intensity value of FSC-A is displayed as histograms in naïve B cells, memory B cells and CD38+CD43+ B cells from a healthy donor (left) and a SLE patient (right). Data in (A, C) are representative data from three independent donors, each. (D) ELISPOT analysis evaluating antibody secreting capacity of isolated B cells. CD38+CD43+ B cells and CD38CD43 B cells were isolated with flowcytometry. Each B cell subset with cell number indicated was incubated on membranes coated with anti-human IgG antibody in RPMI1640 containing 10% FBS. After 24 h incubation and washing, spots were developed.
Figure 2
Figure 2
The correlation of DEGs in CD38+CD43+ B cells of SLE with the canonical pathways related to cell cycle as well as type I IFN. (A) DEGs of SLE patients compared with healthy donors in each B cell subset. The heatmap represents the DEGs of each B cell subset (naïve, memory, and CD38+CD43+ B cells) of SLE patients compared with healthy donors. Significantly upregulated (>twofold) and downregulated (<0.5-fold) genes were shown after hierarchical clustering analysis. Statistical analysis was conducted via moderate t-test using the GeneSpring software. (B) The gene expression score of type I IFN signature and cell cycle signature in each B cell subset. IFN signature genes (23 genes) (23) (upper) and cell cycle signature genes (231 genes) (24) (lower) were selected as representative genes for each pathway. The heatmap represents the gene expression levels of type I IFN signatures and cell cycle signatures in each B cell subset (left). After the expression levels of IFN signature were normalized to be 1 for the maximum value in any gene row, the sum of the values of each B cell subset in healthy donors and SLE patients was obtained to calculate the gene expression levels and scored (right). The error bars represent SD. (C) FOXM1 gene expression level in each B cell subset. FOXM1 expression was assessed in naïve, memory, and CD38+CD43+ B cells between healthy donors and SLE patients. Gene expression was normalized to be 1 for the minimum value in any B cell subset. The error bars represent SD. (B, C) Statistical analysis was conducted via one-way ANOVA using Tukey’s multiple comparison test.*p < 0.05, **p < 0.01, and ***p < 0.001. Data were obtained from four independent healthy donors and four independent active SLE patients. (D) Genes exhibiting similar expression patterns to FOXM1. Among DEGs in CD38+CD43+ B cells, “find similar entities” analysis with a correlation cut-off range of 0.6 ≤ r ≤ 1.0 resulted in the selection of 725 genes. Histogram (left) and heatmap (right) show the gene expression levels in each B cell subset.
Figure 3
Figure 3
Enhanced B cell stimulation with pre-IFN. (A) Effects of pre-IFN on B cell enlargement after stimulation with anti-IgG/IgM antibody and CD40L. Isolated B cells from a healthy donor were stimulated with α-IgG/IgM (50 µg/ml) with or without IFNα (1,000 U/ml) or CD40L (100 ng/ml) pretreatment. Cell size was measured through FSC-A intensity and analyzed 3 d after the start of the culture. The geometric mean of FSC-A is presented in each cultured B cell. (B) The effects of pre-IFN on B cell division after stimulation with anti-IgG/IgM antibody and CD40L. Peripheral B cells from a healthy donor were labeled using CellTrace Violet Cell Proliferation Kit and stimulated with α-IgG/IgM (50 µg/ml) with or without pre-IFN (1,000 U/ml) or CD40L (100 ng/ml). Cell division was analyzed via flow cytometry 6 d after the beginning of the culture. Left: Cell division is presented as histograms, and the number of cell divisions is indicated above the histograms (upper). B cell percentages in each generation are plotted on a chart (lower). Right: Proliferation indices (PI) were calculated in each stimulated B cell. (C) The effects of pre-IFN on FOXM1 and CCNA2 gene induction after stimulation with anti-IgG/IgM antibody. Isolated B cells from a healthy donor were stimulated with α-IgG/IgM (50 µg/ml) with or without IFNα (1,000 U/ml). For pre-IFN, IFNα was added 6 h before stimulation with anti-IgG/IgM antibody. After 2 d, the expression levels of FOXM1 and CCNA2 were quantitated via RT-PCR. The error bars represent SEM. Each expression level of FOXM1 and CCNA2 was standardized by each corresponding expression level of 18s rRNA, and the standardized expression levels of unstimulated B cells on day 0 were regarded as 1. The error bars represent SD. Data are representative of experiments from three independent donors. Statistical analysis was conducted via one-way ANOVA using Tukey’s multiple comparison test. *p < 0.05, **p < 0.01, and ***p < 0.001.
Figure 4
Figure 4
Enhanced BCR signaling pathways with pretreatment with IFNα. Isolated B cells from six healthy donors were stimulated with α-IgG/IgM with or without [IFN(−)] pre-IFN. Cells were harvested before stimulation (0 min) and 5, 30, and 120 min after stimulation with α-IgG/IgM antibody (50 µg/ml). After fixation and permeabilization, cells were stained with Alexa Fluor 647-labeled anti-PTEN, phosphoproteins (p-Syk, p-Btk, p-Akt, p-mTOR, p-S6, p-ERK, p-p38, and p-NF-κB), IkBα, mouse IgG1 isotype, and mouse IgG2b isotype. The expressions of these molecules were quantified via flow cytometry. (A) The histogram indicates the expression level of B cell signaling molecules at the indicated times after stimulation. Data in (A) are representative data from experiments of six independent donors. (B) Time kinetics of the expression levels of phosphorylated (except PTEN and IkBα) B cell signaling molecules after stimulation. Data of the mean fluorescence intensity (MFI) of each signaling molecule are presented as box plots (n = 6, each). Each box represents the 25th–75th percentile. Lines inside the boxes indicate the median. Whiskers represent the 10th–90th percentile. Comparisons between stimulation with (gray box) and without (white box) pre-IFN were statistically performed via an unpaired t-test. *p < 0.05, **p < 0.01, and n.s., not significant between IFN (−) and pre-IFN.
Figure 5
Figure 5
Effects of FDI-6 on cell division and apoptosis in activated B cells through BCR stimulation. (A) The effects of FDI-6 on FOXM1 and CCNA2 expression in stimulated B cells. Isolated B cells from a healthy donor were stimulated with α-IgG/IgM (50 µg/ml) with or without pre-IFN (1,000 U/ml). The addition of DMSO or FDI-6 (2.5, 10, or 40 µM) was performed 2 d after the start of the culture, and each cultured B cell was harvested 24 h (3 d after the start of the culture) after the addition of DMSO or FDI-6. The expressions of FOXM1 and CCNA2 were quantitated via RT-PCR. Each expression level of FOXM1 and CCNA2 was standardized by each corresponding expression level of 18s rRNA, and the standardized expression levels of non-IFNα-treated B cells without FDI-6 were regarded as 1. (B) The effects of FDI-6 on cell division of activated B cells. Isolated B cells from a healthy donor were labeled using CellTrace Violet Cell Proliferation Kit and stimulated with α-IgG/IgM (50 µg/ml) with or without pre-IFN (1,000 U/ml). DMSO or FDI-6 (10, 20, or 40 µM) was added 2 d after the start of the culture, and cell division was analyzed via flow cytometry 5 d after stimulation with anti-α-IgG/IgM. Cell division is presented as histograms (left). PI was calculated in each stimulated B cell. (C) Peripheral B cells from a healthy donor were stimulated with α-IgG/IgM (50 µg/ml) with or without pre-IFN (1,000 U/ml), and DMSO or FDI-6 (40 µM) was added 2 d after the start of the culture. In dot plots, cultured B cells were stained with APC-Annexin V and Near IR 24 h after the addition of DMSO or FDI-6, and cells were analyzed via flow cytometry (left). Annexin V+ Near IR- B cells and Annexin V+ Near IR+ are defined as early and late apoptotic cells, respectively. The frequency of apoptotic B cells as a percentage of the overall B cells is presented in each cultured B cell (right). The error bars represent SD. Statistical analysis was conducted via one-way ANOVA using Tukey’s multiple comparison test (B) and student t-test (C). *p < 0.05, **p < 0.01, and ***p < 0.001.
Figure 6
Figure 6
The effects of pretreatment of type I IFN on B cell stimulation, and the potential of FOXM1 inhibitor as a novel plasmablast-targeting therapy in SLE. Resting B cells (e.g., naïve and memory B cells) were pretreated with type I IFN in an antigen non-specific manner, and ISGs were induced. After the stimulation of high-ISG-expressing B cells with BCR triggering, a particular gene (or genes) in the ISGs selectively enhanced the activation of the Akt and p38 pathways, which resulted in greater FOXM1 induction. FOXM1 inhibitor may have more anti-proliferative and cytotoxic effects on type I IFN pretreated activated B cells (e.g., SLE plasmablasts).

Similar articles

Cited by

References

    1. Tsokos GC. Systemic lupus erythematosus. N Engl J Med (2011) 365:2110–21. 10.1056/NEJMra1100359 - DOI - PubMed
    1. Bennett L, Palucka AK, Arce E, Cantrell V, Borvak J, Banchereau J, et al. Interferon and granulopoiesis signatures in systemic lupus erythematosus blood. J Exp Med (2003) 197:711–23. 10.1084/jem.20021553 - DOI - PMC - PubMed
    1. Baechler EC, Batliwalla FM, Karypis G, Gaffney PM, Ortmann WA, Espe KJ, et al. Interferon-inducible gene expression signature in peripheral blood cells of patients with severe lupus. Proc Natl Acad Sci USA (2003) 100:2610–5. 10.1073/pnas.0337679100 - DOI - PMC - PubMed
    1. Jego G, Palucka AK, Blanck J-P, Chalouni C, Pascual V, Banchereau J. Plasmacytoid Dendritic Cells Induce Plasma Cell Differentiation through Type I Interferon and Interleukin 6. Immunity (2003) 19:225–34. 10.1016/S1074-7613(03)00208-5 - DOI - PubMed
    1. Ronnblom L, Alm GV. An etiopathogenic role for the type I IFN system in SLE. Trends Immunol (2001) 22:427–31. 10.1016/S1471-4906(01)01955-X - DOI - PubMed

Publication types

MeSH terms