. 2021 Feb 1:11:594594.
doi: 10.3389/fimmu.2020.594594. eCollection 2020.

Transcriptomic Analysis of Rat Macrophages

Affiliations

Transcriptomic Analysis of Rat Macrophages

Clare Pridans et al. Front Immunol. .

Abstract

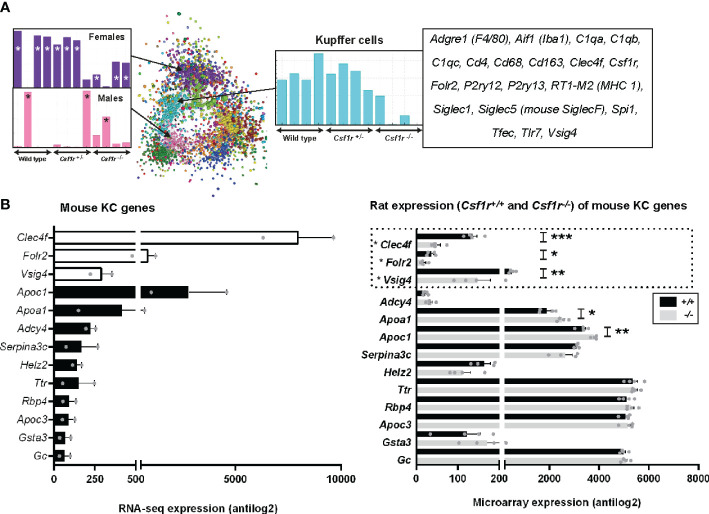
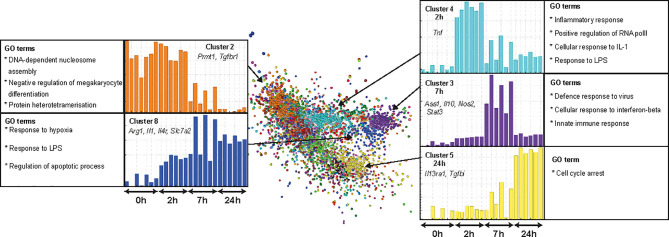
The laboratory rat is widely used as a model for human diseases. Many of these diseases involve monocytes and tissue macrophages in different states of activation. Whilst methods for in vitro differentiation of mouse macrophages from embryonic stem cells (ESC) and bone marrow (BM) are well established, these are lacking for the rat. The gene expression profiles of rat macrophages have also not been characterised to the same extent as mouse. We have established the methodology for production of rat ESC-derived macrophages and compared their gene expression profiles to macrophages obtained from the lung and peritoneal cavity and those differentiated from BM and blood monocytes. We determined the gene signature of Kupffer cells in the liver using rats deficient in macrophage colony stimulating factor receptor (CSF1R). We also examined the response of BM-derived macrophages to lipopolysaccharide (LPS). The results indicate that many, but not all, tissue-specific adaptations observed in mice are conserved in the rat. Importantly, we show that unlike mice, rat macrophages express the CSF1R ligand, colony stimulating factor 1 (CSF1).

Keywords: Kupffer cell; colony-stimulating factor 1 receptor; lipopolysaccharide; macrophage; rat.


Conflict of interest statement

The authors declare that the research was conducted in the absence of any commercial or financial relationships that could be construed as a potential conflict of interest.

Figures

Figure 1
Figure 1
Generation and characterisation of rat embryonic stem cell derived macrophages. (A) Schematic diagram of rat embryonic stem cell (ESC)-derived macrophage differentiation. Confluent rat ESC are shown at day 0 (Clone DA5.2), embryoid bodies at day 7, and ESC-derived macrophages (ESDM) at day 25. Bars = 50, 100, and 50 µm, respectively. Images are representative of three repeat experiments, two replicates. (B) ESDM were cultured with or without (control) fluorescein labelled Zymosan A BioParticles. Images are representative of three repeat experiments, two replicates. Blue = nuclear DAPI staining. Bars = 10 µm. (C) Flow cytometry of permeabilized cells was used to assess purity of ESDM via CD68 expression. Quadrants were set using an isotype control. Dot plot is representative of three repeat experiments, two replicates.
Figure 2
Figure 2
Adult rat macrophage populations. (A) Macrophages were isolated from adult male Dark Agouti rats. Images are representative of cells isolated from 10 rats. Bars = 20 µm (AM) or 50 µm (BMDM, MDM, and PM). (B) Permeabilized macrophages were analysed by flow cytometry to assess purity via CD68 expression. Quadrants were set with isotype controls. Dot plots are representative of cells isolated from three rats. (C) Alveolar macrophages were cultured with or without (control) fluorescein labelled Zymosan A BioParticles and imaged with a Zeiss AxioVert. Images are representative of cells isolated from three rats. Bar = 50 µm. (D) Macrophages were cultured with or without (control) fluorescein labelled Zymosan A BioParticles and imaged with a Zeiss LSM 710 confocal. Images are representative of cells isolated from three rats. Bar = 10 µm. AM = alveolar macrophages, BMDM = bone marrow derived macrophages, MDM = monocyte derived macrophages, PM, peritoneal macrophages.
Figure 3
Figure 3
Comparison of rat macrophage gene expression in vitro. Microarray analysis was performed on in vitro cultured rat macrophages. (A) Hierarchical clustering of the top 5,000 differentially expressed genes sorted by false discovery rate (FDR; <0.009418). Three biological replicates were used for alveolar (AM), bone marrow-derived (BMDM), monocyte-derived (MDM) and peritoneal macrophages (PM), including technical replicates. Technical replicates were used ESC-derived macrophages (ESDM) obtained from a single ESC clone (DA5.2). (B) Graph shows the numbers of differential expressed genes for each of the rat macrophages. (C) Gene ontology-based gene sets that were enriched in each macrophage population compared to all the others were identified using Gene Set Enrichment Analysis.
Figure 4
Figure 4
Expression of rat macrophage genes. Microarray analysis was performed on in vitro cultured rat macrophages. Data were RMA-normalised and expression levels (antilog2) examined. (A) Expression of Csf1 in rat macrophages. (B) Expression of macrophage-specific genes encoding commonly-used surface markers including those for which there are no anti-rat antibodies. Graphs (A, B) show average + SEM. (C) The network graph generated by Graphia analysis in which genes are coloured by clusters of co-expression. Histograms show expression profiles of clusters that contained genes specific to each macrophage population. The genes listed encode cell surface proteins. AM = alveolar macrophages, BMDM = bone marrow derived macrophages, MDM = monocyte derived macrophages, PM = peritoneal macrophages, ESDM = embryonic stem cell derived macrophages. (D) Global enrichment of mouse macrophage AM and PM signature gene sets (5) in rat AM and PM identified by Gene Set Enrichment Analysis. Rat expression data are ranked according to differential expression in AM or PM compared to all other macrophage populations (indicated by red-blue bars), and the murine AM or PM genesets are mapped onto this profile (black bars) to determine enrichment score (green lines). NES = Normalised Enrichment Score. (E, F) The differentially expressed genes identified by Lavin and colleagues (44) were clustered using Graphia. The graphs show expression of genes identified in the mouse alveolar (AM) and peritoneal (PM) macrophage clusters. The genes represented by open bars were common to both mouse and rat AM clusters. Rat genes denoted with an asterisk (*) have provisional or model RefSeq status on the Rat Genome Database (rgd.mcw.edu). Graphs show mean + SEM.
Figure 5
Figure 5
Inferred gene expression profile of rat Kupffer cells. (A) Microarray analysis was performed on adult livers obtained from wild type, Csf1r+/- and Csf1r-/- rats (n = 4 per genotype). Data were RMA-normalised and analysed using Graphia. (A) The network graph generated by the Graphia analysis. Genes are coloured by clusters of co-expression. Expression profiles of clusters that contained genes specific to Kupffer cells (cluster 4), females (cluster 3) and males (cluster 7) are shown. (B) The differentially expressed genes identified by Lavin and colleagues (44) were clustered using Graphia. The graphs show expression of genes identified in the mouse Kupffer cell (KC) cluster. The genes represented by open bars or within the dotted line were common to both mouse and rat KC clusters. Rat genes denoted with an asterisk (*) have provisional or model RefSeq status on the Rat Genome Database (rgd.mcw.edu). Graphs show mean + SEM. p = 0.0007 (*** Clec4f), 0.0414 (* Folr2), 0.0024 (** Vsig4), 0.0209 (* Apoa1), and 0.0091 (** Apoc1) via an unpaired t-test.
Figure 6
Figure 6
Transcriptional response of rat BMDM to LPS. Adult male rat bone marrow (BM) was differentiated into macrophages for 7 days in CSF1. RNA was isolated from BM-derived macrophages (BMDM) after culture with LPS (0, 2, 7, and 24 h) and microarray analysis was performed. Data were RMA-normalised and analysed using Graphia. The network graph generated by the Graphia analysis is shown. Genes are coloured by clusters of co-expression. Expression profiles of clusters that contained genes specific to each time point are shown. Data was obtained from three adult wild-type rats on a DA background and included two technical replicates per rat. One array replicate was also included for 0 h LPS.

Similar articles

Cited by

References

    1. Homberg JR, Wohr M, Alenina N. Comeback of the Rat in Biomedical Research. ACS Chem Neurosci (2017). 8(5):900–3 10.1021/acschemneuro.6b00415 - DOI - PubMed
    1. Aitman TJ, Critser JK, Cuppen E, Dominiczak A, Fernandez-Suarez XM, Flint J, et al. Progress and prospects in rat genetics: a community view. Nat Genet (2008) 40(5):516–22. 10.1038/ng.147 - DOI - PubMed
    1. Atanur SS, Diaz AG, Maratou K, Sarkis A, Rotival M, Game L, et al. Genome sequencing reveals loci under artificial selection that underlie disease phenotypes in the laboratory rat. Cell (2013) 154(3):691–703. 10.1016/j.cell.2013.06.040 - DOI - PMC - PubMed
    1. Maratou K, Behmoaras J, Fewings C, Srivastava P, D’Souza Z, Smith J, et al. Characterization of the macrophage transcriptome in glomerulonephritis-susceptible and -resistant rat strains. Genes Immun (2011) 12(2):78–89. 10.1038/gene.2010.61 - DOI - PMC - PubMed
    1. Summers KM, Bush SJ, Hume DA. Network analysis of transcriptomic diversity amongst resident tissue macrophages and dendritic cells in the mouse mononuclear phagocyte system. PLoS Biol (2020) 18(10):e3000859. 10.1371/journal.pbio.3000859 - DOI - PMC - PubMed

Publication types