. 2021 Feb 3:11:609474.
doi: 10.3389/fimmu.2020.609474. eCollection 2020.

Antibody Responses to Crude Gametocyte Extract Predict Plasmodium falciparum Gametocyte Carriage in Kenya

Affiliations

Antibody Responses to Crude Gametocyte Extract Predict Plasmodium falciparum Gametocyte Carriage in Kenya

Brian R Omondi et al. Front Immunol. .

Abstract

Background: Malaria caused by Plasmodium falciparum remains a serious global public health challenge especially in Africa. Interventions that aim to reduce malaria transmission by targeting the gametocyte reservoir are key to malaria elimination and/or eradication. However, factors that are associated with gametocyte carriage have not been fully explored. Consequently, identifying predictors of the infectious reservoir is fundamental in the elimination campaign.

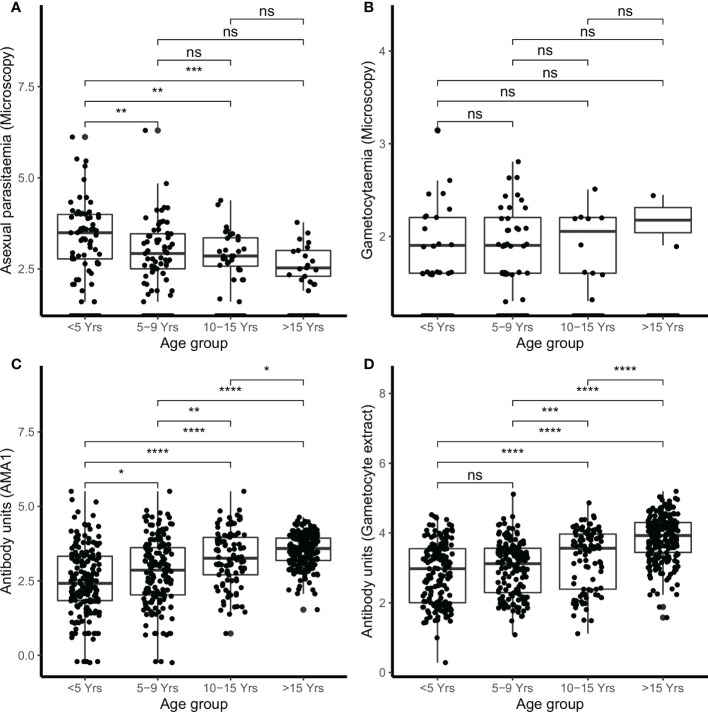
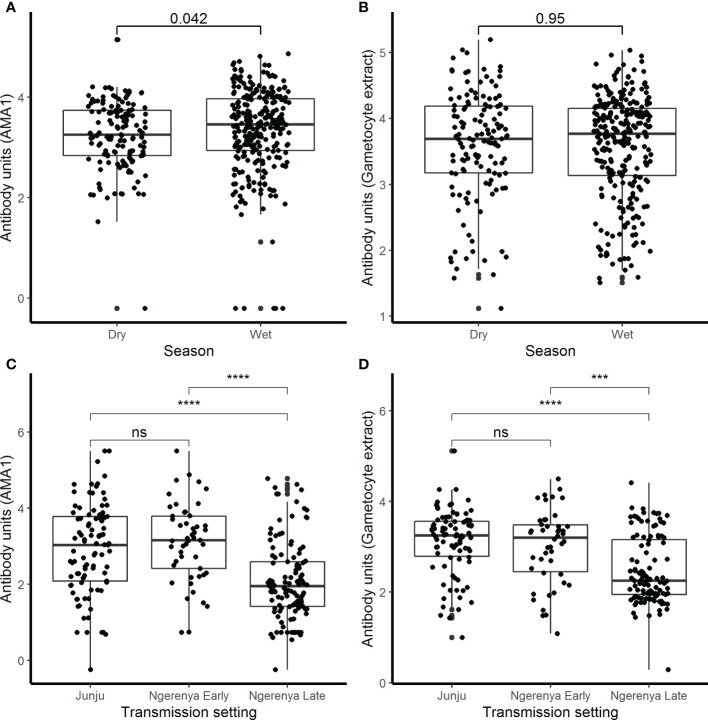
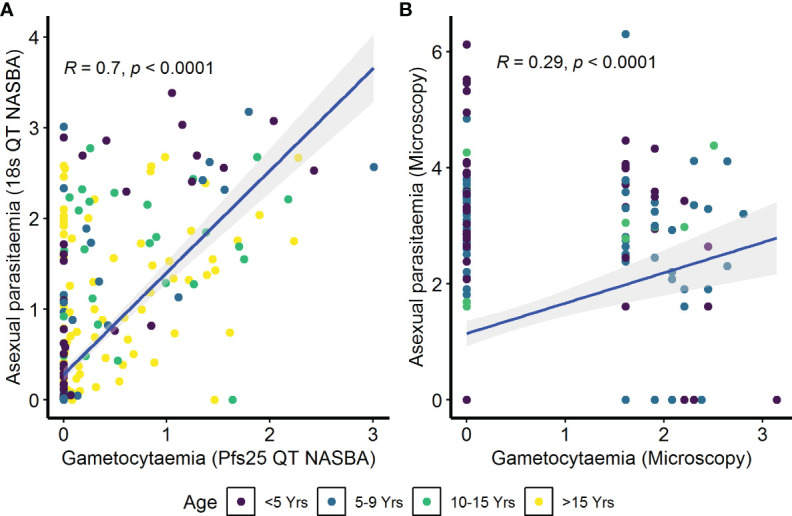
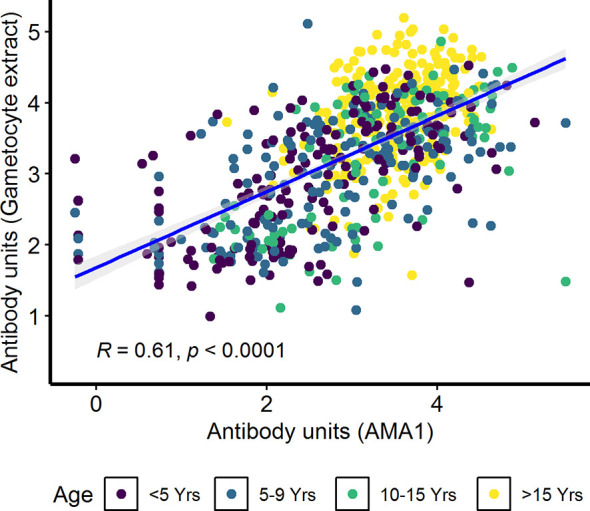
Methods: We cultured P. falciparum NF54 gametocytes (to stage V) and prepared crude gametocyte extract. Samples from a total of 687 participants (aged 6 months to 67 years) representing two cross-sectional study cohorts in Kilifi, Kenya were used to assess IgG antibody responses by ELISA. We also analyzed IgG antibody responses to the blood-stage antigen AMA1 as a marker of asexual parasite exposure. Gametocytemia and asexual parasitemia data quantified by microscopy and molecular detection (QT-NASBA) were used to determine the relationship with antibody responses, season, age, and transmission setting. Multivariable logistic regression models were used to study the association between antibody responses and gametocyte carriage. The predictive power of the models was tested using the receiver operating characteristic (ROC) curve.

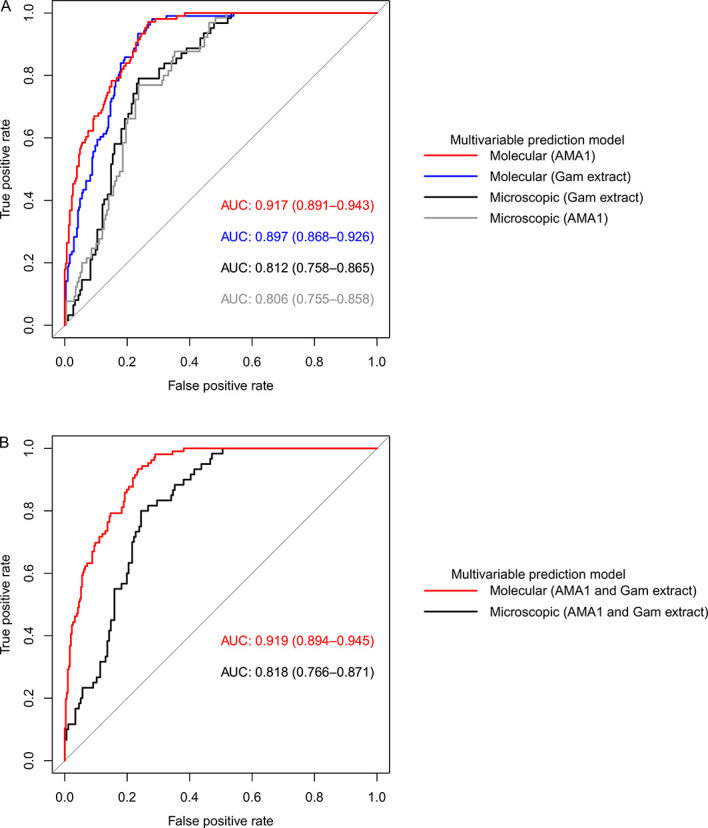
Results: Multivariable logistic regression analysis showed that IgG antibody response to crude gametocyte extract predicted both microscopic (OR=1.81 95% CI: 1.06-3.07, p=0.028) and molecular (OR=1.91, 95% CI: 1.11-3.29, p=0.019) P. falciparum gametocyte carriage. Antibody responses to AMA1 were also associated with both microscopic (OR=1.61 95% CI: 1.08-2.42, p=0.020) and molecular (OR=3.73 95% CI: 2.03-6.74, p<0.001) gametocytemia. ROC analysis showed that molecular (AUC=0.897, 95% CI: 0.868-0.926) and microscopic (AUC=0.812, 95% CI: 0.758-0.865) multivariable models adjusted for gametocyte extract showed very high predictive power. Molecular (AUC=0.917, 95% CI: 0.891-0.943) and microscopic (AUC=0.806, 95% CI: 0.755-0.858) multivariable models adjusted for AMA1 were equally highly predictive.

Conclusion: In our study, it appears that IgG responses to crude gametocyte extract are not an independent predictor of gametocyte carriage after adjusting for AMA1 responses but may predict gametocyte carriage as a proxy marker of exposure to parasites. Serological responses to AMA1 or to gametocyte extract may facilitate identification of individuals within populations who contribute to malaria transmission and support implementation of transmission-blocking interventions.

Keywords: Plasmodium falciparum; antibody response; gametocyte extract; gametocytemia; malaria transmission.


Conflict of interest statement

The authors declare that the research was conducted in the absence of any commercial or financial relationships that could be construed as a potential conflict of interest.

Figures

Figure 1
Figure 1
Parasitemia and IgG antibody responses in the combined cohorts by age. Parasites were detected by microscopy (A) asexual parasites and (B) gametocytes. IgG antibody responses were measured by ELISA (C) AMA1 (D) gametocyte extract. Box-whisker plots indicate median, minimum and maximum with individual measurements represented by a dot. Shown are combined data from both the Kilifi malaria longitudinal cohort (KMLC) and assessment of the infectious reservoir of malaria (AFIRM) cohorts. Wilcoxon test was used to test significance which is shown and was considered at p=0.05 where *p < 0.05, **p < 0.01, ***p < 0.001, ****p < 0.0001, and ns is not significant.
Figure 2
Figure 2
IgG antibody responses by season and transmission setting. IgG antibody responses were measured by ELISA against (A) AMA1 and (B) crude gametocyte extract shown by season in the assessment of the infectious reservoir of malaria (AFIRM) cohort while against (C) AMA1 and (D) crude gametocyte extract by transmission setting in the KMLC cohort. Box-whisker plots indicate median, minimum, and maximum with individual measurements represented by each dot. Wilcoxon test was used to test significance which is shown and was considered at p=0.05 where ***p <0.001, ****p < 0.0001, and ns is not significant.
Figure 3
Figure 3
Correlation between asexual parasitemia and gametocytemia. Parasites were detected by (A) molecular methods (asexual parasitemia—18s QT NASBA, gametocytes—Pfs25 QT NASBA) in the assessment of the infectious reservoir of malaria (AFIRM) cohort or (B) microscopy in the Kilifi malaria longitudinal cohort (KMLC) cohort. Individual dots in the scatter plots represent corresponding measurements from the same participant while regression lines (blue) shows line of best fit and confidence interval are shown in gray.
Figure 4
Figure 4
Correlation between parasitemia and crude gametocyte IgG antibody responses. Asexual parasitemia was measured either by molecular detection (18s QT NASBA) in the (A) assessment of the infectious reservoir of malaria (AFIRM) cohort or (B) microscopy in the Kilifi malaria longitudinal cohort (KMLC) cohort. Gametocytes were detected by either (C) molecular methods (Pfs25 QT NASBA) in AFIRM cohort or (D) microscopy in KMLC. IgG antibody responses to crude gametocyte extract were measured by ELISA. Individual dots in the scatter plot indicate corresponding measurements from the same study participant and regression lines (blue) show line of best fit and confidence interval is shown in gray.
Figure 5
Figure 5
Correlation between antibody responses to AMA1 and crude gametocyte extract. IgG antibody responses to crude gametocyte extract and AMA1 were measured by ELISA. Individual dots in the scatter plot indicate corresponding measurements from the same study participant and regression line (blue) shows line of best fit and confidence intervals are shown in grey. Shown are combined data from both the Kilifi malaria longitudinal cohort (KMLC) and assessment of the infectious reservoir of malaria (AFIRM) cohorts.
Figure 6
Figure 6
Receiver operating characteristic (ROC) curves showing the predictive power of molecular and microscopic gametocyte carriage prediction models. (A) ROC curves for multivariable models adjusted for AMA1 and gametocyte extract independent of each other and (B) multivariable models adjusted for both AMA1 and gametocyte extract. The predictive power was measured by area under curve (AUC).

References

    1. WHO World Malaria Report. Geneva: World Health Orginization, (2018).
    1. Nilsson SK, Childs LM, Buckee C, Marti M. Targeting Human Transmission Biology for Malaria Elimination. PLoS Pathog (2015) 11(6):e1004871. 10.1371/journal.ppat.1004871 - DOI - PMC - PubMed
    1. malERA, C.G.o.V A research agenda for malaria eradication: vaccines. PLoS Med (2011) 8(1):e1000398–e1000398. 10.1371/journal.pmed.1000398 - DOI - PMC - PubMed
    1. Nacher M, Singhasivanon P, Silachamroon U, Treeprasertsuk S, Tosukhowong T, Vannaphan S, et al. Decreased hemoglobin concentrations, hyperparasitemia, and severe malaria are associated with increased Plasmodium falciparum gametocyte carriage. J Parasitol (2002) 88(1):97–101. 10.1645/0022-3395(2002)088[0097:DHCHAS]2.0.CO;2 - DOI - PubMed
    1. Collins KA, Wang CY, Adams M, Mitchell H, Rampton M, Elliott S, et al. A controlled human malaria infection model enabling evaluation of transmission-blocking interventions. J Clin Invest (2018) 128(4):1551–62. 10.1172/jci98012 - DOI - PMC - PubMed

Publication types

Substances

LinkOut - more resources