

Dynamic Regulation of JAK-STAT Signaling Through the Prolactin Receptor Predicted by Computational Modeling
- PMID: 33633812
- PMCID: PMC7878662
- DOI: 10.1007/s12195-020-00647-8
Dynamic Regulation of JAK-STAT Signaling Through the Prolactin Receptor Predicted by Computational Modeling
Abstract
Introduction: The expansion of insulin-producing beta cells during pregnancy is critical to maintain glucose homeostasis in the face of increasing insulin resistance. Prolactin receptor (PRLR) signaling is one of the primary mediators of beta cell expansion during pregnancy, and loss of PRLR signaling results in reduced beta cell mass and gestational diabetes. Harnessing the proliferative potential of prolactin signaling to expand beta cell mass outside of the context of pregnancy requires quantitative understanding of the signaling at the molecular level.
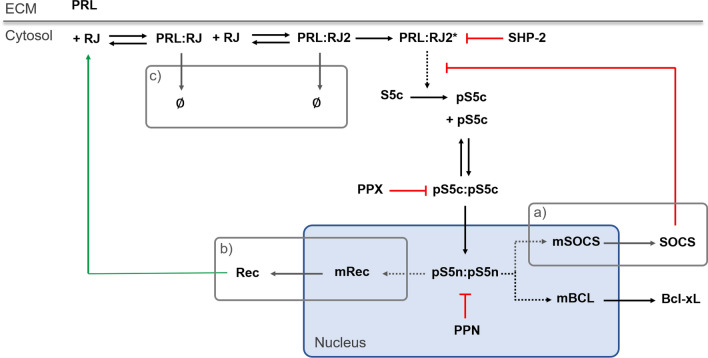
Methods: A mechanistic computational model was constructed to describe prolactin-mediated JAK-STAT signaling in pancreatic beta cells. The effect of different regulatory modules was explored through ensemble modeling. A Bayesian approach for likelihood estimation was used to fit the model to experimental data from the literature.
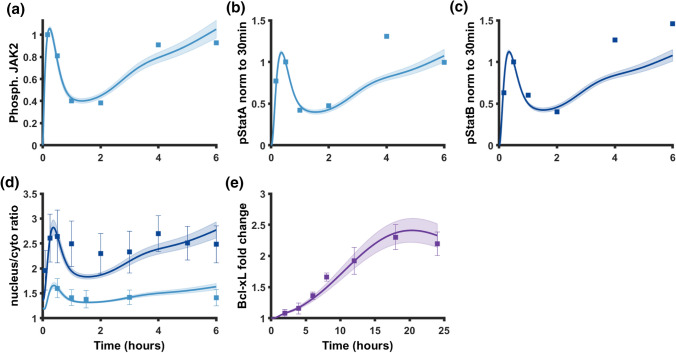
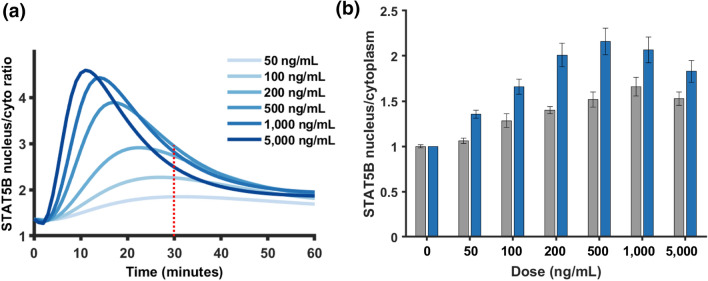
Results: Including receptor upregulation, with either inhibition by SOCS proteins, receptor internalization, or both, allowed the model to match experimental results for INS-1 cells treated with prolactin. The model predicts that faster dimerization and nuclear import rates of STAT5B compared to STAT5A can explain the higher STAT5B nuclear translocation. The model was used to predict the dose response of STAT5B translocation in rat primary beta cells treated with prolactin and reveal possible strategies to modulate STAT5 signaling.
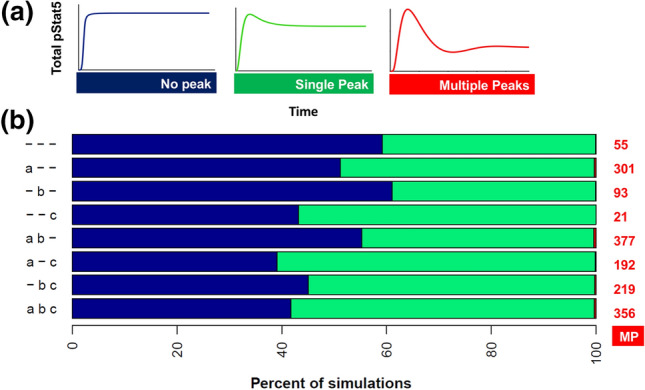
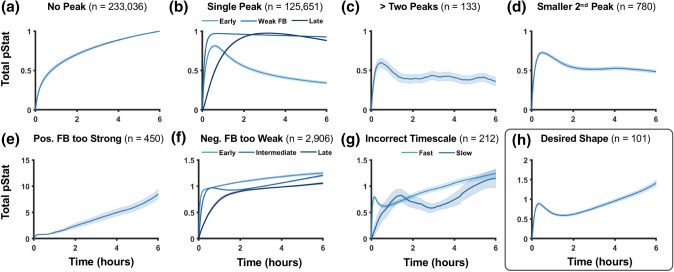
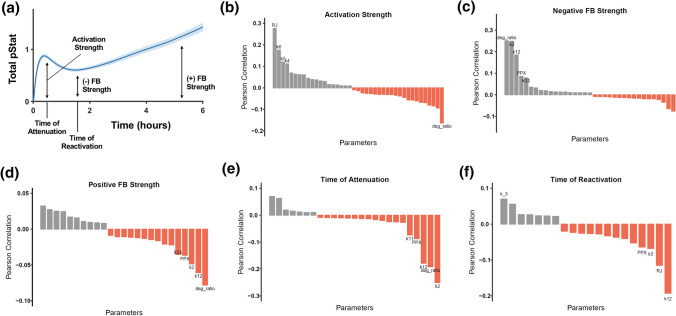
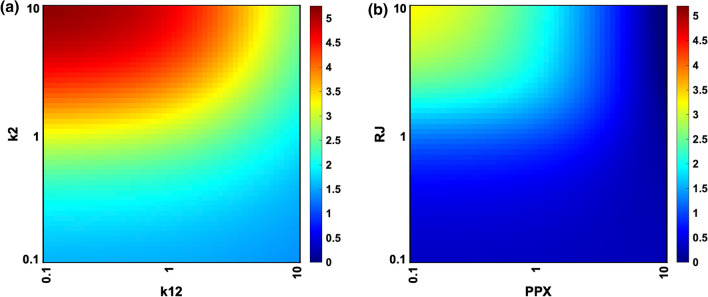
Conclusions: JAK-STAT signaling must be tightly controlled to obtain the biphasic response in STAT5 activation seen experimentally. Receptor up-regulation, combined with SOCS inhibition, receptor internalization, or both is required to match experimental data. Modulating reactions upstream in the signaling can enhance STAT5 activation to increase beta cell survival.
Keywords: Beta cell biology; Ensemble modeling; Feedback control; Intracellular signaling.
© The Author(s) 2020.
Figures

Similar articles
-
An immunohistochemical approach to monitor the prolactin-induced activation of the JAK2/STAT5 pathway in pancreatic islets of Langerhans.J Histochem Cytochem. 2002 Mar;50(3):365-83. doi: 10.1177/002215540205000308. J Histochem Cytochem. 2002. PMID: 11850439
-
Phosphatases are predicted to govern prolactin-mediated JAK-STAT signaling in pancreatic beta cells.Integr Biol (Camb). 2022 Apr 8;14(2):37-48. doi: 10.1093/intbio/zyac004. Integr Biol (Camb). 2022. PMID: 35368075
-
Regulation of prolactin receptor (PRLR) gene expression in insulin-producing cells. Prolactin and growth hormone activate one of the rat prlr gene promoters via STAT5a and STAT5b.J Biol Chem. 1999 Jun 25;274(26):18686-92. doi: 10.1074/jbc.274.26.18686. J Biol Chem. 1999. PMID: 10373481
-
Differential effects of prolactin and src/abl kinases on the nuclear translocation of STAT5B and STAT5A.J Biol Chem. 1999 Aug 6;274(32):22484-92. doi: 10.1074/jbc.274.32.22484. J Biol Chem. 1999. PMID: 10428824
-
Prolactin receptor targeting in breast and prostate cancers: New insights into an old challenge.Pharmacol Ther. 2017 Nov;179:111-126. doi: 10.1016/j.pharmthera.2017.05.009. Epub 2017 May 23. Pharmacol Ther. 2017. PMID: 28549597 Review.
Cited by
-
Bayesian parameter estimation for dynamical models in systems biology.PLoS Comput Biol. 2022 Oct 21;18(10):e1010651. doi: 10.1371/journal.pcbi.1010651. eCollection 2022 Oct. PLoS Comput Biol. 2022. PMID: 36269772 Free PMC article.
-
Exogenous Lactogenic Signaling Stimulates Beta Cell Replication In Vivo and In Vitro.Biomolecules. 2022 Jan 26;12(2):215. doi: 10.3390/biom12020215. Biomolecules. 2022. PMID: 35204716 Free PMC article.
-
Parkinson's Spectrum Mechanisms in Pregnancy: Exploring Hypothetical Scenarios for MSA in the Era of ART.Int J Mol Sci. 2025 Apr 3;26(7):3348. doi: 10.3390/ijms26073348. Int J Mol Sci. 2025. PMID: 40244235 Free PMC article. Review.
-
Logic-based modeling of inflammatory macrophage cross talk with glomerular endothelial cells in diabetic kidney disease.Am J Physiol Renal Physiol. 2025 Jul 1;329(1):F202-F224. doi: 10.1152/ajprenal.00362.2024. Epub 2025 May 26. Am J Physiol Renal Physiol. 2025. PMID: 40418541 Free PMC article.
-
MECHANISTIC AND DATA-DRIVEN MODELS OF CELL SIGNALING: TOOLS FOR FUNDAMENTAL DISCOVERY AND RATIONAL DESIGN OF THERAPY.Curr Opin Syst Biol. 2021 Dec;28:100349. doi: 10.1016/j.coisb.2021.05.010. Epub 2021 Jun 9. Curr Opin Syst Biol. 2021. PMID: 35935921 Free PMC article.
References
-
- Ali S, Nouhi Z, Chughtai N, Ali S. SHP-2 regulates SOCS-1-mediated janus kinase-2 ubiquitination/degradation downstream of the prolactin receptor. J. Biol. Chem. 2003;278:52021–52031. - PubMed
-
- Ambrosio R, et al. The structure of human STAT5A and B genes reveals two regions of nearly identical sequence and an alternative tissue specific STAT5B promoter. Gene. 2002;285:311–318. - PubMed
-
- Banerjee RR. Piecing together the puzzle of pancreatic islet adaptation in pregnancy: Pregnancy and pancreatic islets. Ann. N. Y. Acad. Sci. 2018;1411:120–139. - PubMed
LinkOut - more resources
Full Text Sources
Miscellaneous
