. 2021 Feb 9:8:609290.
doi: 10.3389/fcell.2020.609290. eCollection 2020.

High Dosages of Equine Chorionic Gonadotropin Exert Adverse Effects on the Developmental Competence of IVF-Derived Mouse Embryos and Cause Oxidative Stress-Induced Aneuploidy

Affiliations

High Dosages of Equine Chorionic Gonadotropin Exert Adverse Effects on the Developmental Competence of IVF-Derived Mouse Embryos and Cause Oxidative Stress-Induced Aneuploidy

En Lin et al. Front Cell Dev Biol. .

Abstract

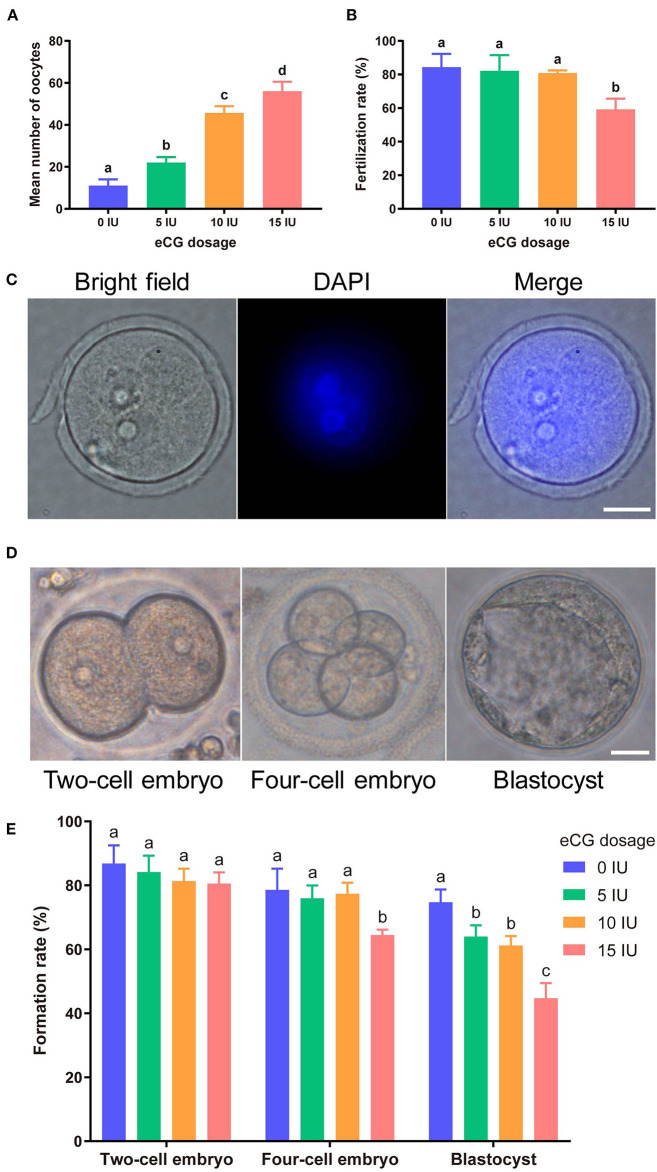
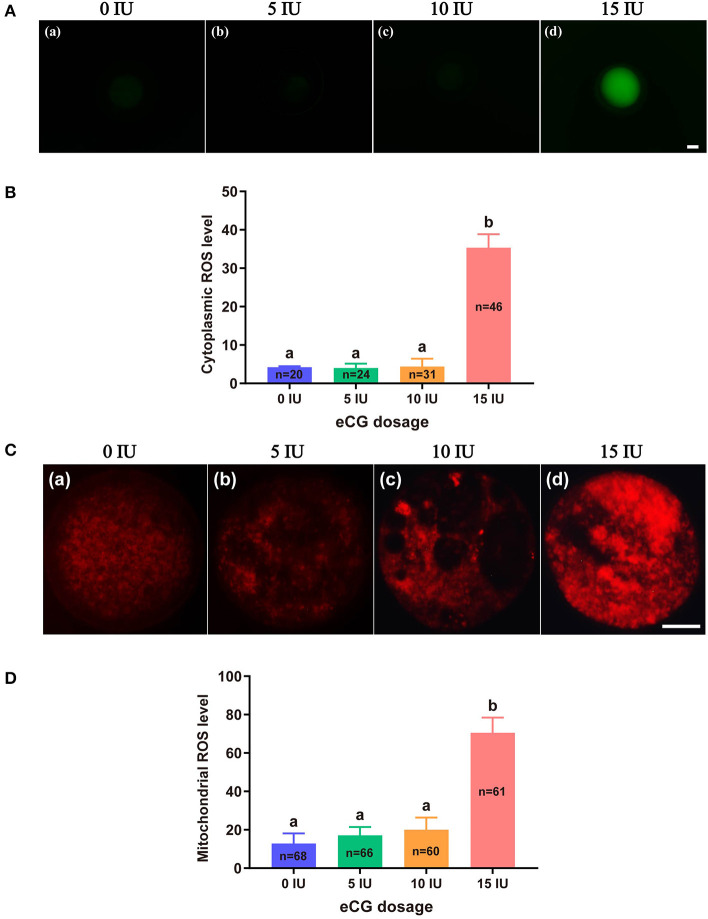
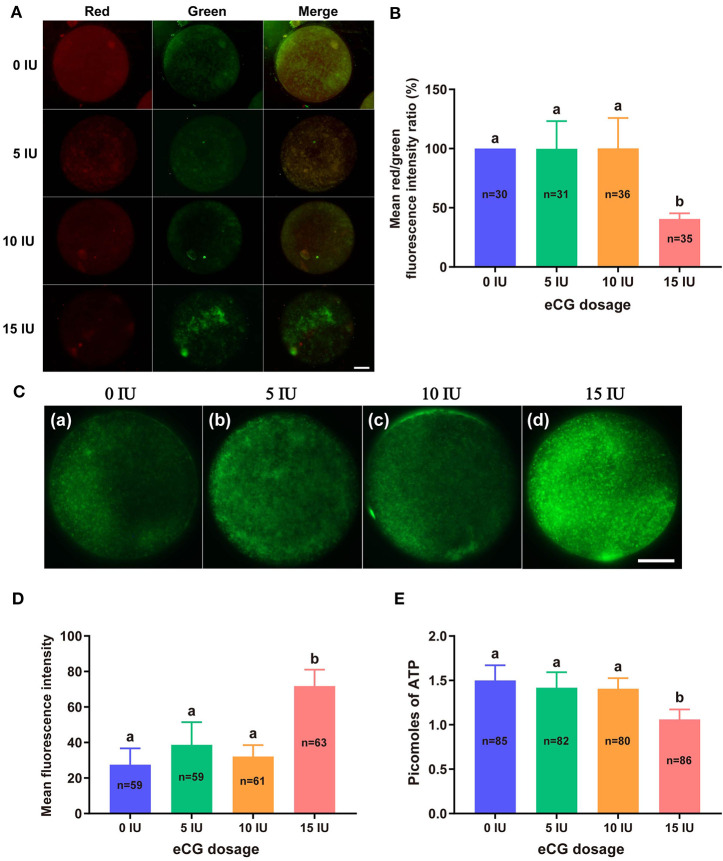
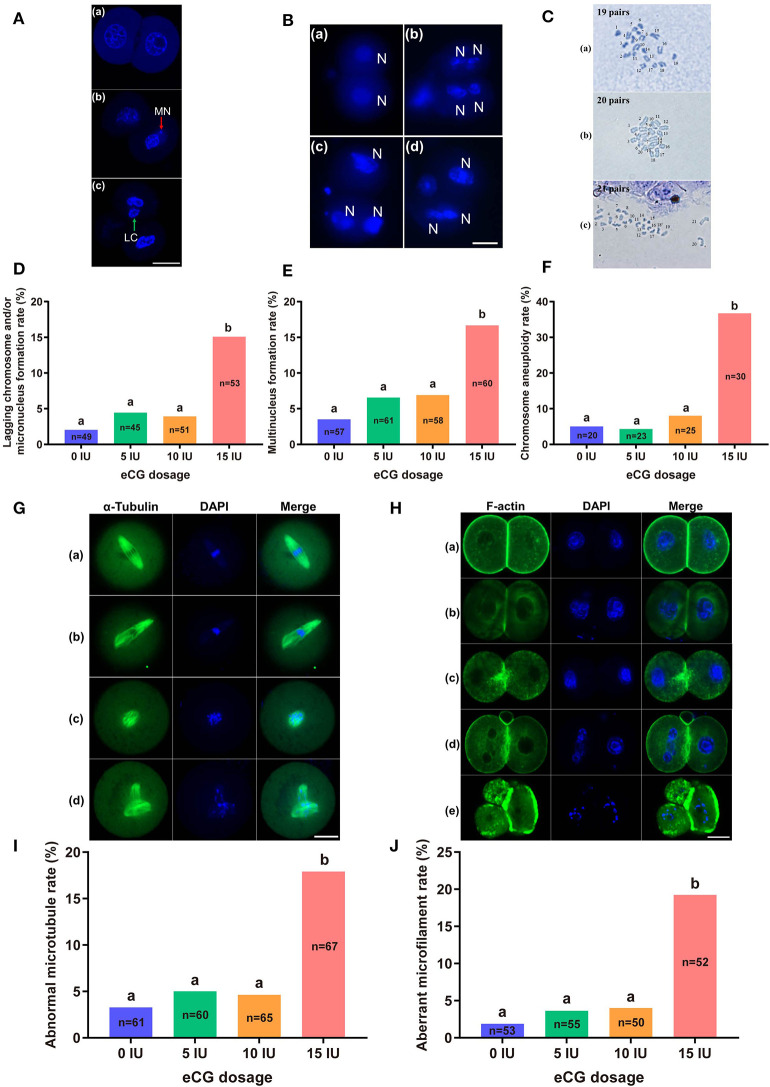
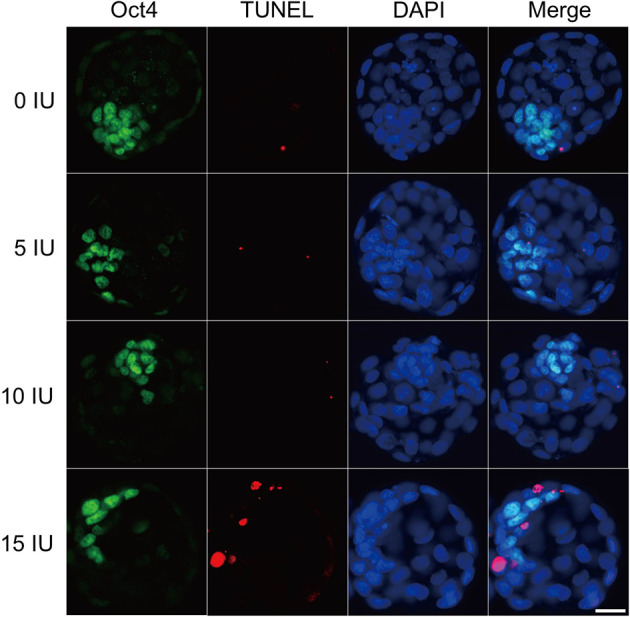
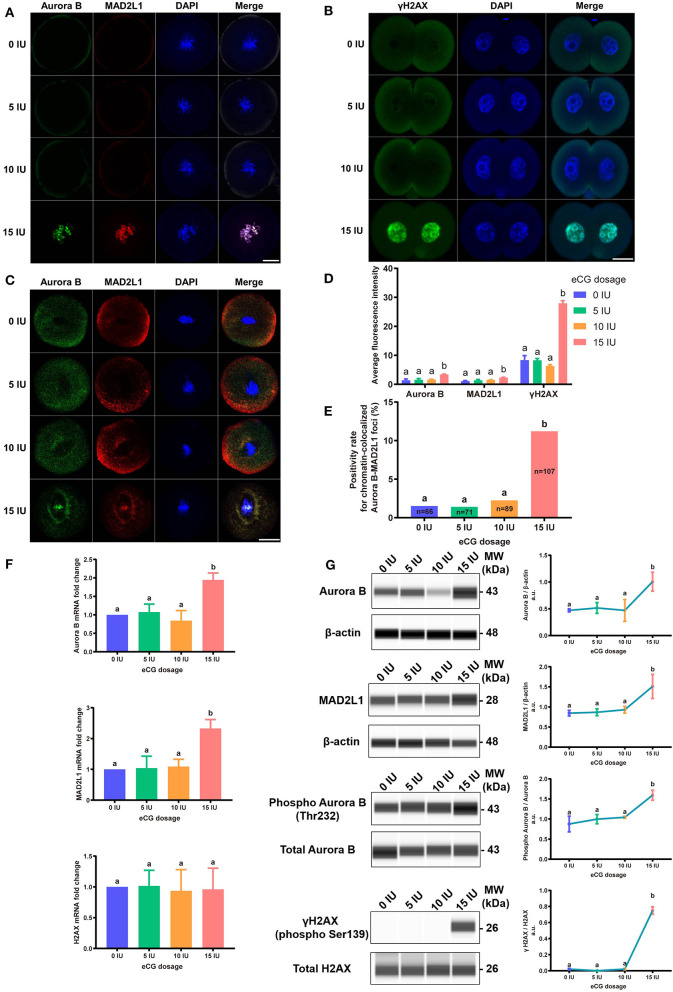
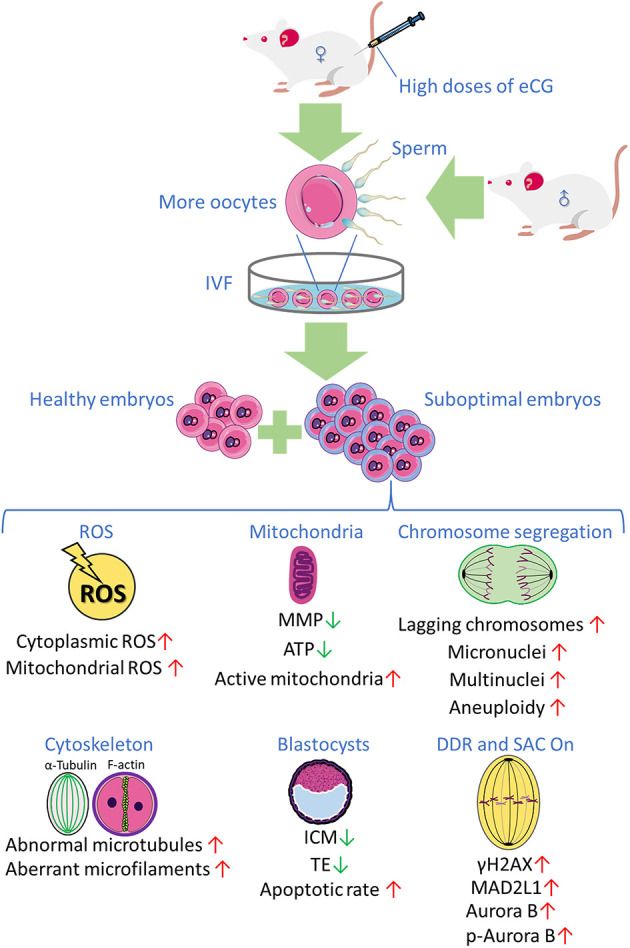
Gonadotropins play vital roles in the regulation of female reproductive ability and fertility. Our study aimed to determine the effects of superovulation induced by increasing doses of equine chorionic gonadotropin [eCG; also referred to as pregnant mare serum gonadotropin (PMSG)] on the developmental competence of mouse embryos and on aneuploidy formation during in vitro fertilization (IVF). eCG dose-dependently enhanced the oocyte yield from each mouse. Administration of 15 IU eCG significantly reduced the fertilization rate and the formation of four-cell embryos and blastocysts and increased the risk of chromosome aneuploidy. The IVF-derived blastocysts in the 15 IU eCG treatment group had the fewest total cells, inner cell mass (ICM) cells and trophectoderm (TE) cells. Moreover, more blastocysts and fewer apoptotic cells were observed in the 0, 5, and 10 IU eCG treatment groups than in the 15 IU eCG treatment group. We also investigated reactive oxygen species (ROS) levels and variations in several variables: mitochondrial membrane potential (MMP); active mitochondria; mitochondrial superoxide production; adenosine triphosphate (ATP) content; spindle structures; chromosome karyotypes; microfilament distribution; and the expression of Aurora B [an important component of the chromosomal passenger complex (CPC)], the spindle assembly checkpoint (SAC) protein mitotic arrest deficient 2 like 1 (MAD2L1), and the DNA damage response (DDR) protein γH2AX. Injection of 15 IU eCG increased ROS levels, rapidly reduced MMP, increased active mitochondria numbers and mitochondrial superoxide production, reduced ATP content, increased abnormal spindle formation rates, and induced abnormalities in chromosome number and microfilament distribution, suggesting that a high dose of eCG might alter developmental competence and exert negative effects on IVF-obtained mouse embryos. Additionally, the appearance of γH2AX and the significantly increased expression of Aurora B and MAD2L1 suggested that administration of relatively high doses of eCG caused Aurora B-mediated SAC activation triggered by ROS-induced DNA damage in early mouse IVF-derived embryos for self-correction of aneuploidy formation. These findings improve our understanding of the application of gonadotropins and provide a theoretical basis for gonadotropin treatment.

Keywords: Aurora B; DNA damage response; MAD2L1; aneuploidy; equine chorionic gonadotropin; reactive oxygen species; spindle assembly checkpoint.


Conflict of interest statement

The authors declare that the research was conducted in the absence of any commercial or financial relationships that could be construed as a potential conflict of interest.

Figures

Figure 1
Figure 1
Effects of different eCG doses on the development of IVF-derived mouse embryos. (A) Mean numbers (means ± SDs) of oocytes obtained after administration of 0, 5, 10, and 15 IU eCG (with 10 IU HCG injection). a,b,c,dBars labeled with different letters are significantly different from each other (P < 0.05). (B) Fertilization rates after treatments with different eCG doses. a,bBars labeled with different superscript letters are significantly different from each other (P < 0.05). (C) Representative images of 2PN zygotes in mouse embryos at 8–10 h post insemination (hpi) (scale bar = 20 μm). (D) Morphological appearances of a two-cell embryo, a four-cell mouse embryo and a single blastocyst. Scale bar = 20 μm. (E) Rates of two-cell embryo, four-cell embryo and blastocyst formation with different doses of eCG. The data are expressed as the means ± SDs. a,b,cColumns within a group marked with different superscript letters are significantly different from each other, P < 0.05.
Figure 2
Figure 2
Effects of different eCG doses on ROS concentrations in IVF-derived mouse embryos. (A) Representative images of cytoplasmic ROS in embryos after administration of eCG at doses of 0, 5, 10, and 15 IU (a–d). Scale bar = 20 μm. (B) ROS production in the cytoplasm was assessed by staining with DCFH-DA. The cytoplasmic ROS levels of the embryos in the group treated with the high dose (15 IU) of eCG were significantly higher than those of the embryos in the other three groups. (C) Representative images of mitochondrial ROS in embryos after administration of eCG at doses of 0, 5, 10, and 15 IU (a–d). Scale bar = 20 μm. (D) ROS production in mitochondria was assessed using the mitochondrial superoxide indicator MitoSOX™ Red. The mitochondrial ROS levels of the embryos in the group treated with the high dose (15 IU) of eCG were significantly higher than those of the embryos in the other three groups. The continuous FI data were analyzed using Student's t-test and ANOVA. a,bBars labeled with different letters are significantly different from each other (P < 0.05). n shows the total number of embryos detected.
Figure 3
Figure 3
Effects of different eCG doses on the mitochondrial function of IVF-derived mouse embryos. (A) Representative images of the MMP in embryos after administration of eCG at doses of 0, 5, 10, and 15 IU. Scale bar = 20 μm. (B) Ratios of the red/green FI following JC-1 staining. The mean red/green FI ratio of the control (0 IU eCG injection) group was set to 100%. (C) Representative images of mitochondrial activity in embryos after administration of eCG at doses of 0, 5, 10, and 15 IU (a–d). Scale bar = 20 μm. (D) Magnitude of mitochondrial activity in IVF-derived embryos after administration of different doses of eCG. The mitochondrial activity in the embryos is represented by the mean FI. (E) ATP content of individual embryos from mice administered different doses of eCG. All the values are presented as the means ± SDs. Different letters above the columns indicate significant differences (P < 0.05). Each experiment was performed in triplicate, and n shows the total number of embryos detected.
Figure 4
Figure 4
Effects of different eCG doses on chromosome segregation and the cytoskeleton in IVF-derived mouse embryos during the first mitotic division. (A) Fluorescence photomicrograph of two normal daughter nuclei, micronuclei (red arrow) and lagging chromosomes (green arrow) (a–c, respectively) in IVF-derived mouse embryos during the first mitosis. Scale bar = 20 μm. MN and LC refer to micronuclei and lagging chromosomes, respectively. (B) Representative images of two new daughter nuclei (a) and multinuclei (b–d). Scale bar = 20 μm. N refers to nuclei. (C) Hypodiploidy: 19 pairs of chromosomes (a). Normal mice have 20 pairs of chromosomes (b). Hyperdiploidy: 21 pairs of chromosomes (c). (D–F) Bar graphs of the lagging chromosome and/or micronucleus formation rates, multinucleus formation rates, and chromosome aneuploidy rates for the four groups. (G) Confocal images of a normal spindle structure and shape (a) and abnormal spindle formation (b–d). Mouse embryos at metaphase were stained with anti-α-tubulin antibodies (green) to detect microtubules, namely, the spindle. Scale bar = 20 μm. (H) Mouse embryos were stained with Alexa Fluor™ 488 phalloidin (green) to visualize the configuration and distribution of microfilaments. Normal microfilaments were precisely located in the cell cortex around the contractile ring at telophase (a). Representative images of aberrant microfilament formation (b–e). Scale bar = 20 μm. (I,J) Bar graphs of the abnormal microtubule rates and aberrant microfilament rates, respectively. Different lowercase letters in the columns within each parameter indicate significant differences (P < 0.05). The nuclei were stained with DAPI (blue), and n shows the total number of embryos detected.
Figure 5
Figure 5
Effects of different eCG doses on apoptosis and cell allocation in IVF-derived mouse blastocysts. Representative fluorescence micrographs of IVF-derived blastocysts obtained from groups primed with different doses of eCG are shown. The proportion of ICM cells was inferred by counting Oct4-positive (green) cells. The percentage of apoptotic nuclei was examined by detecting TUNEL-positive (red) cells. DAPI staining (blue) was used to analyze the total number of nuclei and thus estimate the total cell count of individual blastocysts. Scale bar = 20 μm.
Figure 6
Figure 6
Effects of different eCG doses on the expression profiles of γH2AX, Aurora B, and MAD2L1 in IVF-derived mouse embryos. (A) The subcellular colocalization between Aurora B (green) and MAD2L1 (red) in IVF-derived mouse embryos from groups treated with different eCG doses was observed by immunofluorescence staining. The nuclei were stained with DAPI (blue). Scale bar = 20 μm. (B) Representative photomicrographs of γH2AX in each group. In the 15 IU eCG treatment group, γH2AX (green) was strikingly expressed in two daughter nuclei (blue). Scale bar = 20 μm. (C) Confocal images of RNA FISH for endogenous Aurora B (green) and MAD2L1 (red) mRNA molecules in IVF-derived mouse embryos following administration of different doses of eCG. The embryo nuclei were counterstained with DAPI (blue). Scale bar = 20 μm. (D) Average FI of Aurora B/MAD2L1/γH2AX per IVF-derived mouse embryo in the groups treated with different eCG doses. The continuous FI data were analyzed using Student's t-test and ANOVA. a,bDifferent lowercase letters in the columns within each parameter indicate significant differences (P < 0.05). (E) Percentages of IVF-derived mouse embryos positive for local enrichment of Aurora B and MAD2L1 mRNA signals on chromatin (positivity rates for chromatin-colocalized Aurora B-MAD2L1 foci) in groups of mice administered eCG once at doses ranging from 0 to 15 IU. n shows the total number of embryos. Different letters in the columns depict statistical significance (for a and b, P < 0.05). (F) The relative mRNA expression levels of Aurora B, MAD2L1, and H2AX were analyzed by RT-PCR and normalized to those of β-actin. The differences in these continuous data were analyzed by Student's t-test and ANOVA. a,bColumns marked with different letters are significantly different from each other (P < 0.05). (G) Capillary-based immunodetection of protein extracts was performed using a Wes capillary-based device (ProteinSimple) to determine the average levels of Aurora B, MAD2L1, phospho-Aurora B (T232), and γH2AX. Every experiment was performed in triplicate. a,bDifferent superscripts above the error bars show significant differences (P < 0.05).
Figure 7
Figure 7
The research findings obtained in the present study reveal that priming with high doses of eCG exerts marked adverse effects on certain developmental competences of IVF-derived mouse embryos.

Similar articles

Cited by

References

    1. Aitken R. J. (2020). Impact of oxidative stress on male and female germ cells: implications for fertility. Reproduction 159, R189–R201. 10.1530/REP-19-0452 - DOI - PubMed
    1. Alper M. M., Fauser B. C. (2017). Ovarian stimulation protocols for IVF: is more better than less? Reprod. Biomed. Online 34, 345–353. 10.1016/j.rbmo.2017.01.010 - DOI - PubMed
    1. Anderson R. C., Newton C. L., Anderson R. A., Millar R. P. (2018). Gonadotropins and their analogs: current and potential clinical applications. Endocr. Rev. 39, 911–937. 10.1210/er.2018-00052 - DOI - PubMed
    1. Balboula A. Z., Schindler K. (2014). Selective disruption of aurora C kinase reveals distinct functions from aurora B kinase during meiosis in mouse oocytes. PLoS Genet. 10:e1004194. 10.1371/journal.pgen.1004194 - DOI - PMC - PubMed
    1. Barash O. O., Hinckley M. D., Rosenbluth E. M., Ivani K. A., Weckstein L. N. (2017). High gonadotropin dosage does not affect euploidy and pregnancy rates in IVF PGS cycles with single embryo transfer. Hum. Reprod. 32, 2209–2217. 10.1093/humrep/dex299 - DOI - PubMed

LinkOut - more resources