. 2021 Feb 9:8:610369.
doi: 10.3389/fcell.2020.610369. eCollection 2020.

Nitric Oxide in the Control of the in vitro Proliferation and Differentiation of Human Hematopoietic Stem and Progenitor Cells

Affiliations

Nitric Oxide in the Control of the in vitro Proliferation and Differentiation of Human Hematopoietic Stem and Progenitor Cells

Julia Hümmer et al. Front Cell Dev Biol. .

Abstract

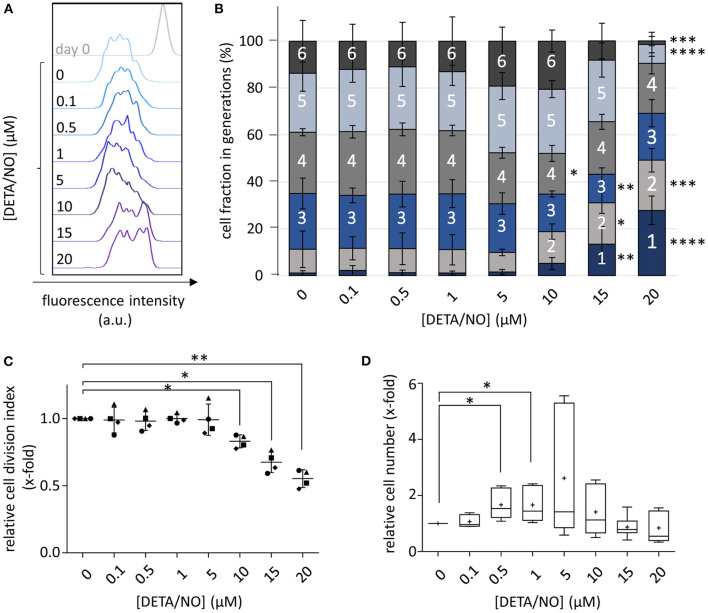
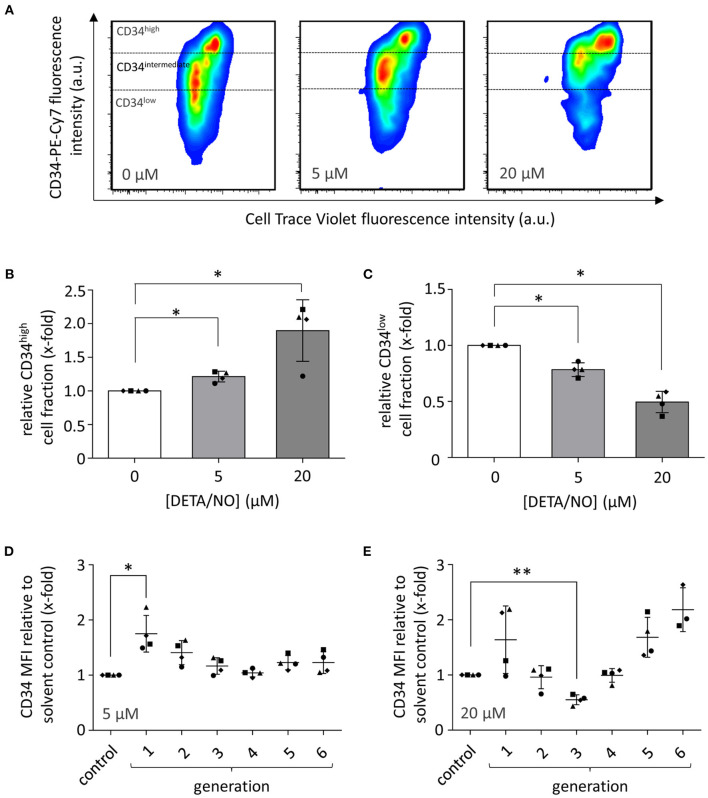
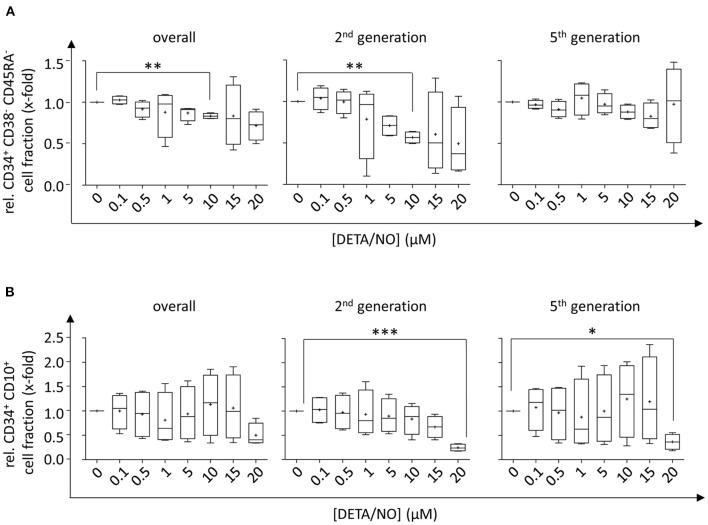
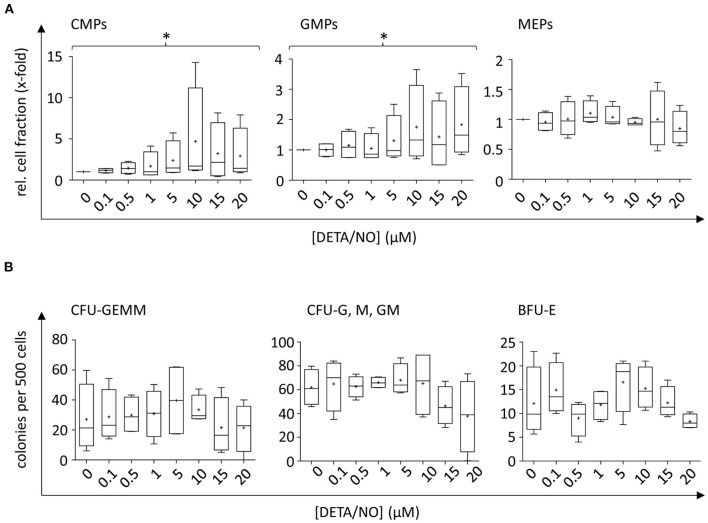
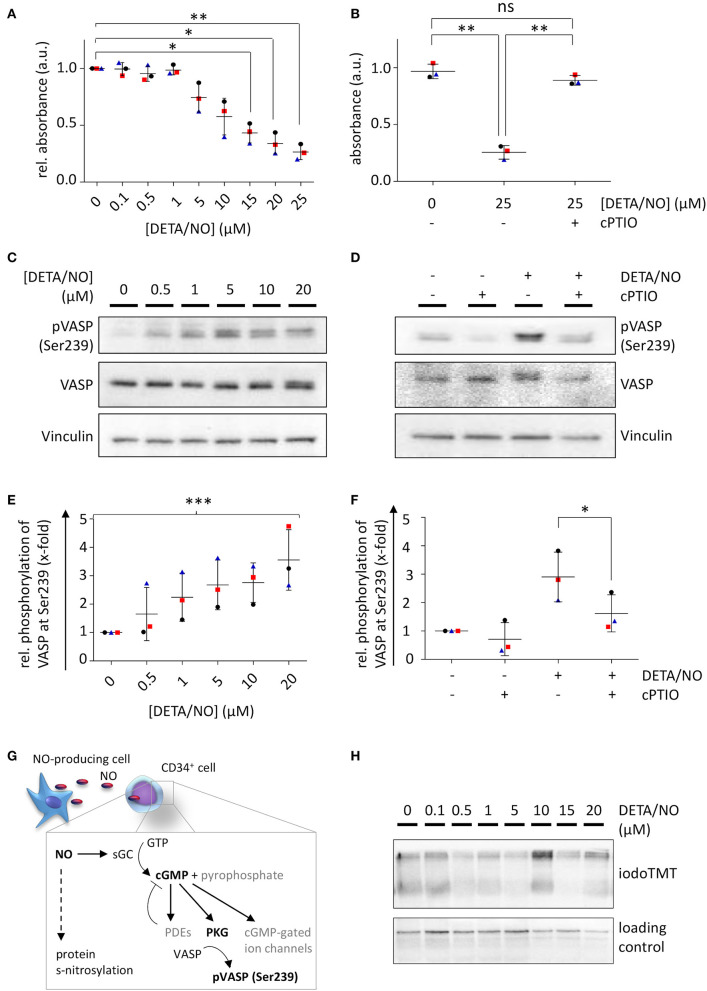
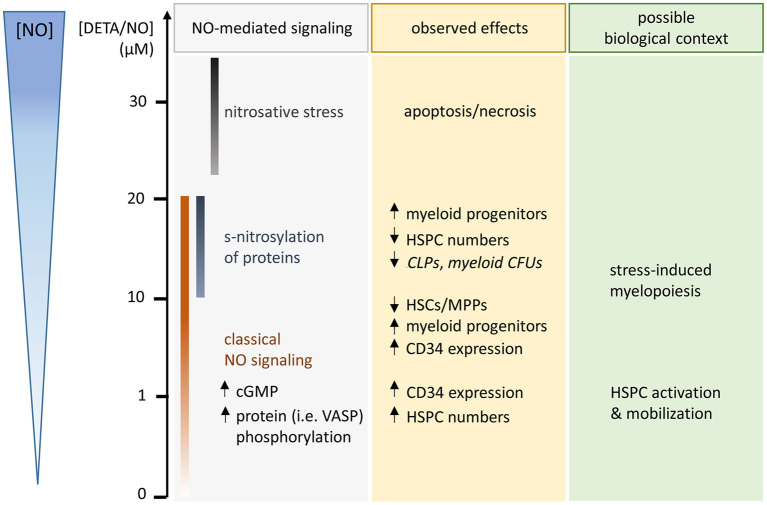
Hematopoietic stem and progenitor cell (HSPC) transplantation is the best-studied cellular therapy and successful in vitro control of HSPCs has wide clinical implications. Nitric oxide (NO) is a central signaling molecule in vivo and has been implicated in HSPC mobilization to the blood stream in mice. The influence of NO on HSPC behavior in vitro is, however, largely obscure due to the variety of employed cell types, NO administration systems, and used concentration ranges in the literature. Additionally, most studies are based on murine cells, which do not necessarily mimic human HSPC behavior. Thus, the aim of the present study was the systematic, concentration-dependent evaluation of NO-mediated effects on human HSPC behavior in vitro. By culture in the presence of the long-term NO donor diethylenetriamine/nitric oxide adduct (DETA/NO) in a nontoxic concentration window, a biphasic role of NO in the regulation of HSPC behavior was identified: Low DETA/NO concentrations activated classical NO signaling, identified via increased intracellular cyclic guanosine monophosphate (cGMP) levels and proteinkinases G (PKG)-dependent vasodilator-stimulated phosphoprotein (VASP) phosphorylation and mediated a pro-proliferative response of HSPCs. In contrast, elevated NO concentrations slowed cell proliferation and induced HSPC differentiation. At high concentrations, s-nitrosylation levels were elevated, and myeloid differentiation was increased at the expense of lymphoid progenitors. Together, these findings hint at a central role of NO in regulating human HSPC behavior and stress the importance and the potential of the use of adequate NO concentrations for in vitro cultures of HSPCs, with possible implications for clinical application of in vitro expanded or differentiated HSPCs for cellular therapies.

Keywords: ROS/RNS; differentiation; gasotransmitter; hematopoietic stem cells; nitric oxide; proliferation.


Conflict of interest statement

The authors declare that the research was conducted in the absence of any commercial or financial relationships that could be construed as a potential conflict of interest.

Figures

Figure 1
Figure 1
Concentration-dependent influence of up to 20 μM diethylenetriamine/nitric oxide adduct (DETA/NO) on hematopoietic stem and progenitor cell (HSPC) proliferation in vitro. (A) Overlay of the CellTraceTM Violet (CTV) fluorescence intensity profiles (x-axis) of one representative donor before (gray, top) and after cultivation with DETA/NO for 5 days (colored, concentrations increasing from top to bottom). (B) Calculated cell fractions in HSPC generations (y-axis) after 5 days of culture with DETA/NO (x-axis). Bar graphs indicate the mean cell fraction in single cell generations (indicated by numbers) of n = 4 independent experiments with the corresponding standard deviation as error bars. (C) Calculated cell division index of CTV-stained HSPCs relative to the solvent control (y-axis) after 5 days of stimulation with DETA/NO (x-axis). The dot plot displays the relative cell division index of n = 4 independent experiments with the mean and the corresponding standard deviation shown as line and error bars. (D) Cell number of unstained HSPCs normalized to the solvent control (y-axis) after 5 days of culture in the presence of DETA/NO (x-axis). The boxplot graph displays the median as a line across the boxes of n = 8 independent experiments and the mean as a plus. Lower and upper boxes indicate the 25th percentile to the 75th percentile. Whiskers represent maximum and minimum values. Statistically significant intermean differences as per ANOVA (comparison of (A–C) each column with the control or (D) preselected pairs of columns) are indicated as follows: *P < 0.05; **P < 0.001; ***0.0001 < P < 0.001; ****P < 0.0001.
Figure 2
Figure 2
Effect of hematopoietic stem and progenitor cell (HSPC) culture in presence of diethylenetriamine/nitric oxide adduct (DETA/NO) for 5 days on the expression of the HSPC marker CD34 as analyzed by flow cytometry. (A) Pseudo-colored, smoothed dot plots of the fluorescence intensity in the CD34 channel (y-axis) shown against the CellTraceTM Violet (CTV) channel (x-axis) for one representative donor after culture in presence of 0, 5, and 20 μM of DETA/NO. Expression levels of CD34 were categorized in CD34high, CD34intermediate, and CD34low depending on the displayed fluorescence intensity as indicated. (B) CD34high and (C) CD34low cell fractions (y-axis) after culture with 0, 5, and 20 μM of DETA/NO (x-axis). Bar graphs display the mean cell fractions of n = 4 independent experiments with the corresponding standard deviations as error bars. Effect of stimulation with (D) 5 μM and (E) 20 μM DETA/NO on the expression level of CD34 in cells of different proliferative activity. The y-axis displays the mean fluorescence intensity (MFI) in the CD34 channel relative to the solvent control, while on the x-axis, the solvent control (control) as well as the number of cellular divisions are shown indicated as generations. Dot plots display the mean of n = 4 independent experiments with corresponding standard deviations as lines with error bars. Statistically significant intermean differences as per ANOVA (comparison of each column with the control) are indicated as follows: *P < 0.05; **P < 0.001.
Figure 3
Figure 3
Influence of up to 20 μM diethylenetriamine/nitric oxide adduct (DETA/NO) on the retention of hematopoietic stem cell (HSC) and multipotent progenitor (MPP) fractions and the differentiation behavior into early lymphoid progenitor populations in vitro as determined by flow cytometry. Fractions of (A) CD34+ CD38 CD45RA HSC and MPP fractions and (B) CD34+ CD10+ CLP fractions (y-axis) relative to the solvent control after 5 days of culture in presence of DETA/NO in the overall hematopoietic stem and progenitor cell (HSPC) population regardless of their proliferative activity (left) and in cell fractions that underwent two (middle) and five (right) cell divisions. Boxplot graphs display the median as a line across the boxes of n = 4 independent experiments with mean values indicated by a plus. Lower and upper boxes indicate the 25th to the 75th percentile. Whiskers represent maximum and minimum values. Statistically significant intermean differences as per ANOVA (comparison of each column with the control) are indicated as follows: *P < 0.05; **P < 0.001; ***0.0001 < P < 0.001.
Figure 4
Figure 4
Concentration-dependent effect of up to 20 μM diethylenetriamine/nitric oxide adduct (DETA/NO) on myeloid differentiation of human hematopoietic stem and progenitor cells (HSPCs) in vitro. (A) Myeloid cell fractions relative to the solvent control (y-axis) as determined immunophenotypically by flow cytometry depending on the used concentration of DETA/NO in the culture (x-axis). Myeloid progenitors were identified in the CD34+ CD38+ CD10 HSPC subset by their differential expression of CD135 and CD45RA, where CMPs, GMPs, and MEPs were CD135+ CD45RA, CD135+ CD45RA+, and CD135 CD45RA, respectively. (B) Myeloid progenitors as determined by a colony-forming unit (CFU) assay. The number of colonies per 500 plated cells (y-axis) is shown dependent on the DETA/NO concentration during culture (x-axis). Boxplot graphs display the median as a line across the boxes of n = 4 independent experiments with the mean shown as a plus. Lower and upper boxes indicate the 25th to the 75th percentile. Whiskers represent maximum and minimum values. Statistically significant intermean differences as per ANOVA (posttest for linear trend of the group means) are indicated as follows: *P < 0.05.
Figure 5
Figure 5
Nitric oxide (NO) signaling in human hematopoietic stem and progenitor cells (HSPCs) after in vitro culture with diethylenetriamine/nitric oxide adduct (DETA/NO). Activation of classical NO signaling was detected via intracellular cyclic guanosine monophosphate (cGMP) levels by a competitive enzyme-linked immunoassay. Substrate conversion was measured by absorbance and inversely correlates with intracellular cGMP levels. (A) Absorbance values relative to the control (y-axis) shown for up to 25 μM DETA/NO (x-axis). (B) Absorbance values (y-axis) after stimulation with 25 μM DETA/NO and/or preincubation with the NO scavenger cPTIO (x-axis). Classical NO signaling was further analyzed by vasodilator-stimulated phosphoprotein (VASP) phosphorylation at Ser239 as shown by a representative protein immunoblot after stimulation with (C) up to 20 μM DETA/NO and (D) 10 μM DETA/NO and/or after preincubation with cPTIO (Vinculin as a loading control). Gray values of VASP phosphorylation at Ser239 relative to the solvent control derived from protein immunoblots after stimulation of HSPCs with (E) up to 20 μM DETA/NO and (F) 10 μM DETA/NO and/or preincubation with DETA/NO. (G) Schematic illustration of NO-mediated signaling via the classical NO signaling pathway and s-nitrosylation. (H) Representative protein immunoblot of s-nitrosylation sites (marked by iodoTMT) after 5 days culture with up to 20 μM DETA/NO (Vinculin as loading control). Dot plots display the mean of n = 3 independent experiments with corresponding standard deviations as lines with error bars. Statistically significant intermean differences as per ANOVA (comparison of each column with the control) are indicated as follows: *P < 0.05; **P < 0.001. Curved brackets show linear trends with ***0.0001 < P < 0.001.
Figure 6
Figure 6
Schematic illustration of observed hematopoietic stem and progenitor cell (HSPC) responses after 5 days culture in the presence of the long-term NO donor diethylenetriamine/nitric oxide adduct (DETA/NO) in vitro (used concentrations and released levels of NO indicated by y-axis on the left side). NO-mediated signaling, which was detected in specific concentration ranges, is listed in the gray box with the concentration ranges illustrated by color-coded bars. Observed NO-mediated effects are specified in the yellow box (middle, statistically nonsignificant trends are displayed in italic), while a possible biological context for the observed effects is given in the green box (right side).

Similar articles

Cited by

References

    1. Ahern G. P., Klyachko V. A., Jackson M. B. (2002). cGMP and S-nitrosylation: two routes for modulation of neuronal excitability by NO. Trends Neurosci. 25, 510–517. 10.1016/S0166-2236(02)02254-3 - DOI - PubMed
    1. Aicher A., Heeschen C., Mildner-Rihm C., Urbich C., Ihling C., Technau-Ihling K., et al. . (2003). Essential role of endothelial nitric oxide synthase for mobilization of stem and progenitor cells. Nat. Med. 9, 1370–1376. 10.1038/nm948 - DOI - PubMed
    1. Asada N., Takeishi S., Frenette P. S. (2017). Complexity of bone marrow hematopoietic stem cell niche. Int. J. Hematol. 106, 45–54. 10.1007/s12185-017-2262-9 - DOI - PMC - PubMed
    1. Attar A. (2014). Changes in the cell surface markers during normal hematopoiesis: a guide to cell isolation. Global J. Hematol. Blood Trans. 1, 20–28. 10.15379/2408-9877.2014.01.01.4 - DOI
    1. Batista W. L., Ogata F. T., Curcio M. F., Miguel R. B., Arai R. J., Matsuo A. L., et al. . (2013). S-nitrosoglutathione and endothelial nitric oxide synthase-derived nitric oxide regulate compartmentalized ras S-nitrosylation and stimulate cell proliferation. Antioxid. Redox Signal. 18, 221–238. 10.1089/ars.2011.4455 - DOI - PubMed

LinkOut - more resources