

Differences in Calcium Clearance at Inner Hair Cell Active Zones May Underlie the Difference in Susceptibility to Noise-Induced Cochlea Synaptopathy of C57BL/6J and CBA/CaJ Mice
- PMID: 33634111
- PMCID: PMC7902005
- DOI: 10.3389/fcell.2020.635201
Differences in Calcium Clearance at Inner Hair Cell Active Zones May Underlie the Difference in Susceptibility to Noise-Induced Cochlea Synaptopathy of C57BL/6J and CBA/CaJ Mice
Abstract
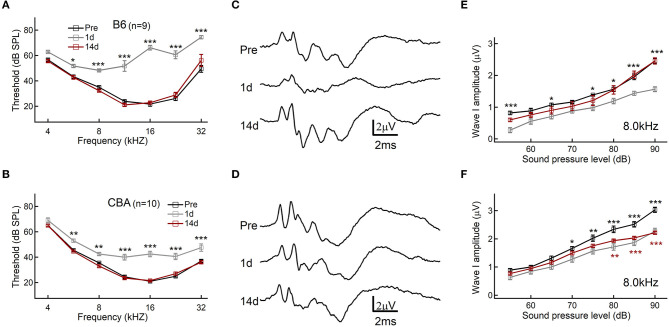
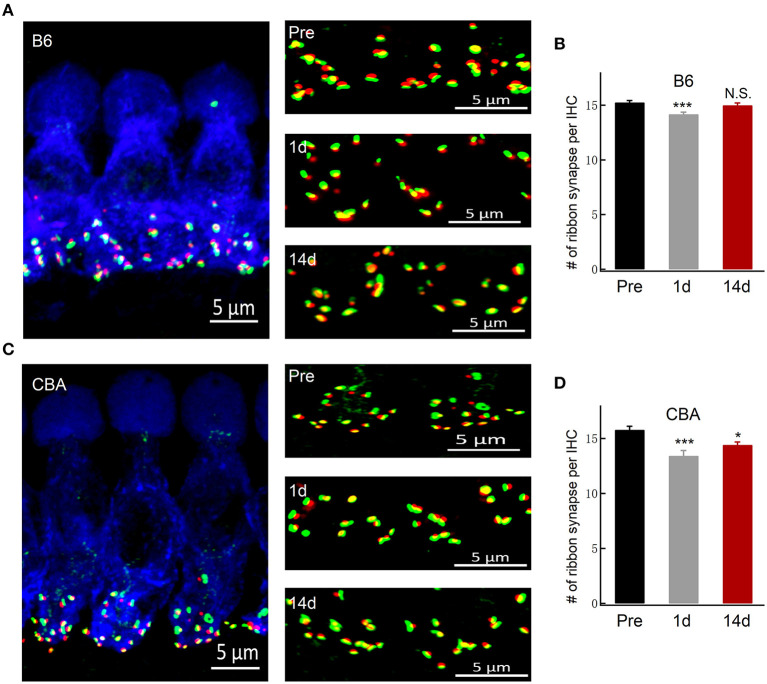
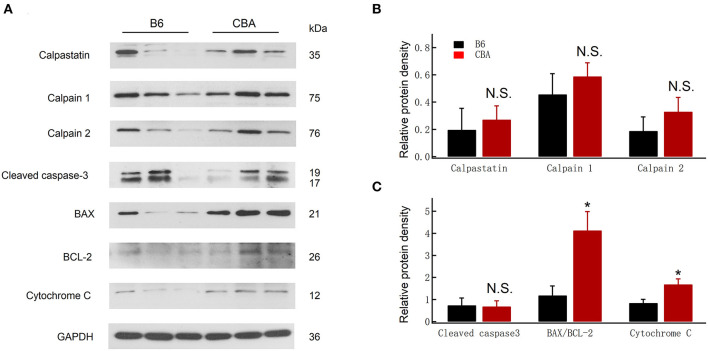
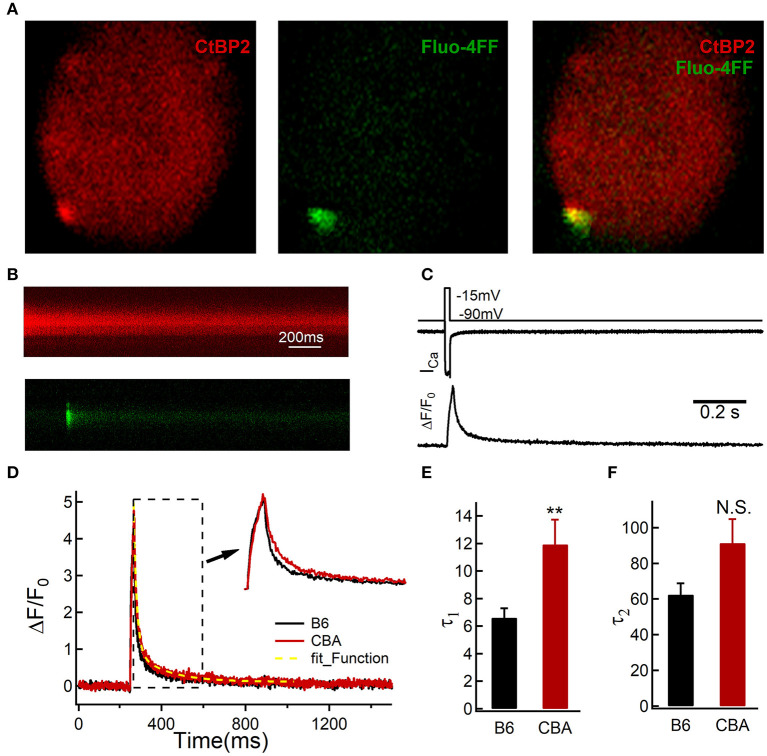
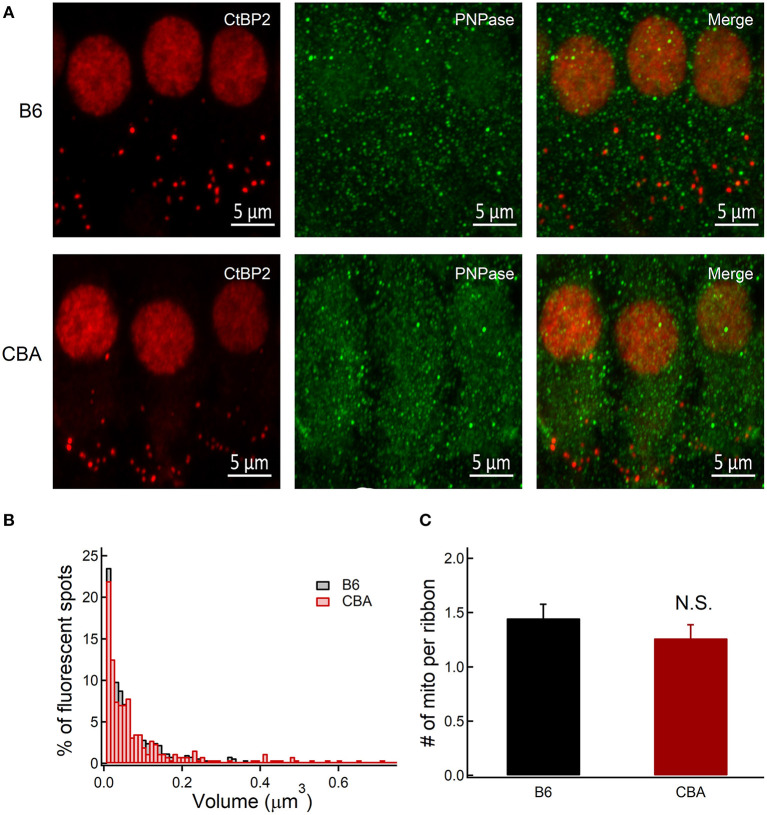
Noise exposure of a short period at a moderate level can produce permanent cochlear synaptopathy without seeing lasting changes in audiometric threshold. However, due to the species differences in inner hair cell (IHC) calcium current that we have recently discovered, the susceptibility to noise exposure may vary, thereby impact outcomes of noise exposure. In this study, we investigate the consequences of noise exposure in the two commonly used animal models in hearing research, CBA/CaJ (CBA) and C57BL/6J (B6) mice, focusing on the functional changes of cochlear IHCs. In the CBA mice, moderate noise exposure resulted in a typical fully recovered audiometric threshold but a reduced wave I amplitude of auditory brainstem responses. In contrast, both auditory brainstem response threshold and wave I amplitude fully recovered in B6 mice at 2 weeks after noise exposure. Confocal microscopy observations found that ribbon synapses of IHCs recovered in B6 mice but not in CBA mice. To further characterize the molecular mechanism underlying these different phenotypes in synaptopathy, we compared the ratio of Bax/Bcl-2 with the expression of cytochrome-C and found increased activity in CBA mice after noise exposure. Under whole-cell patch clamped IHCs, we acquired two-photon calcium imaging around the active zone to evaluate the Ca2+ clearance rate and found that CBA mice have a slower calcium clearance rate. Our results indicated that excessive accumulation of calcium due to acoustic overexposure and slow clearance around the presynaptic ribbon might lead to disruption of calcium homeostasis, followed by mitochondrial dysfunction of IHCs that cause susceptibility of noise-induced cochlear synaptopathy in CBA mice.
Keywords: calcium clearance; inner hair cell; mitochondrial; noise-induced cochlear synaptopathy; presynaptic ribbon.
Copyright © 2021 Liu, Peng, Wang, Xu, Wang, Liu and Wu.
Conflict of interest statement
The authors declare that the research was conducted in the absence of any commercial or financial relationships that could be construed as a potential conflict of interest.
Figures
Similar articles
-
Protection of cochlear synapses from noise-induced excitotoxic trauma by blockade of Ca2+-permeable AMPA receptors.Proc Natl Acad Sci U S A. 2020 Feb 18;117(7):3828-3838. doi: 10.1073/pnas.1914247117. Epub 2020 Feb 3. Proc Natl Acad Sci U S A. 2020. PMID: 32015128 Free PMC article.
-
Immediate and delayed cochlear neuropathy after noise exposure in pubescent mice.PLoS One. 2015 May 8;10(5):e0125160. doi: 10.1371/journal.pone.0125160. eCollection 2015. PLoS One. 2015. PMID: 25955832 Free PMC article.
-
Functional alteration of ribbon synapses in inner hair cells by noise exposure causing hidden hearing loss.Neurosci Lett. 2019 Aug 10;707:134268. doi: 10.1016/j.neulet.2019.05.022. Epub 2019 May 16. Neurosci Lett. 2019. PMID: 31103727
-
Genetic influences on susceptibility of the auditory system to aging and environmental factors.Scand Audiol Suppl. 1992;36:1-39. Scand Audiol Suppl. 1992. PMID: 1488615 Review.
-
Noise-Induced Cochlear Synaptopathy and Ribbon Synapse Regeneration: Repair Process and Therapeutic Target.Adv Exp Med Biol. 2019;1130:37-57. doi: 10.1007/978-981-13-6123-4_3. Adv Exp Med Biol. 2019. PMID: 30915700 Review.
Cited by
-
Putative COVID-19 therapies imatinib, lopinavir, ritonavir, and ivermectin cause hair cell damage: A targeted screen in the zebrafish lateral line.Front Cell Neurosci. 2022 Aug 24;16:941031. doi: 10.3389/fncel.2022.941031. eCollection 2022. Front Cell Neurosci. 2022. PMID: 36090793 Free PMC article.
-
Disruption of Hars2 in Cochlear Hair Cells Causes Progressive Mitochondrial Dysfunction and Hearing Loss in Mice.Front Cell Neurosci. 2021 Dec 15;15:804345. doi: 10.3389/fncel.2021.804345. eCollection 2021. Front Cell Neurosci. 2021. PMID: 34975414 Free PMC article.
-
Absence of oncomodulin increases susceptibility to noise-induced outer hair cell death and alters mitochondrial morphology.Front Neurol. 2024 Oct 23;15:1435749. doi: 10.3389/fneur.2024.1435749. eCollection 2024. Front Neurol. 2024. PMID: 39507624 Free PMC article.
-
Dose-Dependent Pattern of Cochlear Synaptic Degeneration in C57BL/6J Mice Induced by Repeated Noise Exposure.Neural Plast. 2021 Jun 9;2021:9919977. doi: 10.1155/2021/9919977. eCollection 2021. Neural Plast. 2021. PMID: 34221004 Free PMC article.
-
Early Changes in Exo- and Endocytosis in the EAE Mouse Model of Multiple Sclerosis Correlate with Decreased Synaptic Ribbon Size and Reduced Ribbon-Associated Vesicle Pools in Rod Photoreceptor Synapses.Int J Mol Sci. 2021 Oct 6;22(19):10789. doi: 10.3390/ijms221910789. Int J Mol Sci. 2021. PMID: 34639129 Free PMC article.
References
-
- Alvarado J. C., Fuentes-Santamaría V., Gabaldón-Ull M. C., Jareño-Flores T., Miller J. M., Juiz J. M. (2016). Noise-induced “toughening” effect in wistar rats: enhanced auditory brainstem responses are related to calretinin and nitric oxide synthase upregulation. Front. Neuroanat. 10:19. 10.3389/fnana.2016.00019 - DOI - PMC - PubMed
LinkOut - more resources
Full Text Sources
Other Literature Sources
Research Materials
Miscellaneous