

A novel DNA methylation-based model that effectively predicts prognosis in hepatocellular carcinoma
- PMID: 33634306
- PMCID: PMC7955104
- DOI: 10.1042/BSR20203945
A novel DNA methylation-based model that effectively predicts prognosis in hepatocellular carcinoma
Abstract
Purpose: To build a novel predictive model for hepatocellular carcinoma (HCC) patients based on DNA methylation data.
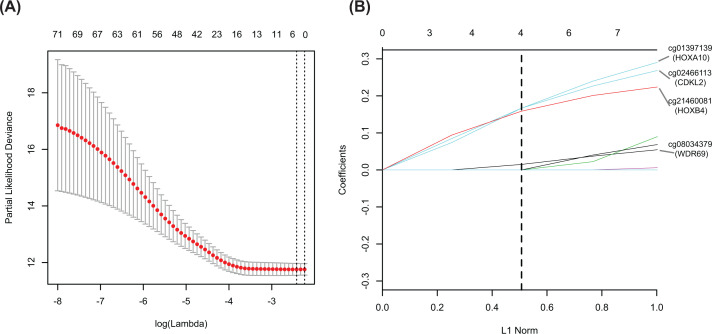
Methods: Four independent DNA methylation datasets for HCC were used to screen for common differentially methylated genes (CDMGs). Gene Ontology (GO) enrichment, and Kyoto Encyclopedia of Genes and Genomes (KEGG) pathway enrichment analysis were used to explore the biological roles of CDMGs in HCC. Univariate Cox analysis and least absolute shrinkage and selection operator (LASSO) Cox analysis were performed to identify survival-related CDMGs (SR-CDMGs) and to build a predictive model. The importance of this model was assessed using Cox regression analysis, propensity score-matched (PSM) analysis and stratification analysis. A validation group from the Cancer Genome Atlas (TCGA) was constructed to further validate the model.
Results: Four SR-CDMGs were identified and used to build the predictive model. The risk score of this model was calculated as follows: risk score = (0.01489826 × methylation level of WDR69) + (0.15868618 × methylation level of HOXB4) + (0.16674959 × methylation level of CDKL2) + (0.16689301 × methylation level of HOXA10). Kaplan-Meier analysis demonstrated that patients in the low-risk group had a significantly longer overall survival (OS; log-rank P-value =0.00071). The Cox model multivariate analysis and PSM analysis identified the risk score as an independent prognostic factor (P<0.05). Stratified analysis results further confirmed this model performed well. By analyzing the validation group, the results of receiver operating characteristic (ROC) curve analysis and survival analysis further validated this model.
Conclusion: Our DNA methylation-based prognosis predictive model is effective and reliable in predicting prognosis for patients with HCC.
Keywords: DNA methylation; GEO; TCGA; hepatocellular carcinoma; prognosis.
© 2021 The Author(s).
Conflict of interest statement
The authors declare that there are no competing interests associated with the manuscript.
Figures


Similar articles
-
Mining prognostic markers of Asian hepatocellular carcinoma patients based on the apoptosis-related genes.BMC Cancer. 2021 Feb 18;21(1):175. doi: 10.1186/s12885-021-07886-6. BMC Cancer. 2021. PMID: 33602168 Free PMC article.
-
Construction and Validation of a Prognostic Gene-Based Model for Overall Survival Prediction in Hepatocellular Carcinoma Using an Integrated Statistical and Bioinformatic Approach.Int J Mol Sci. 2021 Feb 5;22(4):1632. doi: 10.3390/ijms22041632. Int J Mol Sci. 2021. PMID: 33562824 Free PMC article.
-
[Construction of a prognostic model for hepatocellular carcinoma based on pyroptosis-related genes].Zhonghua Gan Zang Bing Za Zhi. 2023 May 20;31(5):509-517. doi: 10.3760/cma.j.cn501113-20220223-00086. Zhonghua Gan Zang Bing Za Zhi. 2023. PMID: 37365028 Chinese.
-
Mining Prognostic Biomarkers of Hepatocellular Carcinoma Based on Immune-Associated Genes.DNA Cell Biol. 2020 Apr;39(4):499-512. doi: 10.1089/dna.2019.5099. Epub 2020 Feb 18. DNA Cell Biol. 2020. PMID: 32069130 Review.
-
DNA methylation markers in the detection of hepatocellular carcinoma.Eur J Cancer. 2023 Sep;191:112960. doi: 10.1016/j.ejca.2023.112960. Epub 2023 Jun 28. Eur J Cancer. 2023. PMID: 37473464 Review.
Cited by
-
Comprehensive Analysis of DNA Methylation and Transcriptome to Identify PD-1-Negative Prognostic Methylated Signature in Endometrial Carcinoma.Dis Markers. 2022 May 18;2022:3085289. doi: 10.1155/2022/3085289. eCollection 2022. Dis Markers. 2022. PMID: 35634444 Free PMC article.
-
DNA methylation-driven genes in hepatocellular carcinoma patients: insights into immune infiltration and prognostic implications.Front Med (Lausanne). 2025 Apr 28;12:1520380. doi: 10.3389/fmed.2025.1520380. eCollection 2025. Front Med (Lausanne). 2025. PMID: 40357287 Free PMC article.
-
Screening for aberrantly methylated and differentially expressed genes in nonalcoholic fatty liver disease of hepatocellular carcinoma patients with cirrhosis.World J Surg Oncol. 2022 Nov 18;20(1):364. doi: 10.1186/s12957-022-02828-3. World J Surg Oncol. 2022. PMID: 36397165 Free PMC article.
-
Genome-wide DNA methylation analysis identifies potent CpG signature for temzolomide response in non-G-CIMP glioblastomas with unmethylated MGMT promoter: MGMT-dependent roles of GPR81.CNS Neurosci Ther. 2024 Apr;30(4):e14465. doi: 10.1111/cns.14465. Epub 2023 Oct 13. CNS Neurosci Ther. 2024. PMID: 37830163 Free PMC article.
References
Publication types
MeSH terms
Substances
LinkOut - more resources
Full Text Sources
Other Literature Sources
Medical
Research Materials
Miscellaneous