Review
. 2021 Feb;36(2):179-196.
doi: 10.1007/s10654-021-00727-7. Epub 2021 Feb 25.

How to detect and reduce potential sources of biases in studies of SARS-CoV-2 and COVID-19

Affiliations
Review

How to detect and reduce potential sources of biases in studies of SARS-CoV-2 and COVID-19

Emma K Accorsi et al. Eur J Epidemiol. 2021 Feb.

Abstract

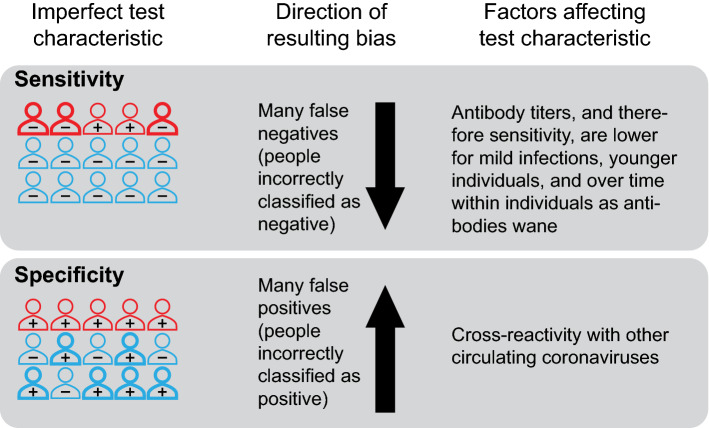
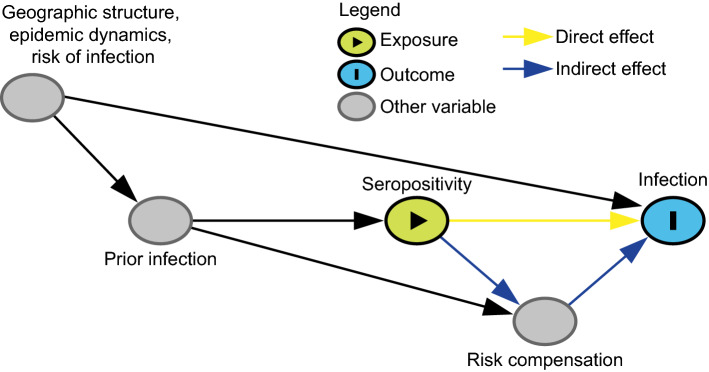
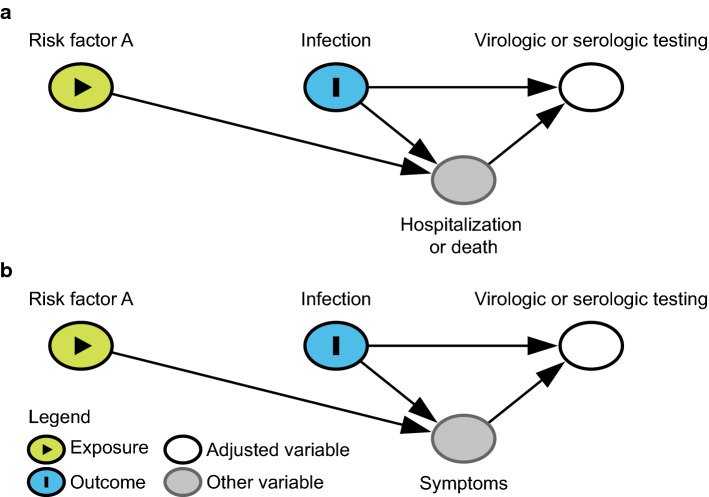
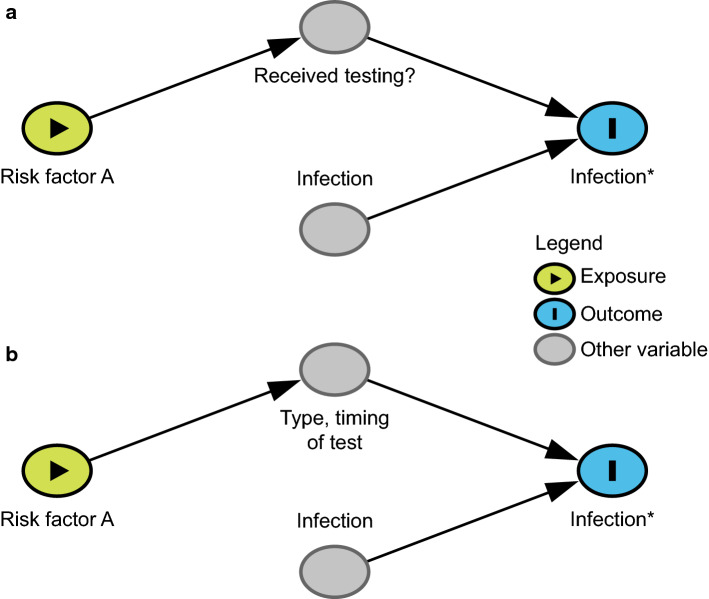
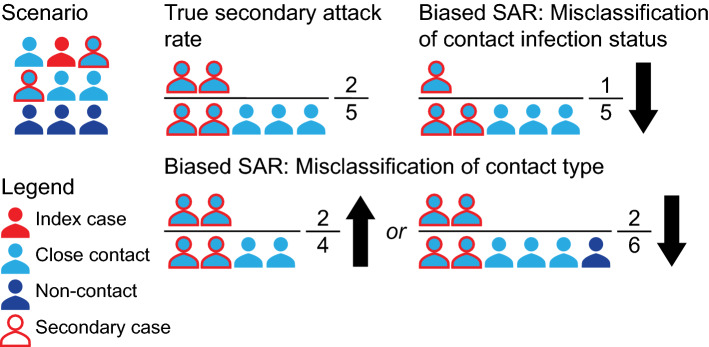
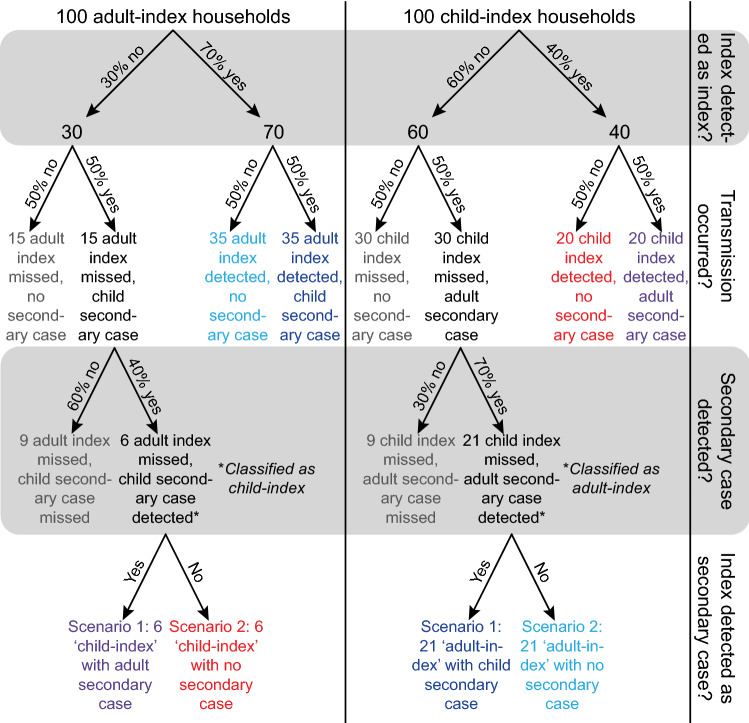
In response to the coronavirus disease (COVID-19) pandemic, public health scientists have produced a large and rapidly expanding body of literature that aims to answer critical questions, such as the proportion of the population in a geographic area that has been infected; the transmissibility of the virus and factors associated with high infectiousness or susceptibility to infection; which groups are the most at risk of infection, morbidity and mortality; and the degree to which antibodies confer protection to re-infection. Observational studies are subject to a number of different biases, including confounding, selection bias, and measurement error, that may threaten their validity or influence the interpretation of their results. To assist in the critical evaluation of a vast body of literature and contribute to future study design, we outline and propose solutions to biases that can occur across different categories of observational studies of COVID-19. We consider potential biases that could occur in five categories of studies: (1) cross-sectional seroprevalence, (2) longitudinal seroprotection, (3) risk factor studies to inform interventions, (4) studies to estimate the secondary attack rate, and (5) studies that use secondary attack rates to make inferences about infectiousness and susceptibility.

Keywords: COVID-19; Epidemiological biases; Measurement error; Misclassification; Observational data; Selection bias.


Conflict of interest statement

ML reports grants from NIH/NIGMS, during the conduct of the study; personal fees from Affinivax, personal fees from Merck, grants and personal fees from Pfizer, grants from PATH Vaccine Solutions, outside the submitted work.

Figures

Fig. 1
Fig. 1
Schematic showing recruitment-based biases in a hypothetical serosurvey. This figure shows a hypothetical serosurvey that aims to measure the underlying seroprevalence in the entire population of a geographic region and performs recruitment among shoppers at a grocery store. Outline color represents prior SARS-CoV-2 infection status (red for prior infection, blue for no prior infection). Ascertainment bias occurs because (1) individuals recruited at the grocery store are likely at slightly higher risk of COVID-19 than average (since individuals who are isolated at home and rarely grocery shop are less likely to be sampled), and (2) nursing home residents and other populations in congregate settings are excluded from the sample. Among individuals present at the grocery store, volunteer bias occurs when individuals who believe they have been infected participate in order to receive testing. Meanwhile, individuals who do not think they have been infected may avoid testing
Fig. 2
Fig. 2
Biases due to misclassification by SARS-CoV-2 antibody tests. The sensitivity of a SARS-CoV-2 antibody test is the probability the test is positive given an individual has been infected with the virus, while the specificity is the probability of a negative test given an individual has not been infected with SARS-CoV-2. Test performance is imperfect; low sensitivity can result in an estimate of cumulative incidence that is too low (as individuals with prior infection are misclassified as negative), and low specificity can result in an estimate of cumulative incidence that is too high (as individuals without prior infection are misclassified as positive). Outline color represents prior SARS-CoV-2 infection status (red for prior infection, blue for no prior infection). The annotation (“+” or “−”) indicates the result of a test for SARS-CoV-2 antibodies. Bold outlines indicate individuals who are misclassified by the test
Fig. 3
Fig. 3
The relative importance of test sensitivity and specificity depends on the underlying seroprevalence in the study population. The value of a test can be described through the positive predictive value (PPV), which is defined as the probability that an individual truly has been infected with the virus given that they test positive and is calculated as the number of true positives divided by the total number of positive tests. Similarly, the negative predictive value (NPV) is defined as the probability that an individual truly has not been infected with the virus given that they test negative and is calculated as the number of true negatives divided by the total number of negative tests. When the underlying seroprevalence is low, test performance is largely a function of specificity, as the majority of individuals in the population have not been infected, while sensitivity is more important as seroprevalence increases. Note that the negative predictive values for the baseline and low specificity tests are very similar so the curves nearly overlap in the figure
Fig. 4
Fig. 4
Directed acyclic graph under the alternative hypothesis showing confounding in the estimation of seroprotection. This figure shows the causal relationship between important variables that influence the infection status of an individual. To analyze the effect of seropositivity on the risk of infection, we would need to adjust for geographic structure, epidemic dynamics, the risk of infection and any other variables that are confounders of this exposure-outcome relationship. The effect of seropositivity on infection risk may be mediated by behavior change (induced by knowledge of serostatus) that affects the risk of infection. Disentangling direct (biological) effects of seropositivity and indirect effects through risk compensation is not straight-forward. Geographic structure, epidemic dynamics, and risk of infection are likely or guaranteed confounders of the relationship between seropositivity and future infection. For the purposes of illustrating this particular bias, the directed acyclic graph is drawn under the strong assumption of no additional unmeasured confounding; however, a study of seroprotection, like any observational study, may have other common causes of the exposure (seropositivity) and the outcome (future infection) and it is important to think carefully about additional confounders given unique study settings and designs
Fig. 5
Fig. 5
Directed acyclic graph under the null hypothesis showing the possible structure of selection bias due to a exclusion from testing and b differential likelihood of testing. Under the null hypothesis (of no effect of Risk Factor A on COVID-19 infection) selection bias can be in either direction depending on whether Risk Factor A increases or decreases the likelihood of (a) severe disease or (b) symptoms among infected individuals. The figures are simplified to illustrate these particular biases so make the strong assumption of no additional unmeasured confounding (i.e., no common causes of any two variables in the figure)
Fig. 6
Fig. 6
Directed acyclic graph under the null hypothesis showing differential misclassification by a whether an individual is tested and b the timing or type of test. A study is trying to determine the relationship between Risk Factor A and observed infection status (Infection*), where observed infection status is a proxy for the variable of interest, true infection status (Infection). If (a) Risk Factor A influences whether someone is tested and all non-tested individuals are assumed to be uninfected or (b) Risk Factor A affects the type of test and timing of testing conducted then under the null hypothesis of no effect of Risk Factor A on COVID-19 rates misclassification can cause upward or downward bias. The figures are simplified to illustrate these particular biases, and therefore make the strong assumption of no additional unmeasured confounding (i.e., no common causes of any two variables in the figure)
Fig. 7
Fig. 7
Illustration of index case misclassification where the index and secondary cases are misclassified in a household scenario. In this scenario (top left), each individual has close contacts with every other household member, and the red arrows indicate infections transmitted by the true index case (red individual) to other household members. The true SAR is shown in the top right; the infected contacts of the true index are in the numerator and all contacts are in the denominator. Index case misclassification can happen if one of the secondary cases of the index is falsely identified as the index case (yellow individual). This may cause no bias in the estimation of the SAR value; however, the interpretation of this SAR may be incorrect because we mistakenly attribute the SAR to the false index case, who may have different characteristics, such as age, from the true index case. It can also introduce downward bias if the true index is no longer detected by PCR by the time they are tested (bottom right)
Fig. 8
Fig. 8
Illustration of index case misclassification when multiple index cases are present but only one is identified as the index case. As shown in the top left, two index cases (red and purple individuals) acquired the infection and transmitted it (red and purple arrows) to other household members. As members of a household are often considered to all be in contact with one another, we cannot distinguish who truly infected whom. The true SARs for each index case are shown in the top. The numerator consists of infected contacts and the denominator consists of all contacts. Upward bias in the SAR can be introduced by falsely attributing all infections, including the other index case, to one of the two index cases
Fig. 9
Fig. 9
Illustration of misclassification of contact type and contact infection status. As shown in the top left, an infected individual infects some of their close contacts. The true SAR is represented in the top middle; the infected contacts are in the numerator and all close contacts are in the denominator. Bias due to misclassification of contact type can go in both directions. Bias is in the upward direction if some close contacts are missed during contact-tracing (bottom middle), and in the downward direction if non-close contacts are falsely considered as close contacts (bottom right). Misclassification of contact infection status can happen when close contacts are not appropriately tested or followed-up and creates downward bias (top right)
Fig. 10
Fig. 10
Illustration of differential detection of infection in adults and children. Flowcharts of infection and detection are presented in the diagram. Households shown in the same colors represent the same results, no matter whether they are true or misclassified. Households in grey remain completely undetected. We consider a simplified example for intergenerational household transmission; all households are composed of one adult and one child, so that the only transmission opportunity is to one individual of the other age category. We use 100 households with an adult index case (left column), and 100 households with a child index (right column). This scenario is drawn under the null hypothesis of equal infectiousness of adults and children, and both age groups transmit the infection half (50%) of the time. The only difference between infected adults and children is the probability that they are detected, reflecting differential symptom presentation. We assume that 70% of adults and 40% of children are detected (the numbers chosen are illustrative and the key information is that adults are more likely to be detected). Additionally, we assume that testing works perfectly (i.e., all contacts are tested and identified accurately) and no testing is triggered by contacts outside of the household. We consider two scenarios when an index case is missed and their secondary case is detected. In both scenarios the secondary case is falsely considered to be the index case and the true index is tested as a potential secondary case. In scenario 1, the true index can still be detected and will falsely be considered a secondary case of the false index. In scenario 2, the true index can no longer be detected and the false index will be considered to have not infected anyone. The SARs under both scenarios are calculated in Table 1, which shows that the differential detection of infections in adults and children creates a bias that can go in either direction. Under scenario 1, the SAR is higher for adult indices than for child indices, while for scenario 2 the SAR is higher for child indices than for adult indices

Similar articles

Cited by

References

    1. Teixeira da Silva JA, Tsigaris P, Erfanmanesh M. Publishing volumes in major databases related to Covid-19. Scientometrics. 2020;126:831–842. doi: 10.1007/s11192-020-03675-3. - DOI - PMC - PubMed
    1. Else H. How a torrent of COVID science changed research publishing—in seven charts. Nature. 2020;588:553. doi: 10.1038/d41586-020-03564-y. - DOI - PubMed
    1. Takahashi S, Greenhouse B, Rodríguez-Barraquer I. Are SARS-CoV-2 seroprevalence estimates biased? J Infect Dis. 2020 doi: 10.1093/infdis/jiaa523. - DOI - PMC - PubMed
    1. Addetia A, Crawford KH, Dingens A, Zhu H, Roychoudhury P, Huang M-L, et al. Neutralizing antibodies correlate with protection from SARS-CoV-2 in humans during a fishery vessel outbreak with high attack rate. medRxiv. 2020 doi: 10.1101/2020.08.13.20173161. - DOI - PMC - PubMed
    1. Kahn R, Kennedy-Shaffer L, Grad YH, Robins JM, Lipsitch M. Potential biases arising from epidemic dynamics in observational seroprotection studies. Am J Epidemiol. 2020 doi: 10.1093/aje/kwaa188. - DOI - PMC - PubMed