

Dissociation Between Long-term Weight Loss Intervention and Blood Pressure: an 18-month Randomized Controlled Trial
- PMID: 33634382
- PMCID: PMC8342649
- DOI: 10.1007/s11606-021-06655-2
Dissociation Between Long-term Weight Loss Intervention and Blood Pressure: an 18-month Randomized Controlled Trial
Abstract
Background: Obesity is associated with elevated blood pressure (BP). In patients with obesity and hypertension, weight loss lowers BP, but the long-term effect of weight loss on BP is less clear.
Objective: We aimed to assess the effect of long-term weight loss intervention on BP in normotensive and hypertensive subjects.
Design: Randomized controlled trial.
Participants: Two hundred seventy-eight subjects (mean age 47.9 ± 9.3 years, 89% male, 56% hypertensive) with abdominal obesity or elevated serum triglycerides and low high-density lipoprotein cholesterol were recruited.
Intervention: Eighteen-month weight loss intervention.
Main measures: Body weight and BP were measured at baseline, after 6 and 18 months.
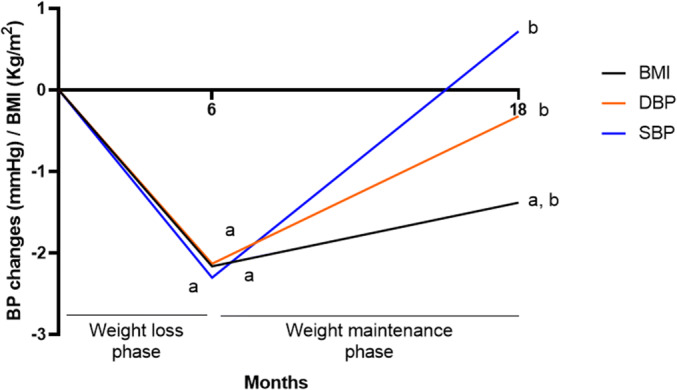
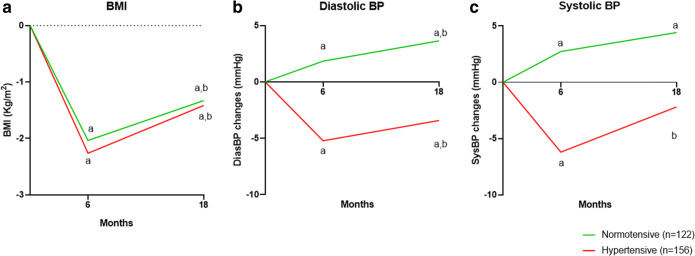
Results: After 6 months of intervention, in the weight loss phase, body mass index (BMI) decreased by an average of -2.2±1.5 kg/m2 (p<0.001) and both diastolic BP (DBP) and systolic BP (SBP) decreased by -2.1±8.8 mmHg and -2.3±12.9 mmHg, respectively (p<0.01 for both). The change in BMI was similar in normotensive and hypertensive subjects (-2.0±1.6 and -2.3±1.5, p = 0.246). However, DBP and SBP decreased significantly (-5.2±7.1 mmHg and -6.2±12.5 mmHg, respectively, p<0.001 for both) in hypertensive subjects, and increased in normotensive subjects (1.8±9.3 mmHg, p = 0.041 and 2.7±11.7 mmHg, p = 0.017, respectively). After 18 months, in the weight maintenance phase, BMI slightly increased (0.9±1.3 kg/m2, p<0.001) but remained significantly lower than at baseline (p<0.0001). Unlike BMI, DBP and SBP increased significantly in hypertensive subjects (p<0.001) and returned almost to baseline levels.
Conclusion: Weight-loss intervention reduced BP in hypertensive patients, but this was not maintained in the long run.
Clinical trial registration: ClinicalTrials.gov Identifier: NCT01530724.
Keywords: blood pressure; body mass index; hypertension; randomized controlled trial; weight loss.
© 2021. Society of General Internal Medicine.
Conflict of interest statement
All authors have no relevant conflict of interest to disclose and have approved the final article.
Figures
Similar articles
-
An exercise training combined with dietary program for patients with hypertension.Bangladesh Med Res Counc Bull. 1998 Apr;24(1):14-9. Bangladesh Med Res Counc Bull. 1998. PMID: 9776870 Clinical Trial.
-
Impact of a Patient-Centered Behavioral Economics Intervention on Hypertension Control in a Highly Disadvantaged Population: a Randomized Trial.J Gen Intern Med. 2020 Jan;35(1):70-78. doi: 10.1007/s11606-019-05269-z. Epub 2019 Sep 12. J Gen Intern Med. 2020. PMID: 31515735 Free PMC article. Clinical Trial.
-
Effects of acute blood pressure elevation on biochemical-metabolic parameters in individuals with hypertensive crisis.Clin Exp Hypertens. 2017;39(6):553-561. doi: 10.1080/10641963.2017.1291661. Epub 2017 Jun 1. Clin Exp Hypertens. 2017. PMID: 28569557
-
Effect of weight loss on blood pressure changes in overweight patients: A systematic review and meta-analysis.J Clin Hypertens (Greenwich). 2023 May;25(5):404-415. doi: 10.1111/jch.14661. Epub 2023 May 4. J Clin Hypertens (Greenwich). 2023. PMID: 37141231 Free PMC article.
-
Long-term changes in blood pressure following orlistat and sibutramine treatment: a meta-analysis.Obes Rev. 2010 Nov;11(11):777-91. doi: 10.1111/j.1467-789X.2009.00693.x. Obes Rev. 2010. PMID: 20025693 Review.
Cited by
-
Risks of obesity and diabetes development in the population of the Ivano-Frankivsk region in Ukraine.EXCLI J. 2023 Sep 25;22:1047-1054. doi: 10.17179/excli2023-6296. eCollection 2023. EXCLI J. 2023. PMID: 37927345 Free PMC article.
-
Evaluation and Treatment of Obesity and Its Comorbidities: 2022 Update of Clinical Practice Guidelines for Obesity by the Korean Society for the Study of Obesity.J Obes Metab Syndr. 2023 Mar 30;32(1):1-24. doi: 10.7570/jomes23016. Epub 2023 Mar 22. J Obes Metab Syndr. 2023. PMID: 36945077 Free PMC article. Review.
-
Efficacy of Meal Replacement Products on Weight and Glycolipid Metabolism Management: A 90-Day Randomized Controlled Trial in Adults with Obesity.Nutrients. 2024 Sep 28;16(19):3284. doi: 10.3390/nu16193284. Nutrients. 2024. PMID: 39408251 Free PMC article. Clinical Trial.
-
Increased Risk of Cardiometabolic Disease in Ideal Weight Adults With History of Overweight/Obesity in China: A Prospective Cohort Study.J Am Heart Assoc. 2024 May 7;13(9):e033610. doi: 10.1161/JAHA.123.033610. Epub 2024 May 3. J Am Heart Assoc. 2024. PMID: 38700033 Free PMC article.
-
Positive correlation between body weight and body mass index with blood pressure in young adults.Narra J. 2024 Apr;4(1):e533. doi: 10.52225/narra.v4i1.533. Epub 2024 Apr 30. Narra J. 2024. PMID: 38798838 Free PMC article.
References
-
- Whelton PK, Carey RM, Aronow WS, et al. 2017 ACC/AHA/AAPA/ABC/ACPM/AGS/APhA/ASH/ASPC/NMA/PCNA Guideline for the Prevention, Detection, Evaluation, and Management of High Blood Pressure in Adults: A Report of the American College of Cardiology/American Heart Association Task Force on Clinical Practice Guidelines. J Am Coll Cardiol. 2018;71:e127–e248. doi: 10.1016/j.jacc.2017.11.006. - DOI - PubMed
Publication types
MeSH terms
Associated data
LinkOut - more resources
Full Text Sources
Other Literature Sources
Medical
