

Measurement of cellular-interstitial water exchange time in tumors based on diffusion-time-dependent diffusional kurtosis imaging
- PMID: 33634508
- PMCID: PMC8170918
- DOI: 10.1002/nbm.4496
Measurement of cellular-interstitial water exchange time in tumors based on diffusion-time-dependent diffusional kurtosis imaging
Abstract
Purpose: To assess the feasibility of using diffusion-time-dependent diffusional kurtosis imaging (tDKI) to measure cellular-interstitial water exchange time (τex ) in tumors, both in animals and in humans.
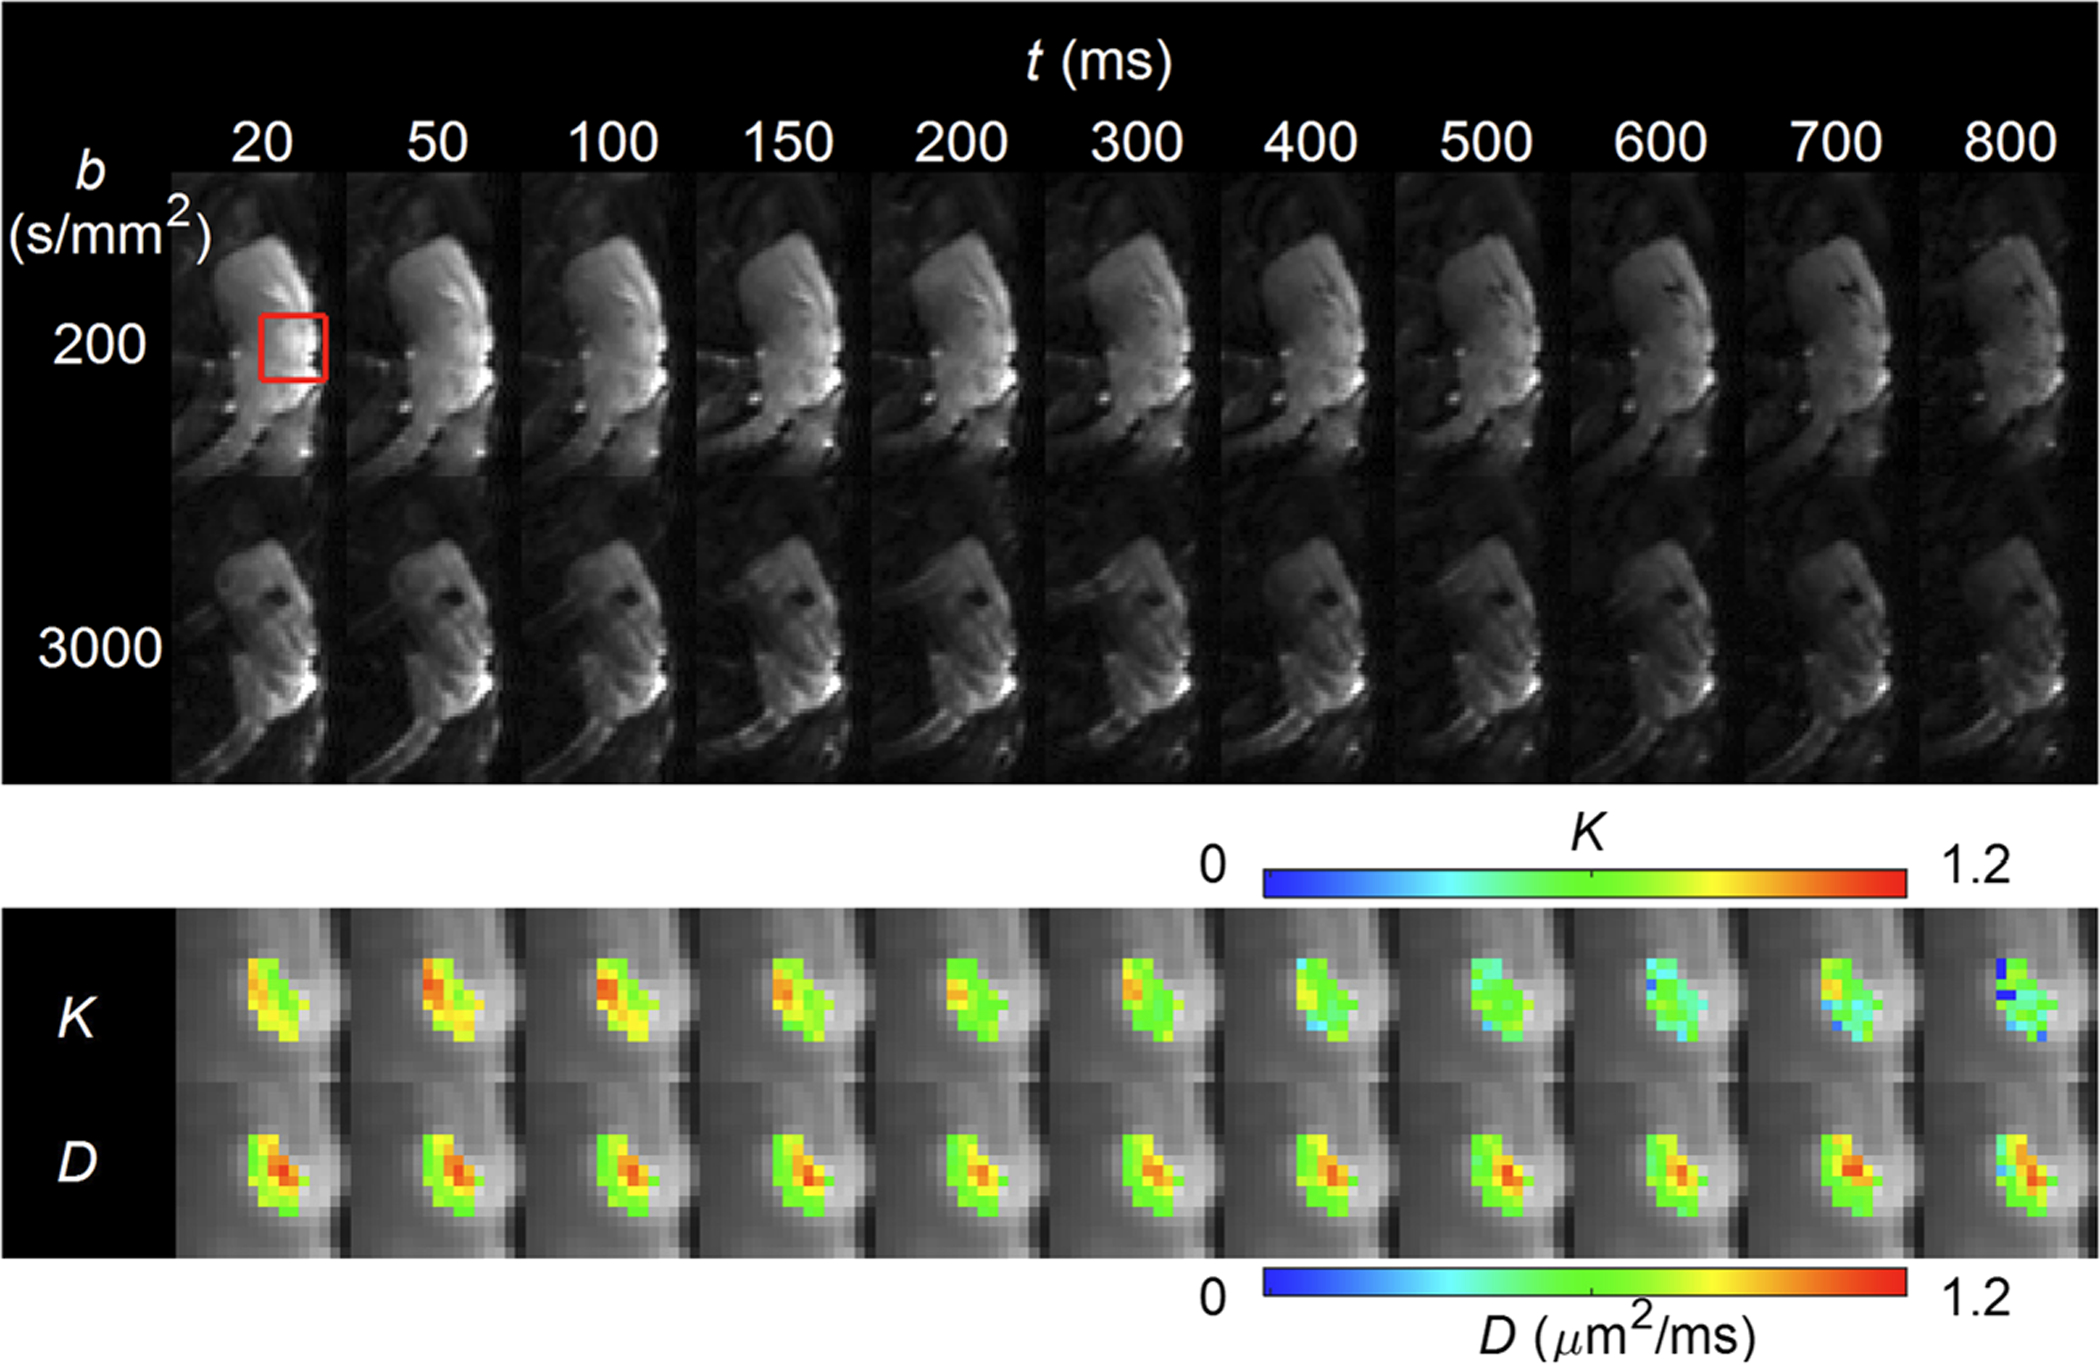
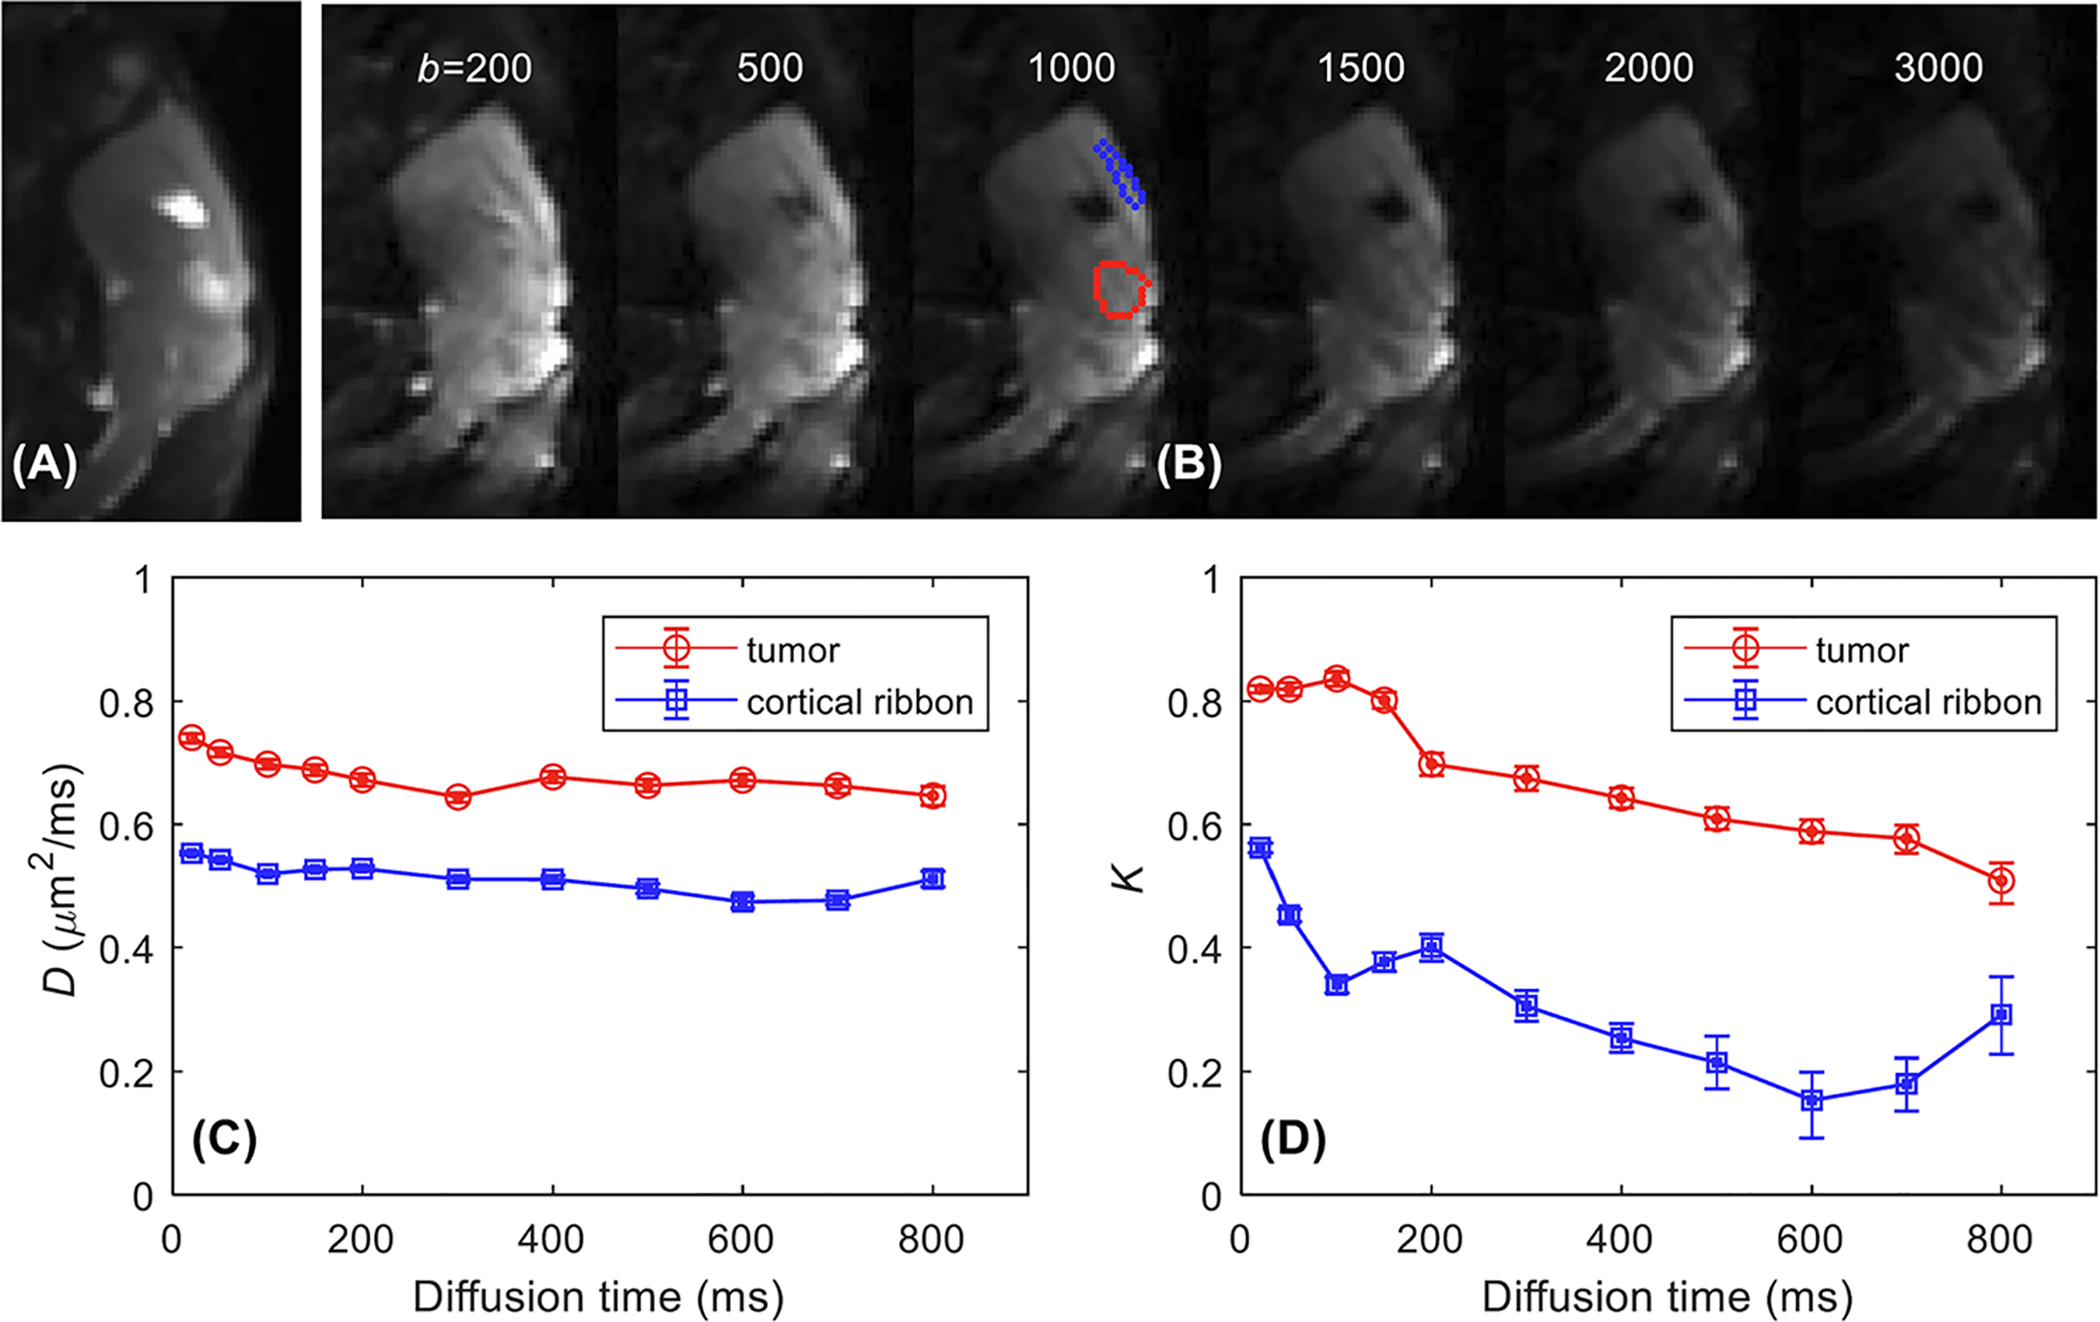
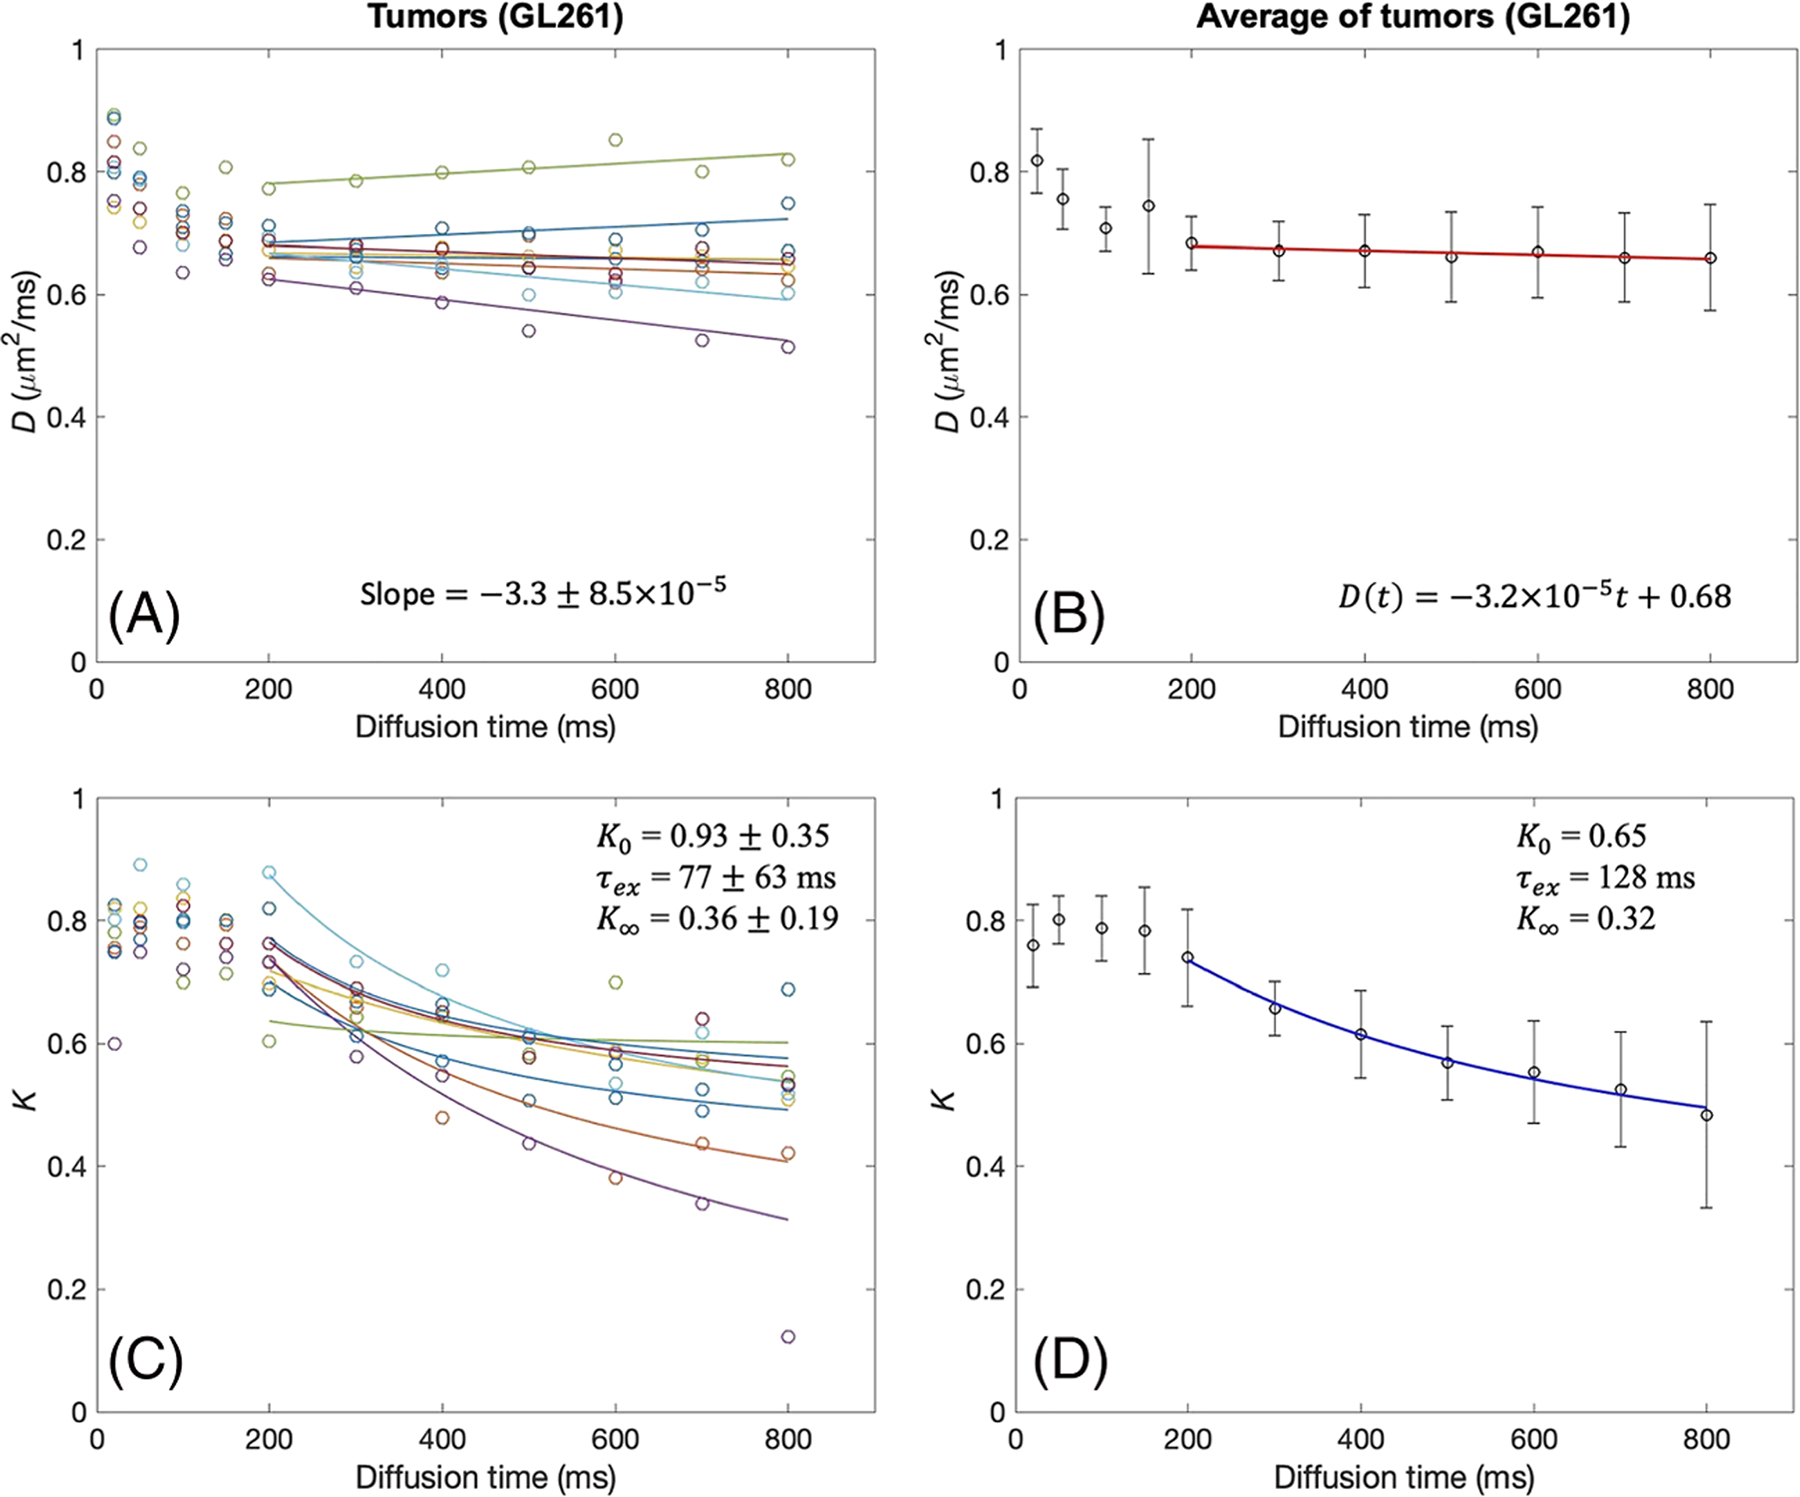
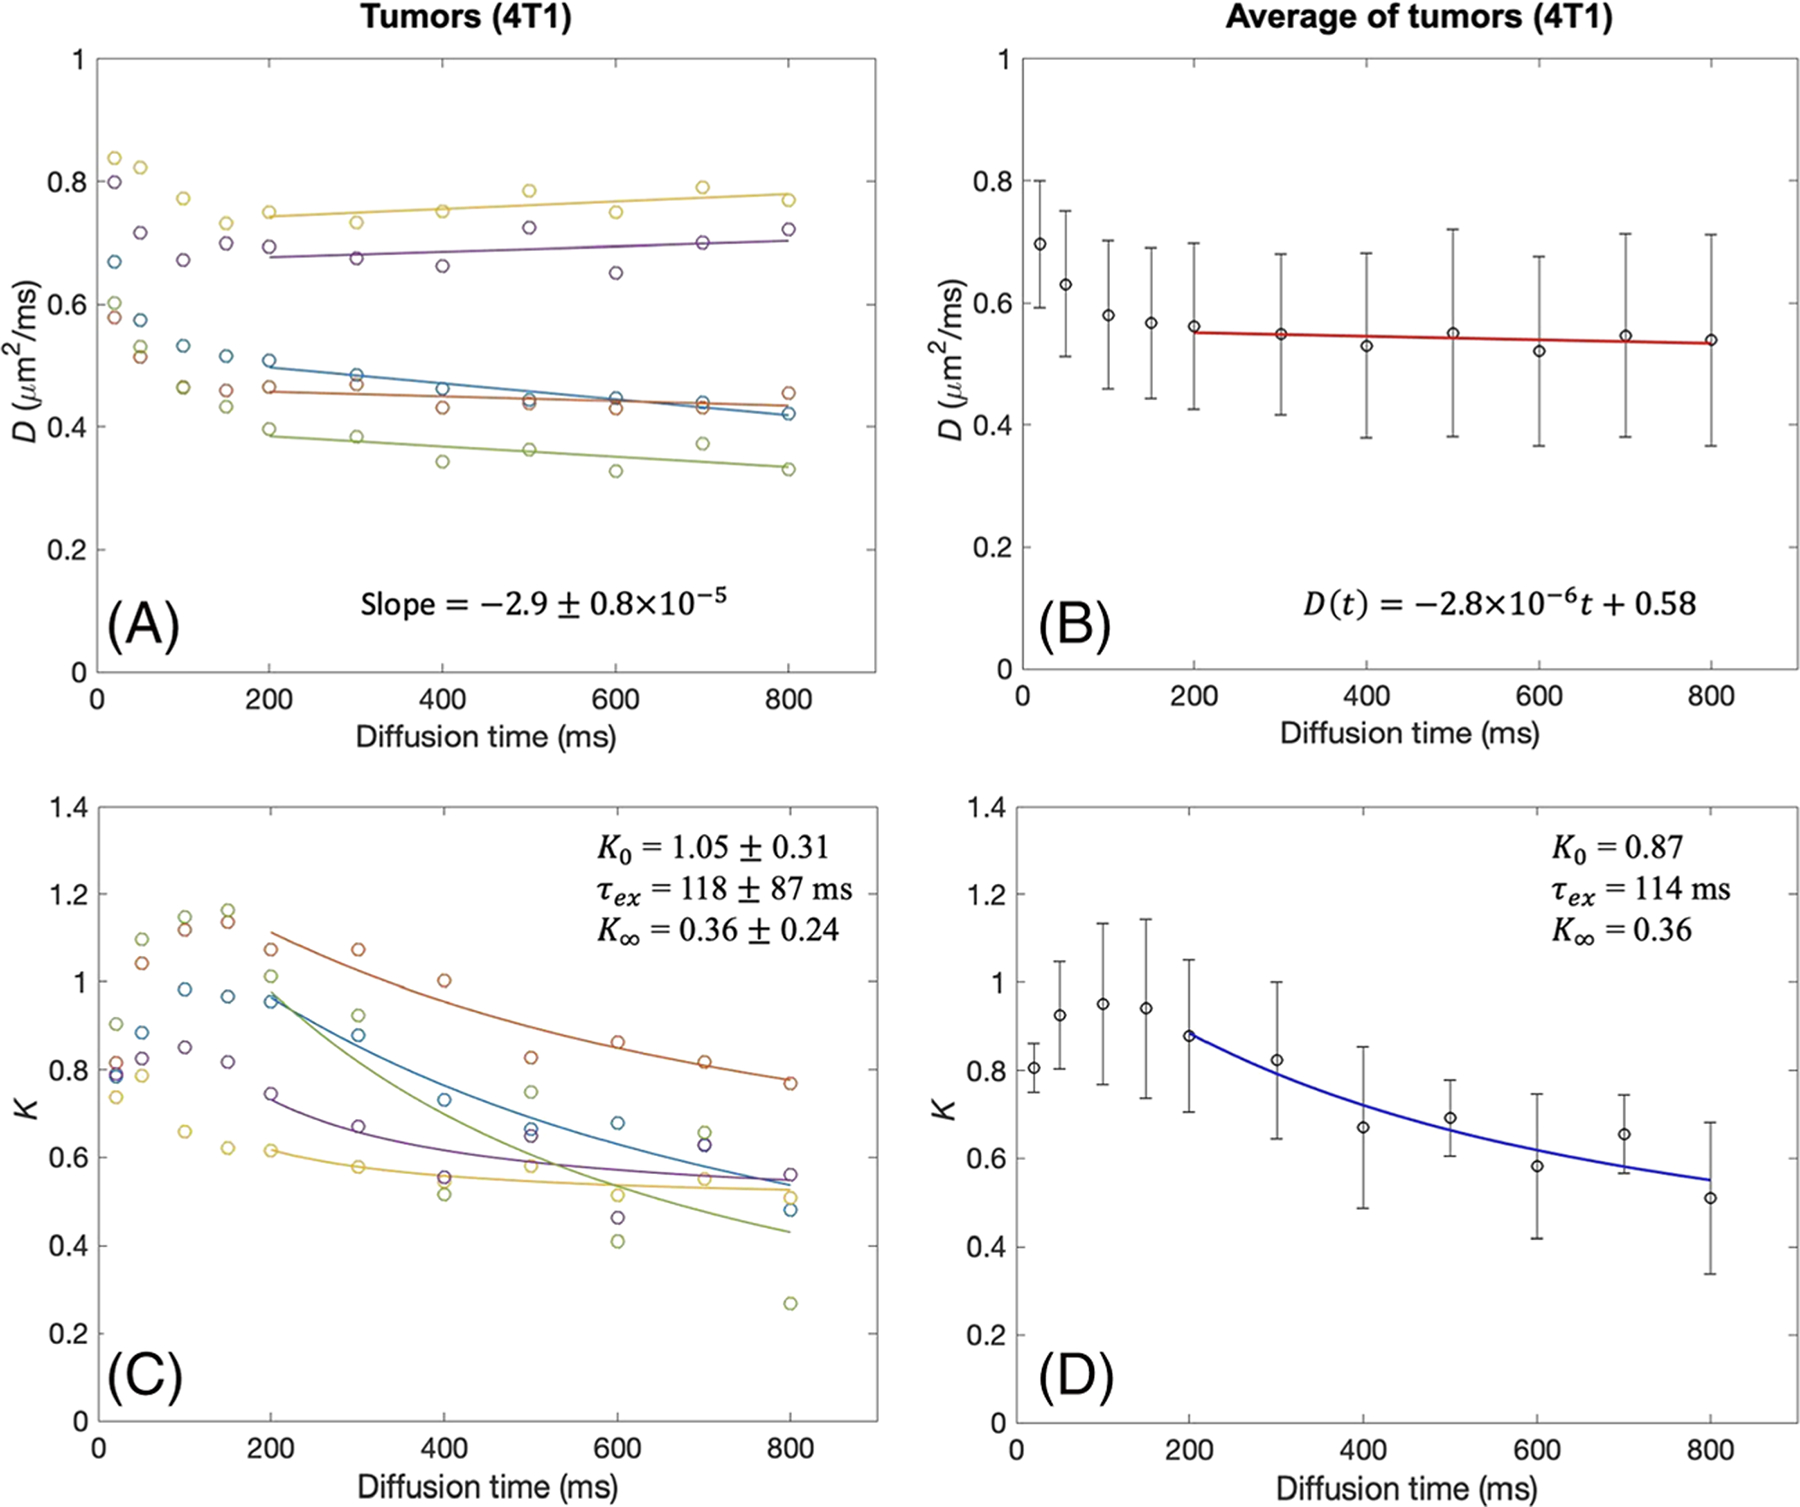
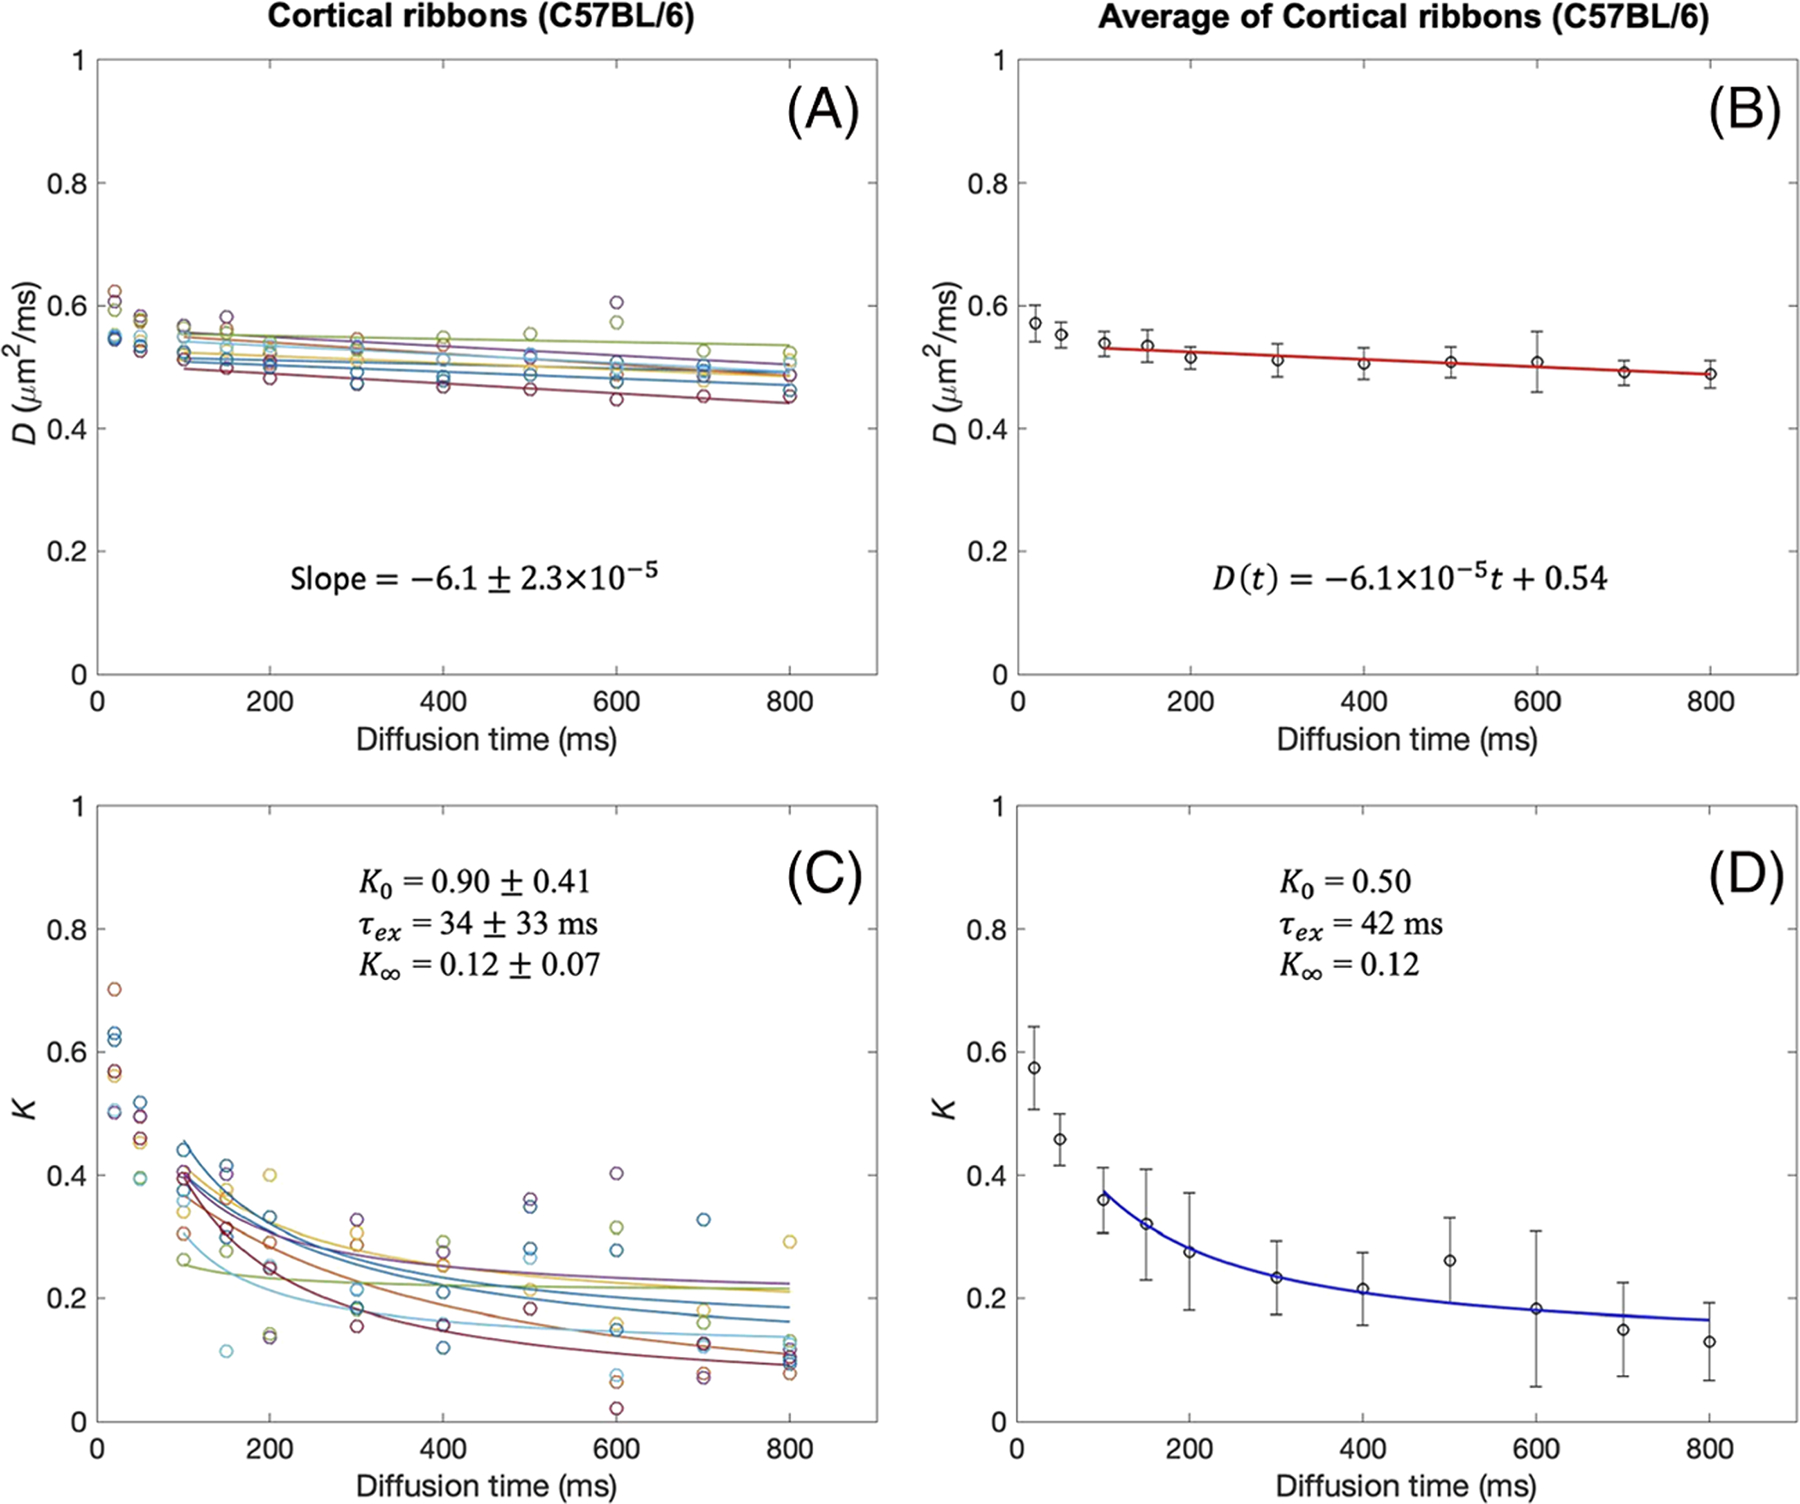
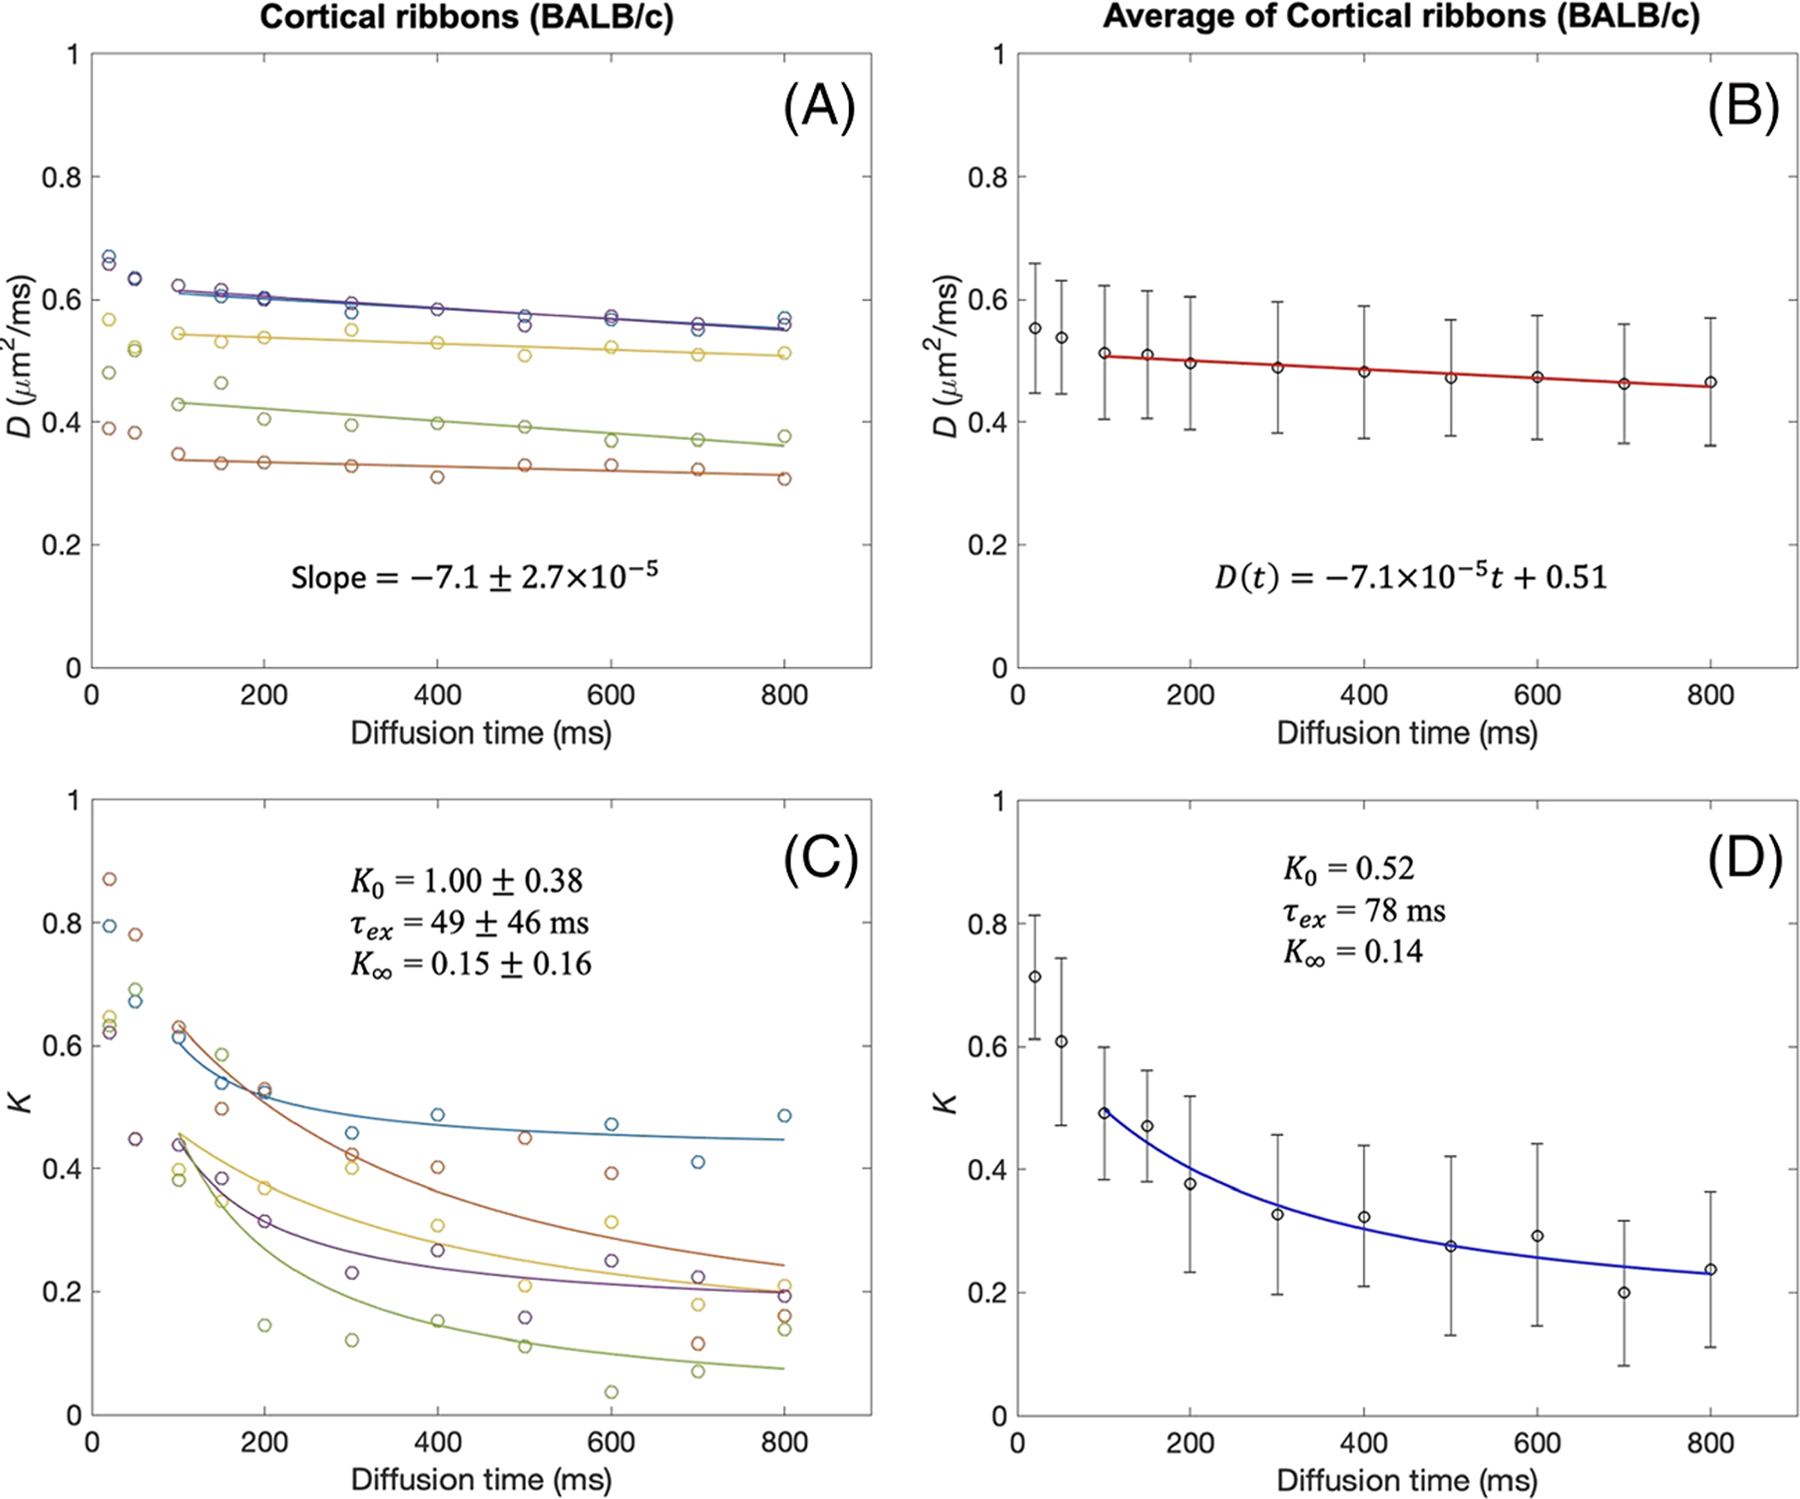
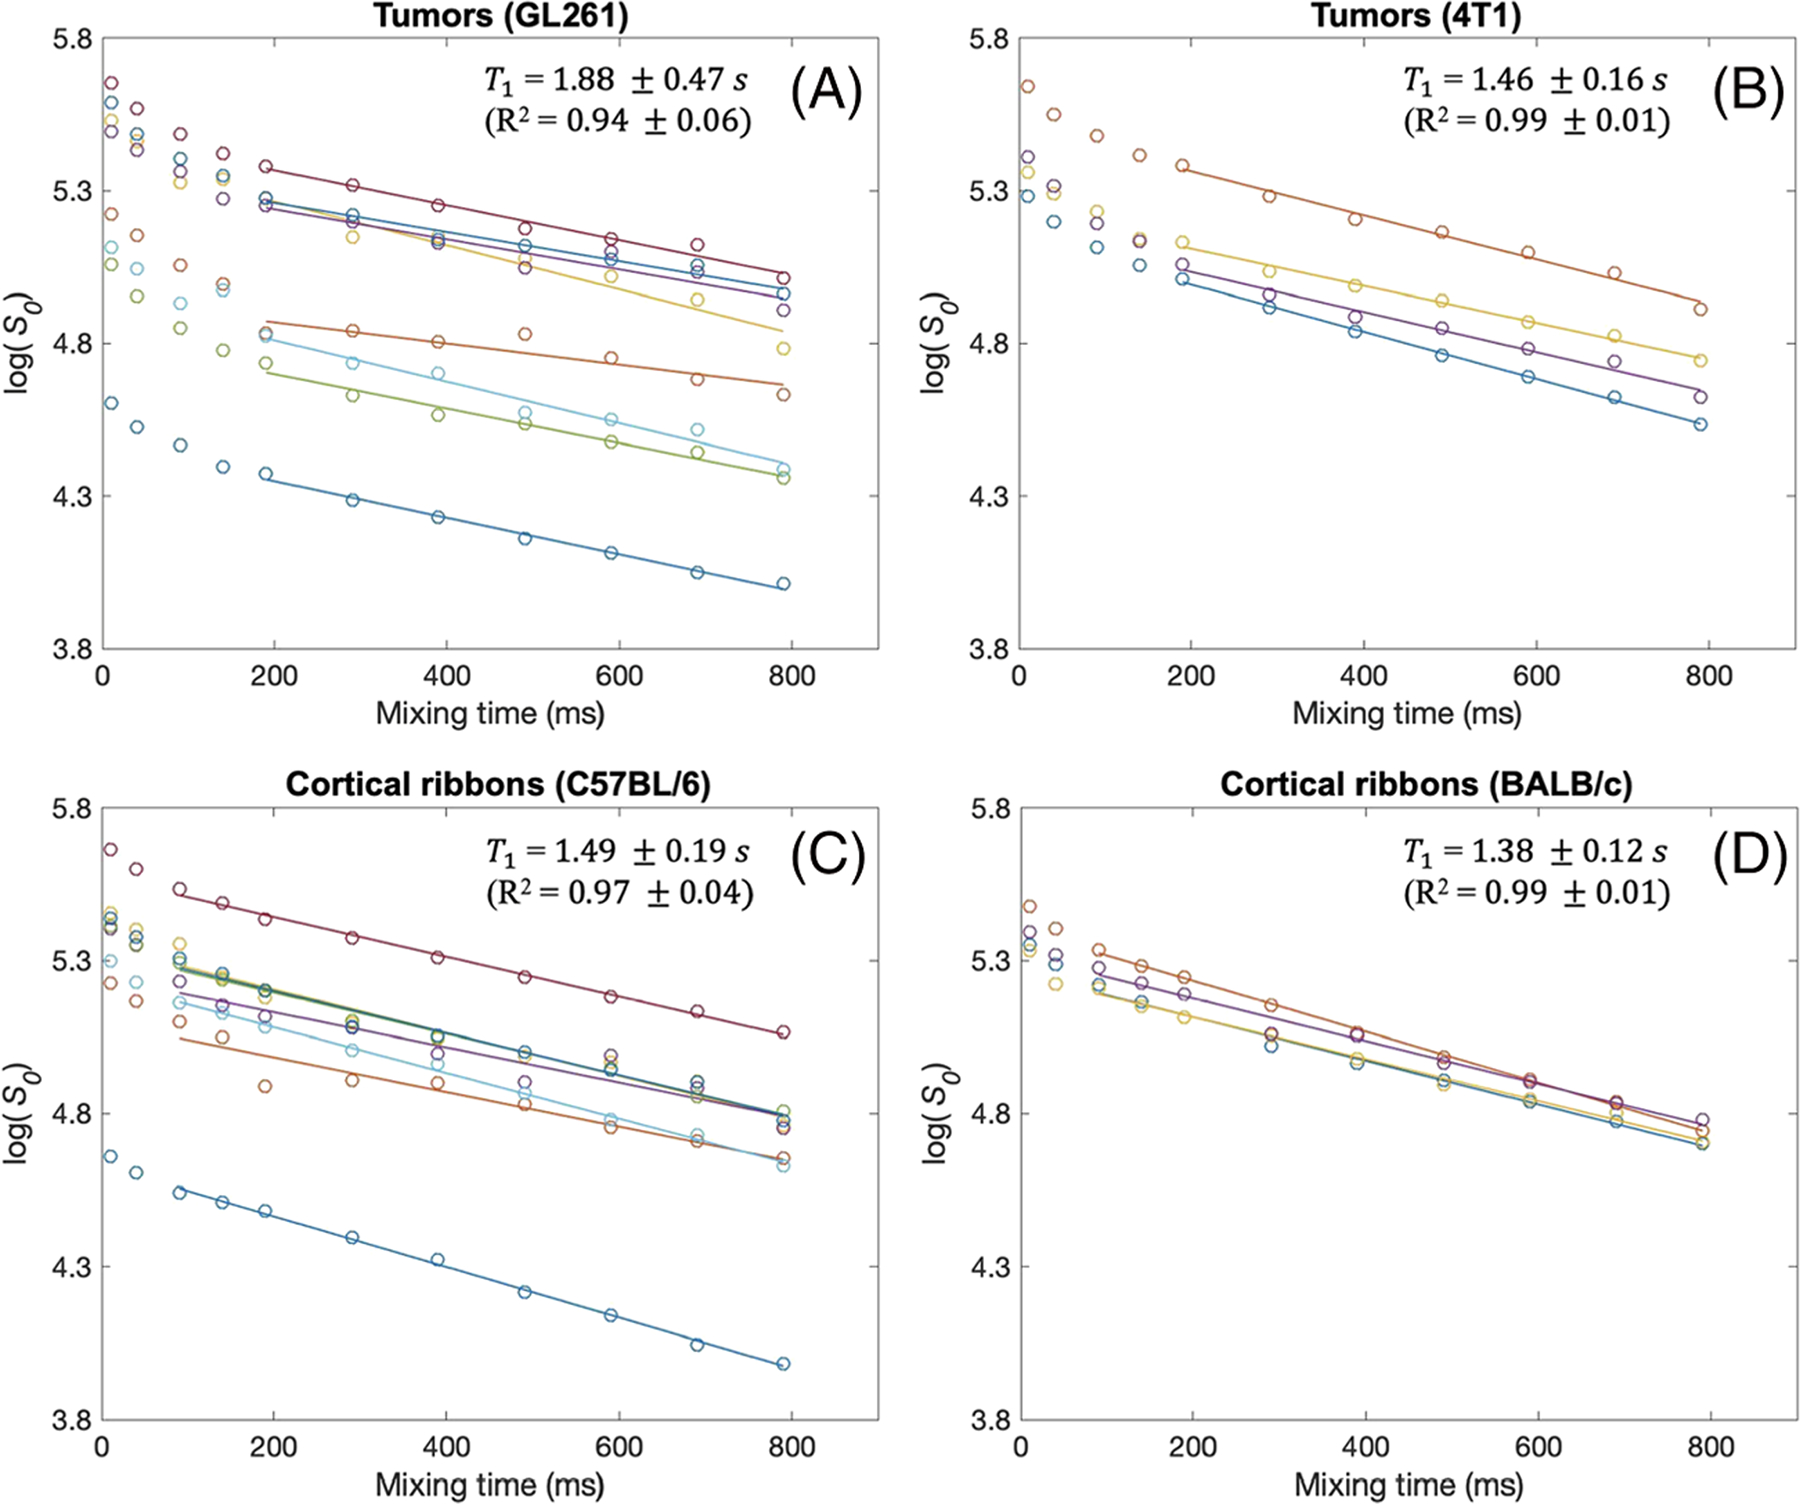
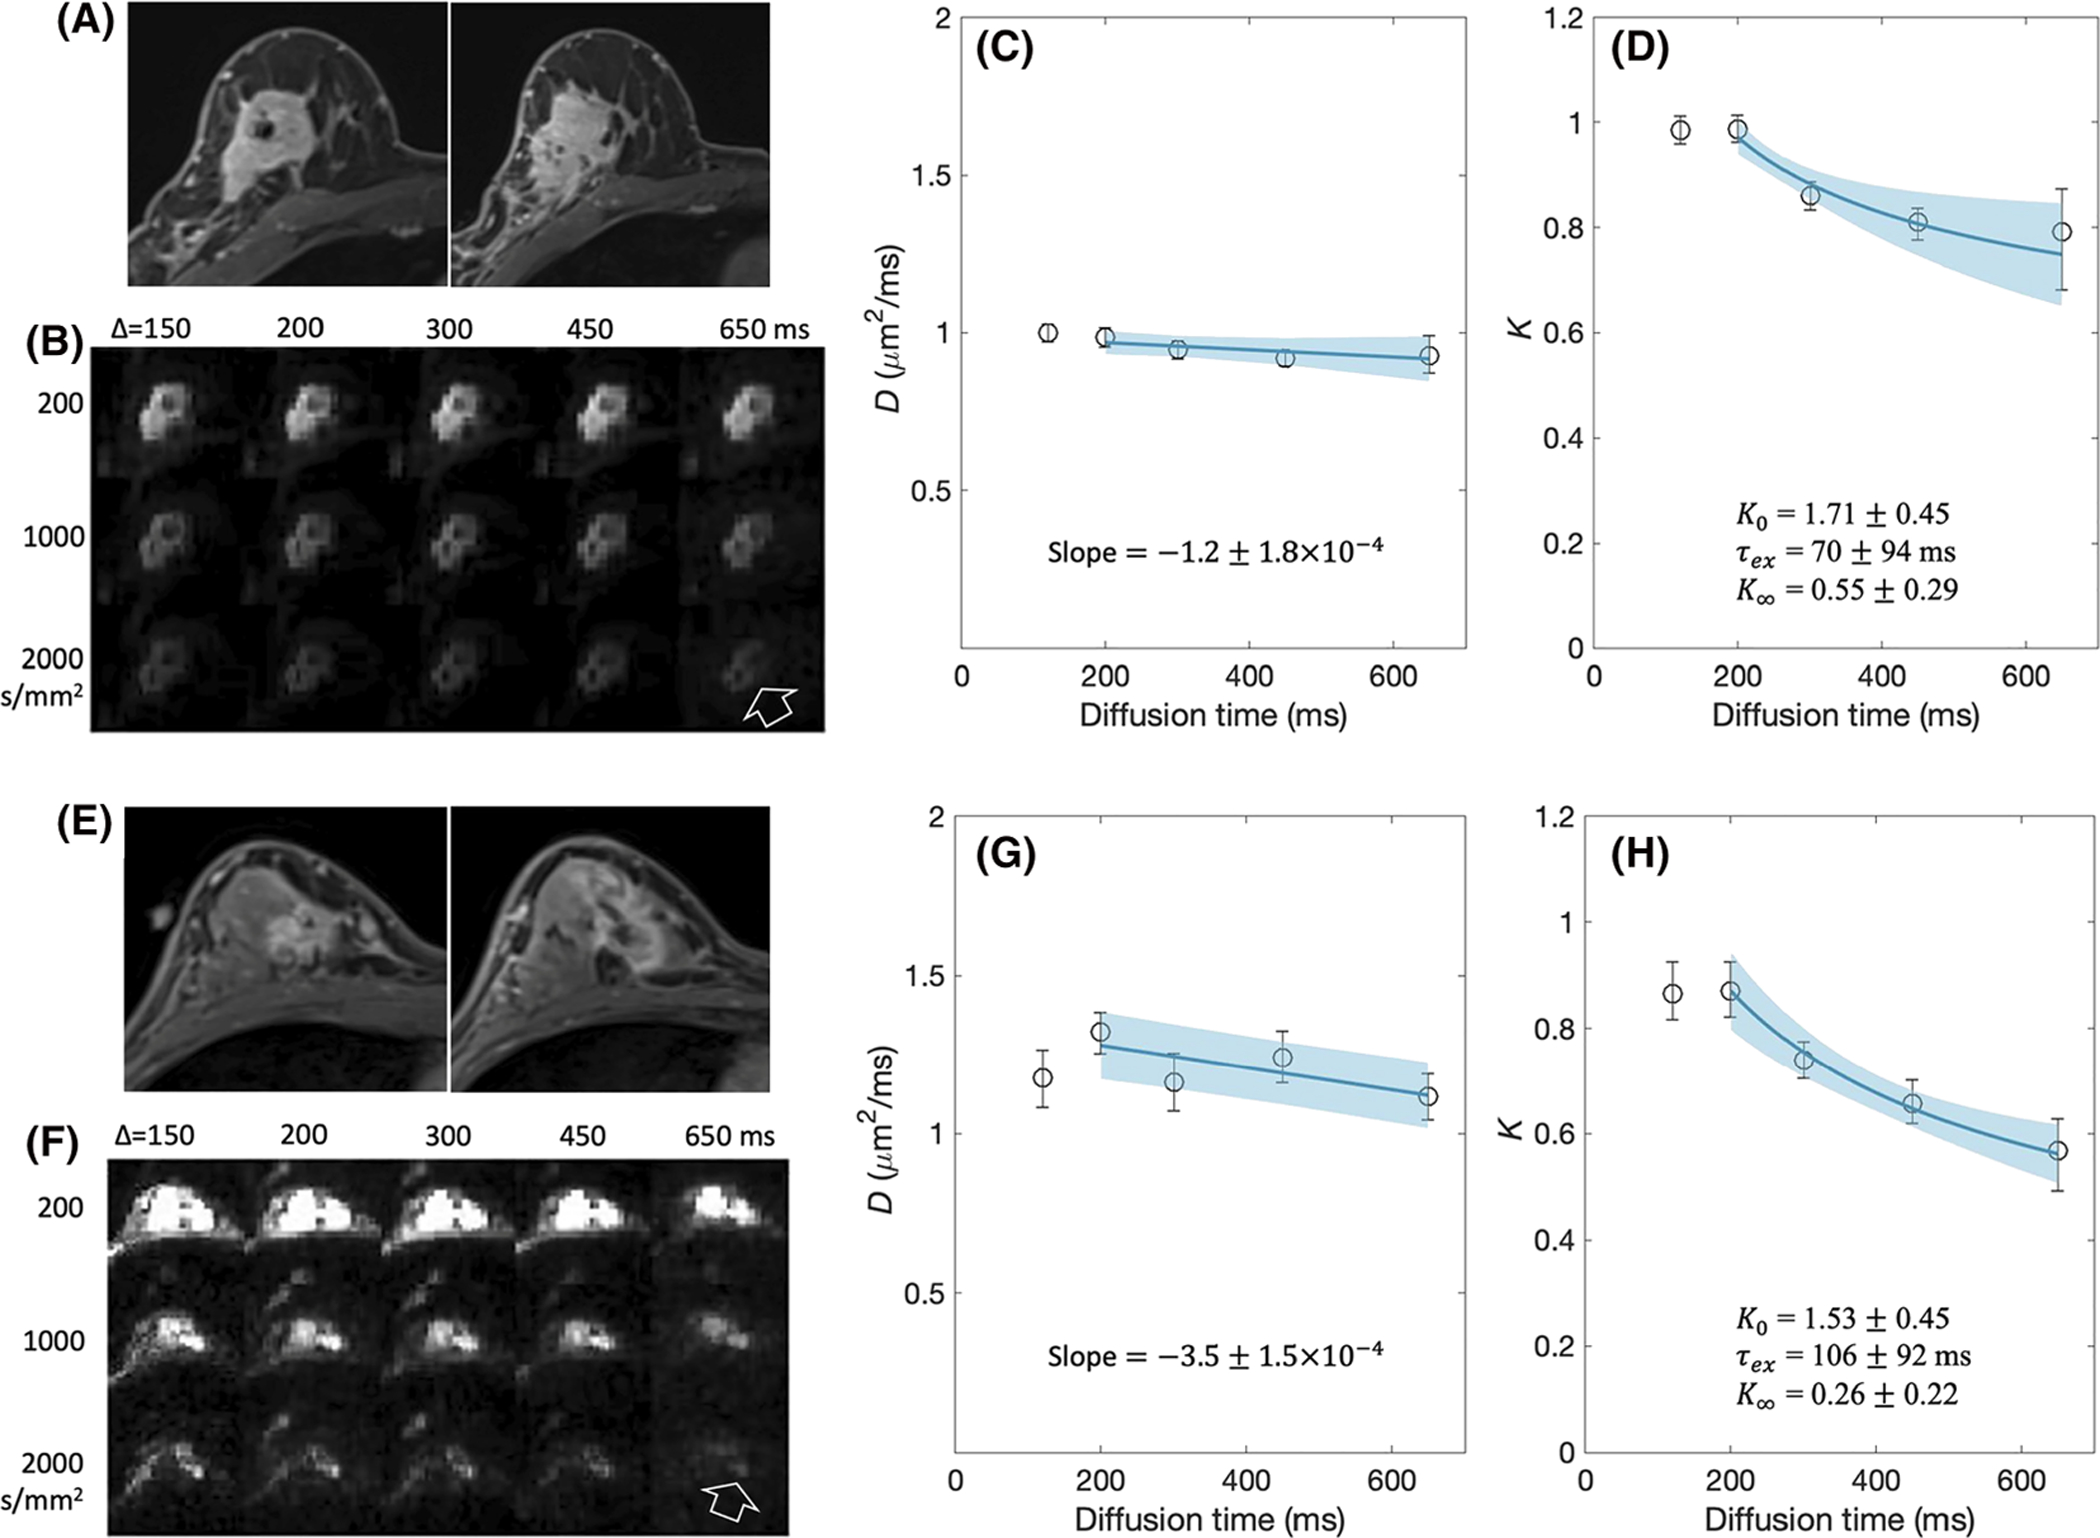
Methods: Preclinical tDKI studies at 7 T were performed with the GL261 glioma model and the 4T1 mammary tumor model injected into the mouse brain. Clinical studies were performed at 3 T with women who had biopsy-proven invasive ductal carcinoma. tDKI measurement was conducted using a diffusion-weighted STEAM pulse sequence with multiple diffusion times (20-800 ms) at a fixed echo time, while keeping the b-values the same (0-3000 s/mm2 ) by adjusting the diffusion gradient strength. The tDKI data at each diffusion time t were used for a weighted linear least-squares fit method to estimate the diffusion-time-dependent diffusivity, D(t), and diffusional kurtosis, K(t).
Results: Both preclinical and clinical studies showed that, when diffusion time t ≥ 200 ms, D(t) did not have a noticeable change while K(t) decreased monotonically with increasing diffusion time in tumors and t ≥ 100 ms for the cortical ribbon of the mouse brain. The estimated τex averaged median and interquartile range (IQR) of GL261 and 4T1 tumors were 93 (IQR = 89) ms and 68 (78) ms, respectively. For the cortical ribbon, the estimated τex averaged median and IQR were 41 (34) ms for C57BL/6 and 30 (17) ms for BALB/c. For invasive ductal carcinoma, the estimated τex median and IQR of the two breast cancers were 70 (94) and 106 (92) ms.
Conclusion: The results of this proof-of-concept study substantiate the feasibility of using tDKI to measure cellular-interstitial water exchange time without using an exogenous contrast agent.
Keywords: cortex; diffusion MRI; diffusional kurtosis imaging; intracellular water lifetime; microstructure; transcytolemmal water exchange; tumor.
© 2021 John Wiley & Sons, Ltd.
Figures
Similar articles
-
Time-dependent diffusivity and kurtosis in phantoms and patients with head and neck cancer.Magn Reson Med. 2023 Feb;89(2):522-535. doi: 10.1002/mrm.29457. Epub 2022 Oct 11. Magn Reson Med. 2023. PMID: 36219464 Free PMC article.
-
Diffusional kurtosis imaging in head and neck cancer: On the use of trace-weighted images to estimate indices of non-Gaussian water diffusion.Med Phys. 2018 Dec;45(12):5411-5419. doi: 10.1002/mp.13238. Epub 2018 Nov 8. Med Phys. 2018. PMID: 30317646
-
Pulsed and oscillating gradient MRI for assessment of cell size and extracellular space (POMACE) in mouse gliomas.NMR Biomed. 2016 Oct;29(10):1350-63. doi: 10.1002/nbm.3577. Epub 2016 Jul 22. NMR Biomed. 2016. PMID: 27448059 Free PMC article.
-
tDKI-Net: A Joint q-t Space Learning Network for Diffusion-Time-Dependent Kurtosis Imaging.IEEE J Biomed Health Inform. 2024 Dec;28(12):7300-7310. doi: 10.1109/JBHI.2024.3417259. Epub 2024 Dec 5. IEEE J Biomed Health Inform. 2024. PMID: 38905092
-
The role of tissue microstructure and water exchange in biophysical modelling of diffusion in white matter.MAGMA. 2013 Aug;26(4):345-70. doi: 10.1007/s10334-013-0371-x. Epub 2013 Feb 27. MAGMA. 2013. PMID: 23443883 Free PMC article. Review.
Cited by
-
Frequency-dependent diffusion kurtosis imaging in the human brain using an oscillating gradient spin echo sequence and a high-performance head-only gradient.Neuroimage. 2023 Oct 1;279:120328. doi: 10.1016/j.neuroimage.2023.120328. Epub 2023 Aug 14. Neuroimage. 2023. PMID: 37586445 Free PMC article.
-
Diffusion MRI with double diffusion encoding and variable mixing times disentangles water exchange from transient kurtosis.Sci Rep. 2025 Mar 13;15(1):8747. doi: 10.1038/s41598-025-93084-4. Sci Rep. 2025. PMID: 40082606 Free PMC article.
-
Correcting pulse duration effects in the diffusional kurtosis of the multi-compartment Kärger model.Magn Reson Med. 2025 Nov;94(5):2249-2257. doi: 10.1002/mrm.30608. Epub 2025 Jun 10. Magn Reson Med. 2025. PMID: 40493748 Free PMC article.
-
Diffusional kurtosis time dependence and the water exchange rate for the multi-compartment Kärger model.Magn Reson Med. 2024 Mar;91(3):1122-1135. doi: 10.1002/mrm.29926. Epub 2023 Nov 13. Magn Reson Med. 2024. PMID: 37957820 Free PMC article.
-
Mean Kärger Model Water Exchange Rate in Brain.Imaging Neurosci (Camb). 2024;2:imag-2-00335. doi: 10.1162/imag_a_00335. Epub 2024 Oct 25. Imaging Neurosci (Camb). 2024. PMID: 40534623 Free PMC article.
References
-
- Kim S, Quon H, Loevner LA, et al. Transcytolemmal water exchange in pharmacokinetic analysis of dynamic contrast-enhanced MRI data in squamous cell carcinoma of the head and neck. J Magn Reson Imaging. 2007;26(6):1607–1617. - PubMed
Publication types
MeSH terms
Substances
Grants and funding
LinkOut - more resources
Full Text Sources
Other Literature Sources
Medical
