

BRCA2 promotes DNA-RNA hybrid resolution by DDX5 helicase at DNA breaks to facilitate their repair‡
- PMID: 33634895
- PMCID: PMC8013831
- DOI: 10.15252/embj.2020106018
BRCA2 promotes DNA-RNA hybrid resolution by DDX5 helicase at DNA breaks to facilitate their repair‡
Abstract
The BRCA2 tumor suppressor is a DNA double-strand break (DSB) repair factor essential for maintaining genome integrity. BRCA2-deficient cells spontaneously accumulate DNA-RNA hybrids, a known source of genome instability. However, the specific role of BRCA2 on these structures remains poorly understood. Here we identified the DEAD-box RNA helicase DDX5 as a BRCA2-interacting protein. DDX5 associates with DNA-RNA hybrids that form in the vicinity of DSBs, and this association is enhanced by BRCA2. Notably, BRCA2 stimulates the DNA-RNA hybrid-unwinding activity of DDX5 helicase. An impaired BRCA2-DDX5 interaction, as observed in cells expressing the breast cancer variant BRCA2-T207A, reduces the association of DDX5 with DNA-RNA hybrids, decreases the number of RPA foci, and alters the kinetics of appearance of RAD51 foci upon irradiation. Our findings are consistent with DNA-RNA hybrids constituting an impediment for the repair of DSBs by homologous recombination and reveal BRCA2 and DDX5 as active players in their removal.
Keywords: BRCA2; DNA double-strand breaks; DNA-RNA hybrids; R-loops; homologous recombination.
© 2021 The Authors.
Conflict of interest statement
The authors declare that they have no conflict of interests.
Figures
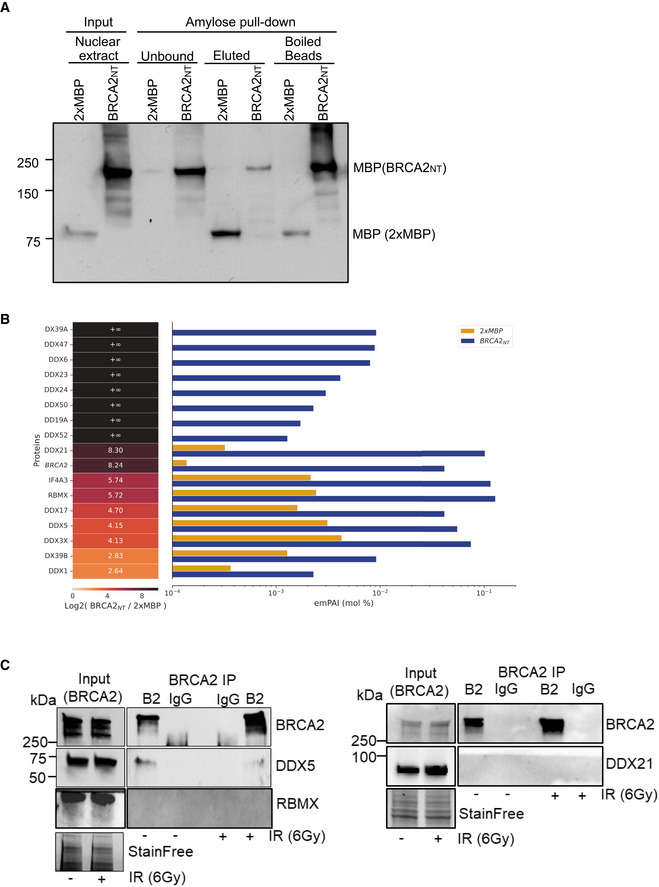
Amylose pull‐down from HEK293T nuclear cell extracts expressing 2xMBP‐BRCA2NT (BRCA2NT) and 2XMBP, detected by immunoblot, showing the samples for mass spectrometry experiment. The loading for input and unbound fractions is 1%, for the elution fraction is 8%, and for boiled bead fraction is 35%.
DEAD‐box helicases enriched in the BRCA2NT interactome. Label‐free protein quantification. (Left) BRCA2 (in italic) and DDX Protein ID present in the proteomics mass spectrometry screen. (Center) Heat‐map showing fold enrichment of each protein in BRCA2NT/2xMBP. Infinite‐fold indicates proteins that are only present in BRCA2NT sample and not in pull‐down performed with the 2xMBP. (Bottom) Heat‐map log2 color scale. (Right) Bar graph showing protein abundance in molar fraction percentage (mol %) in each pull‐down (yellow in 2xMBP, blue in BRCA2NT) based on label‐free emPAI quantification (see Materials and Methods section).
Immunoprecipitation (IP) of endogenous BRCA2 from benzonase‐treated HEK293T whole cell lysates treated or not with IR (6 Gy), as indicated. Normal mouse IgG was used as negative control. Immunoblot of DDX5, DDX21 and RBMX and BRCA2. Stain‐Free images of the gels before transfer were used as loading control (cropped images are shown).
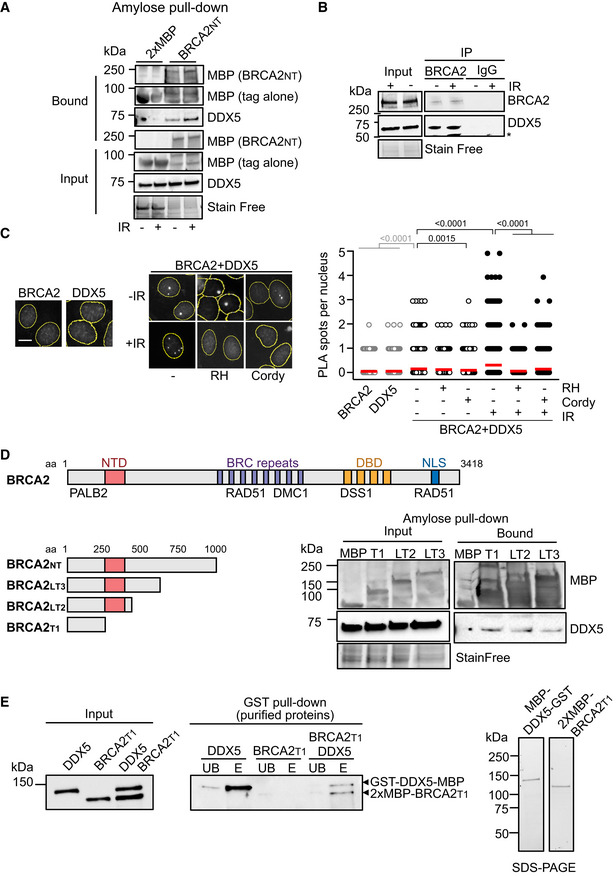
Amylose pull‐down from benzonase‐treated HEK293T cell lysates expressing 2xMBP‐BRCA2NT in untreated or irradiated cells (6Gy; +IR). DDX5 and BRCA2NT (MBP) detected by immunoblot. Stain‐Free images of the gels before transfer were used as loading control (cropped image is shown).
Immunoprecipitation (IP) of endogenous BRCA2 from benzonase‐treated HEK293T cell lysates left untreated or treated with IR (6 Gy) and harvested 4 h post‐IR, as indicated. Mouse IgG was used as negative control. Immunoblot of DDX5 and BRCA2. Stain‐Free image of the gels before transfer was used as loading control (cropped image is shown). Asterisk (*) indicates a non‐specific band detected by anti‐DDX5 antibody.
Left: Representative images of in situ proximity ligation assay (PLA) between BRCA2 and DDX5 antibodies in U2OS cells either left untreated (−) or irradiated (4 h post‐IR; 6 Gy). Nuclei as defined by auto threshold plugin on the DAPI image (ImageJ) are outlined in yellow. When indicated, cells were transfected with a plasmid expressing RNase H1 (RH) 24 h before or treated with cordycepin (Cordy) for 2 h at 37°C before fixation. Single antibody controls from untreated siC cells are shown. Scale bar indicates 10 µm. Right: Quantification of the number of PLA spots per nucleus. For statistical comparison of the differences between the samples, we applied a Kruskal–Wallis test followed by Dunn’s multiple comparison test and the P‐values show significant differences. The red line in the plot indicates the median, and each symbol represents a single PLA spot.
Diagram showing the BRCA2 N‐terminal truncations used in this study and amylose pull‐down from HEK293T whole cells extracts overexpressing the indicated BRCA2 N‐terminal truncations (BRCA2T1, BRCA2LT2, BRCA2LT3) or the 2xMBP tag. DDX5 and BRCA2 truncations were detected using specific antibodies against DDX5 and MBP, respectively. Stain‐Free images of the gels before transfer were used as loading control (cropped image is shown).
Left: GST pull‐down assay using purified BRCA2T1 and DDX5; MBP antibody was used for the detection of both proteins. UB: unbound; E: eluate. Right: SDS–PAGE showing 300 ng of purified MBP‐DDX5‐GST and of 2xMBP‐tagged BRCA2T1 used in the pull‐down assay.
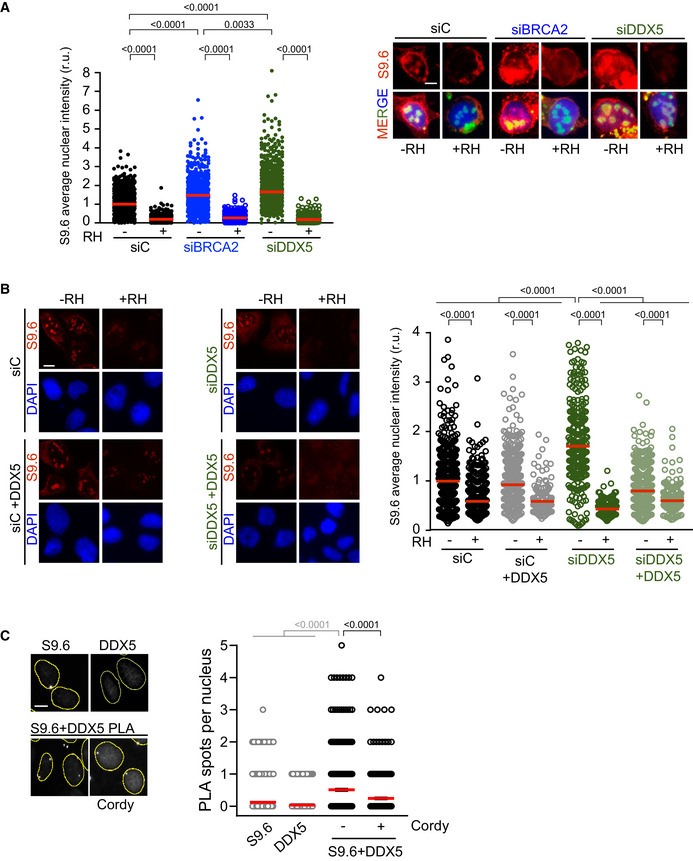
Left: Quantification of the relative intensity of S9.6 staining. The data represent at least 500 cells per condition from three independent experiments. The red line in the scatter plot represents the median. For statistical comparison of the differences between the samples, we applied Kruskal–Wallis test followed by Dunn’s multiple comparison test and the P‐values show significant differences. Right: Representative immunofluorescence images of U2OS cells depleted of DDX5 (siDDX5), BRCA2 (siBRCA2), or control cells (siC) and stained with S9.6 antibody (DNA‐RNA hybrids) and counterstained with DAPI. When indicated, cells were transfected/treated with RNase H1 (RH) 24 h before fixation. Scale bar indicates 10 µm.
Left: Representative images of S9.6 immunofluorescence of U2OS cells depleted of DDX5 (siDDX5) or control cells (siC) expressing RNaseH1‐GFP and/or DDX5‐GFP. Scale bar indicates 10 µm. Right: Quantification of S9.6 average nuclear intensity of U2OS cells depleted of DDX5 (siDDX5) or control cells (siC) expressing RNaseH1‐GFP and/or DDX5‐GFP. The red line in the plot indicates the median, and each symbol represents the value of a single cell. The statistical significance of the difference was calculated with Mann–Whitney U‐test; the P‐values show the significant difference. The data represent at least 170 cells per condition from one single experiment.
Left: Representative images of in situ PLA experiment performed between DDX5 and S9.6 antibodies in U2OS cells. When indicated, cells were treated with cordycepin (Cordy) for 2 h at 37°C before fixation. Single antibody controls from untreated cells are shown. Scale bar indicates 10 µm. Nuclei as defined by auto threshold plugin on the DAPI image (ImageJ) are outlined in yellow. Right: Quantification of the number of PLA spots per nucleus in different conditions, as indicated. The data represent at least 200 cells per condition from three independent experiments. For statistical comparison of the differences between the samples, we applied a Kruskal–Wallis test followed by Dunn’s multiple comparison test and the P‐values show significant differences. The red line in the plot indicates the median, and each symbol represents a single PLA spot.
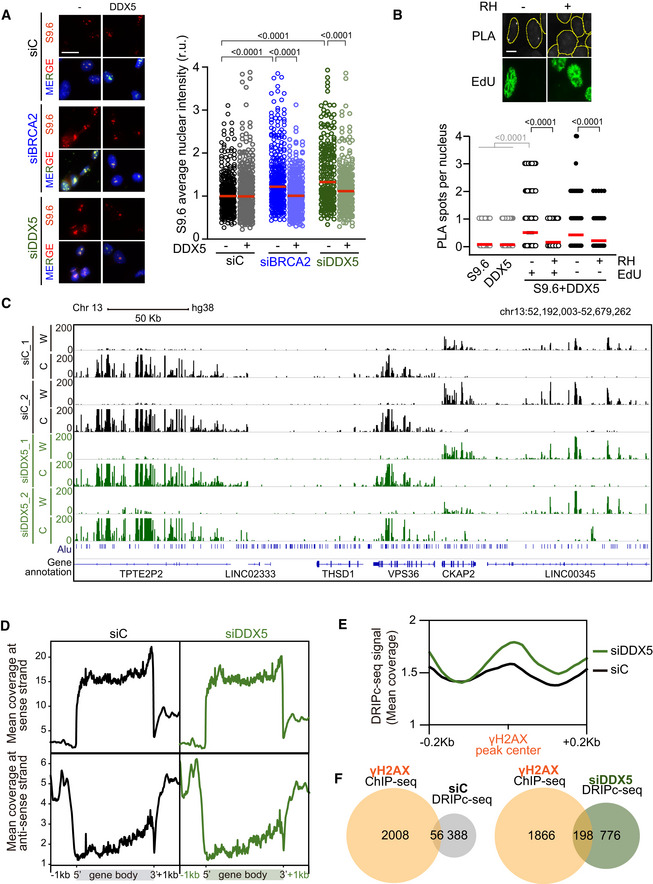
Left: Representative images of S9.6 immunofluorescence of U2OS cells depleted of BRCA2 (siBRCA2), DDX5 (siDDX5), or control cells (siC) after transfection with either an empty plasmid or a plasmid expressing DDX5. The merged images show the signal of S9.6, nucleolin (nucleoli) antibodies and DAPI staining. Scale bar indicates 25 µm. Right: Quantification of S9.6 average nuclear intensity of U2OS cells depleted of BRCA2 (siBRCA2), DDX5 (siDDX5), or control cells (siC) after transfection with either an empty plasmid or a plasmid expressing DDX5. The red line in the plot indicates the median, and each symbol represents the value of a single cell. The statistical significance of the difference was calculated with Mann–Whitney U‐test, and the P‐values show the significant difference. The data represent at least 235 cells per condition from three independent experiments. See also Fig EV2B.
Top: Representative images of in situ PLA performed with anti‐DDX5 and S9.6 antibodies in EdU‐labeled U2OS cells. Where indicated, cells were transfected with a plasmid expressing RNase H1 (RH). Nuclei as defined by auto threshold plugin on the DAPI image (ImageJ) are outlined in yellow. Bottom: Quantification of PLA spots per nucleus in each condition as indicated. At least 300 cells per condition were counted from three independent experiments. For statistical comparison of the differences between the samples, we applied a Kruskal–Wallis test followed by Dunn’s multiple comparison test and the P‐values show significant differences. The red line in the plot indicates the median, and each symbol represents a single PLA spot. See also Fig EV2C.
Representative screenshot of a specific genomic region showing DRIPc‐seq profiles at Watson (W) and Crick (C) strands in K562 cells depleted of DDX5 (siDDX5) or control cells (siC) from two independent experiments. See also Fig EV3.
DNA‐RNA hybrid distribution along protein‐coding genes containing DRIPc‐seq peaks in both conditions (siC and siDDX5) and replicates. Gene metaplots represent the mean of antisense or sense DRIPc‐seq signal from two independent experiments in K562 cells depleted of DDX5 (siDDX5) or control cells (siC) as indicated.
DNA‐RNA hybrid metaplot distribution over γH2AX ChIP‐seq peaks. Peak metaplot shows the mean DRIPc‐seq signal from two independent experiments in K562 cells depleted of DDX5 (siDDX5) or control cells (siC).
Venn diagram representing the overlap between γH2AX‐positive genes in K562 cells (γH2AX ChIP‐seq) and genes that specifically accumulate hybrids in control cells (top) or in DDX5‐depleted cells (bottom).
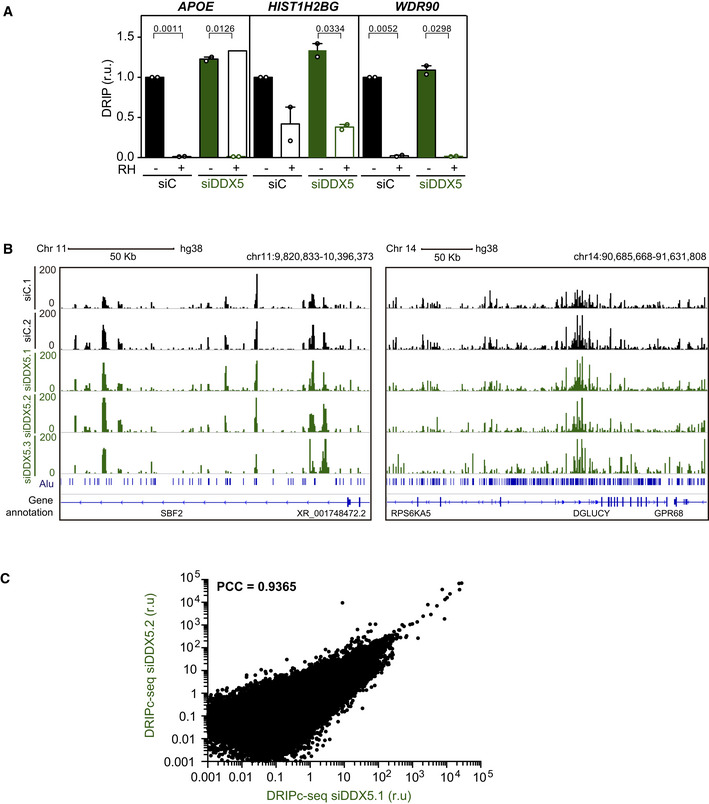
Relative DRIP‐qPCR signal values (respect to the siC level at each locus) at the APOE, HIST1H2BG, and WDR90 loci in K562 cells transfected with the indicated siRNAs and treated in vitro with RNase H1 (RH) pre‐immunoprecipitation where indicated. The data represent the mean ± SEM from two independent experiments. The statistical significance of the difference was calculated with paired Student t‐test, and the P‐values show the significant difference.
Representative screenshots of specific genomic regions showing the DRIPc‐seq profiles without DNA strand separation in K562 cells depleted of DDX5 (siDDX5) from three independent experiments as compared to data from control cells (siC). Two regions with different Alu sequence density are shown for comparison.
xy correlation plot between the DRIPc signal intensity from two DRIPc‐seq independent experiments performed in DDX5‐depleted K562 cells (PCC, Pearson correlation coefficient).
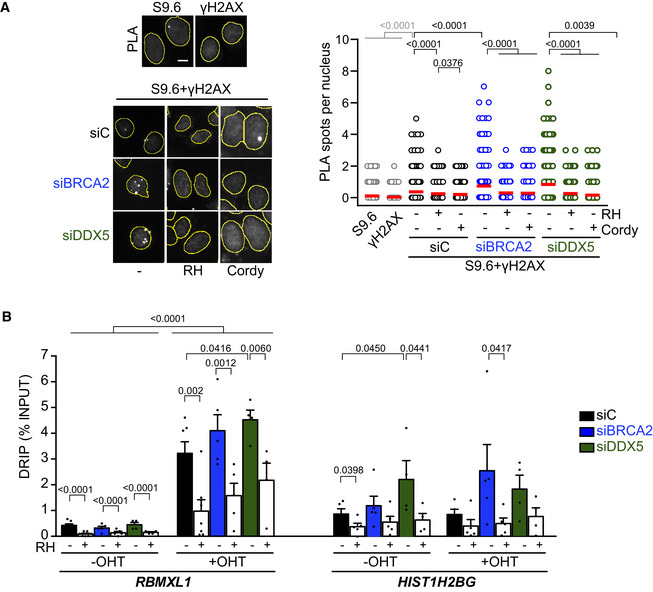
Left: Representative images of in situ PLA between S9.6 and γH2AX antibodies in U2OS cells depleted of BRCA2 (siBRCA2), DDX5 (siDDX5), or control cells (siC). When indicated, cells were transfected with a plasmid expressing RNase H1 (RH) 24 h before or treated with cordycepin (Cordy) for 2 h at 37°C before fixation. Single antibody controls from non‐irradiated siC cells are shown. Scale bar indicates 10 µm. Nuclei as defined by auto threshold plugin on the DAPI image (ImageJ) are outlined in yellow. Right: Quantification of PLA spots per nucleus in each condition as indicated. At least 500 cells per condition were counted from three independent experiments. For statistical comparison of the differences between the samples, we applied a Kruskal–Wallis test followed by Dunn’s multiple comparison test and the P‐values show significant differences. The red line in the plot indicates the median, and each symbol represents a single PLA spot. See also Fig EV4A.
DRIP‐qPCR signal values at RBMXL1 and HIST1H2BG loci in U2OS DIvA cells transfected with the indicated siRNAs and treated in vitro with RNase H1 (RH) pre‐immunoprecipitation where indicated. The experiment was performed in both untreated cells (−OHT) and after tamoxifen addition (+OHT). The data represent the mean ± SEM from at least four independent experiments. The statistical significance of the difference was calculated with unpaired one‐tailed t‐test, and the P‐values show the significant difference. See also Fig EV4B and C.
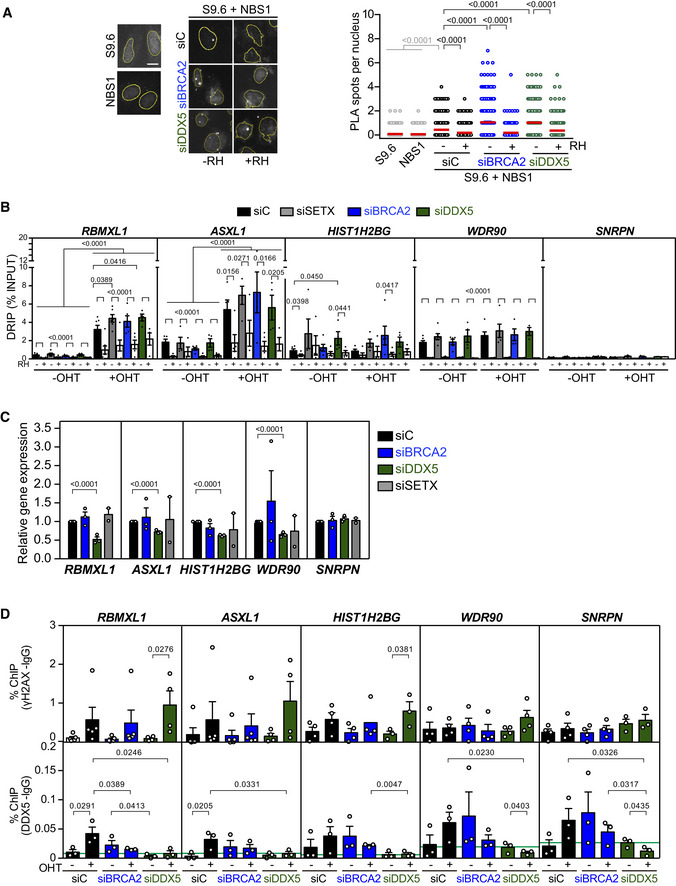
Left: Representative images of in situ PLA experiment performed between NBS1 and S9.6 antibodies in U2OS cells transfected with either siRNA control (siC) or siRNA specific for DDX5 (siDDX5). When indicated, cells were transfected with RNAseH1 (RH) 24 h before fixation. Single antibody controls from untreated cells are shown. Scale bar indicates 10 µm. Nuclei as defined by auto threshold plugin on the DAPI image (ImageJ) are outlined in yellow. Right: Quantification of the number of PLA spots per nucleus in different conditions, as indicated. The data represent at least 400 cells per condition from three independent experiments. For statistical comparison of the differences between the samples, we applied a Kruskal–Wallis test followed by Dunn’s multiple comparison test and the P‐values show significant differences. The red line in the plot indicates the median, and each symbol represents a single PLA spot.
DRIP‐qPCR signal values at RBMXL1, ASXL1, HIST1H2BG, WDR90, and SNPRN loci in U2OS DIvA cells transfected with the indicated siRNAs and treated in vitro with RNase H1 (RH) pre‐immunoprecipitation where indicated. The experiment was performed in both untreated cells (−OHT) and after tamoxifen addition (+OHT). The data represent the mean ± SEM from at least four independent experiments. The statistical significance of the difference was calculated with unpaired one‐tailed Student t‐test, and the P‐values show the significant differences.
Relative RBMXL1, ASXL1, HIST1H2BG, WDR90, and SNPRN gene expression levels in U2OS DiVA cells transfected with the indicated siRNAs. The data represent the mean ± SEM from two or three independent experiments. The statistical significance of the difference was calculated with unpaired Student t‐test; the P‐values show the significant differences.
γH2AX (top) and DDX5 (bottom) ChIP‐qPCR signal values at RBMXL1, ASXL1, HIST1H2BG, WDR90, and SNPRN loci in U2OS DiVA cells transfected with the indicated siRNAs and either left untreated (−OHT) or treated with tamoxifen (+OHT). The green line represents the background levels of DDX5 signal. The data represent the mean ± SEM from at least three independent experiments. The statistical significance of the difference was calculated with unpaired one‐tailed Student t‐test, and the P‐values show the significant differences.
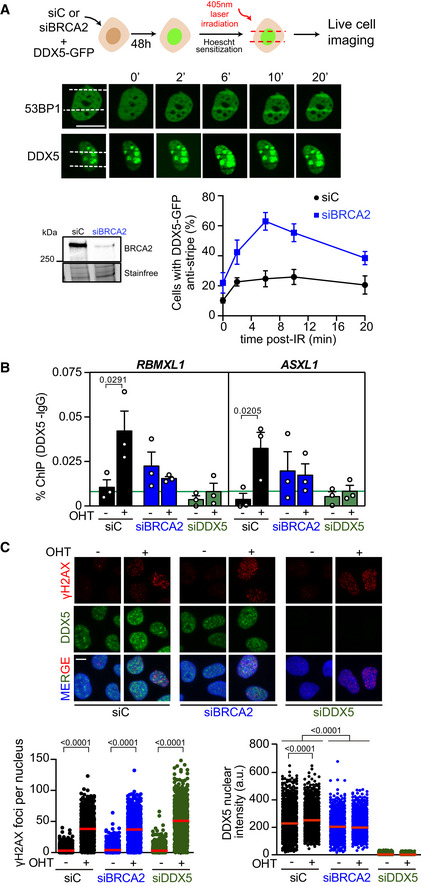
Top: Scheme showing the experimental set up for laser irradiation in DDX5‐GFP transfected U2OS cells depleted of BRCA2 (siBRCA2) or control cells (siC). Middle: Live cell imaging of the recruitment of GFP‐53BP1 or DDX5‐GFP to DNA damage tracks at different time points as indicated. Exposure and processing were adjusted to best demonstrate stripes and anti‐stripes. Scale bar indicates 10 µm. Bottom left: Western blot showing the siRNA‐mediated knock‐down of BRCA2 from U2OS cells transfected with DDX5‐GFP. Bottom right: Quantification of the percentage of transfected cells that exhibit DDX5‐GFP “anti‐stripe” pattern (reduced GFP signal at DNA damage tracks compared to the signal in the nucleus) at the times indicated in cells depleted of BRCA2 (siBRCA2) or treated with control siRNA (siC). The data represent the mean ± SEM from three independent experiments.
DDX5 ChIP‐qPCR signal values at RBMXL1 and ASXL1 loci in U2OS DIvA cells transfected with the indicated siRNAs and either untreated cells (−OHT) or after tamoxifen addition (+OHT). The data represent the mean ± SEM from three independent experiments. The green line represents the background levels of DDX5 signal. The statistical significance of the difference was calculated with unpaired one‐tailed t‐test, and the P‐values show the significant differences between untreated cells (−OHT) and after tamoxifen addition (+OHT). See also Fig EV4D.
Top: Representative images of immunofluorescence of U2OS DIvA cells depleted of BRCA2 (siBRCA2), DDX5 (siDDX5), or control cells (siC) and either untreated cells (−OHT) or after tamoxifen addition (+OHT), as indicated. Scale bar indicates 10 µm. Bottom: Quantification of the number of γH2AX foci per nucleus (left) and DDX5 nuclear intensity (right). The data represent at least 800 cells per condition from three independent experiments. The red line in the plot indicates the median, and each symbol represents the value of a single cell. The statistical significance of the difference was calculated with Mann–Whitney U‐test, and the P‐values show the significant difference.
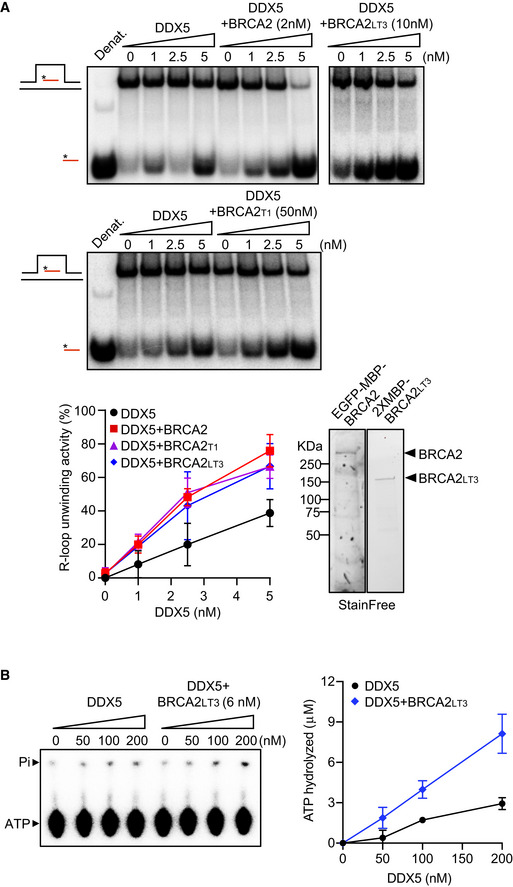
Top: PAGE gel showing a representative unwinding assays in which purified MBP‐DDX5‐GST (1–5 nM) was incubated with 32P‐labeled synthetic R‐loop substrate in the presence or absence of 2 nM purified EGFP‐MBP‐BRCA2 (top gel left) or 10 nM purified BRCA2LT3 (top gel right) or 50 nM purified BRCA2T1 (bottom gel). Bottom: Quantification of the unwinding experiments showing the percentage of free RNA relative to the R‐loop substrate (unwound product) as a function of DDX5 concentration alone (black) or in the presence of BRCA2 (red) or BRCA2LT3 (blue) or BRCA2T1 (pink). The data represent the mean ± SD of at least three independent experiments. Right: SDS–PAGE showing 500 ng of purified 2XMBP‐BRCA2LT3 and 150 ng of purified BRCA2 used in the unwinding assay. See also Fig EV5A and B.
Left: Thin layer chromatography (TLC) plate showing a representative ATP hydrolysis assay in which purified MBP‐DDX5‐GST (50–200 nM) was incubated with R‐loop synthetic substrate and [γ32P] ATP in the presence or absence of or 6 nM purified BRCA2LT3. Right: Quantification of the ATP hydrolyzed in each condition. No protein control was used as background. The data represent the mean ± SD from three independent experiments.
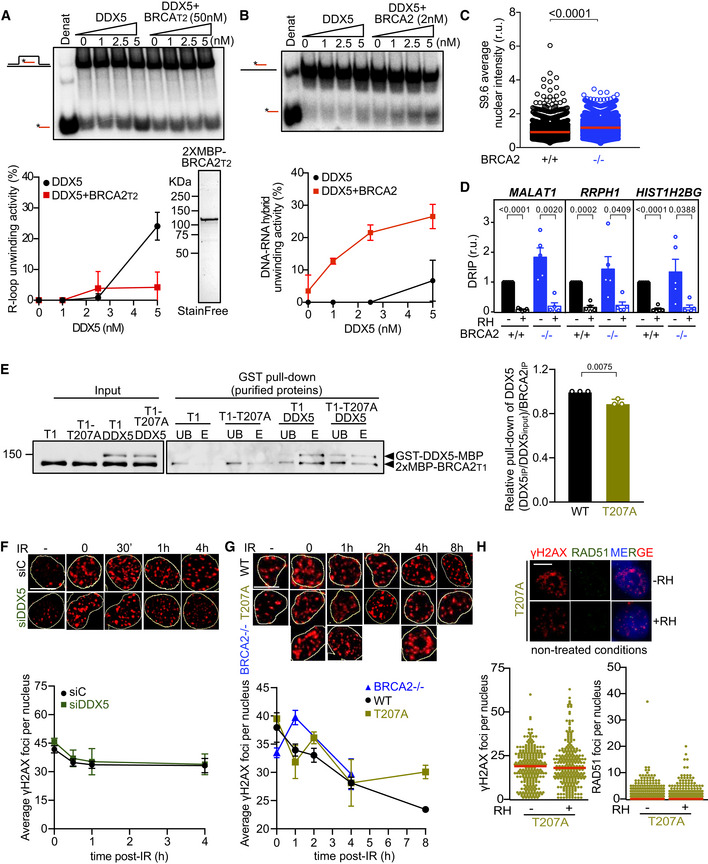
Top: PAGE gel showing a representative unwinding assays in which purified MBP‐DDX5‐GST (1–5 nM) was incubated with 32P‐labeled synthetic R‐loop substrate in the presence or absence of 50 nM purified 2xMBP‐BRCA2T2. Bottom: Quantification of the unwinding experiments showing the percentage of free RNA relative to the R‐loop substrate (unwound product) as a function of DDX5 concentration alone (black) or in the presence of BRCA2T2 (red). Bottom right: SDS–PAGE gel showing 1 μg of purified 2xMBP‐BRCA2T2 used for the unwinding assay. The data represent the mean ± SD of two independent experiments.
Top: PAGE gel showing a representative unwinding assays in which purified MBP‐DDX5‐GST (1–5 nM) was incubated with 32P‐labeled synthetic DNA‐RNA hybrid substrate in the presence or absence of 2 nM purified EGFP‐MBP‐BRCA2. Bottom: Quantification of the unwinding experiments showing the percentage of free RNA relative to the DNA‐RNA hybrid substrate (unwound product) as a function of DDX5 concentration alone (black) or in presence of BRCA2 (red). The data represent the mean ± SD of three independent experiments.
Quantification of the average nuclear intensity of S9.6 antibody in DLD1 BRCA2+/+ (+/+) and BRCA2−/− (−/−) cells. The red line in the plot indicates the median, and each symbol represents the value of a single cell. The data represent at least 2,000 cells per condition from four independent experiments. The statistical significance of the difference was calculated with Mann–Whitney U‐test; the P‐values show the significant difference.
Relative DRIP‐qPCR signal values (respect to the siC level at each locus) at the MALAT1, RRPH1, and HIST1H2BG loci in DLD1 BRCA2+/+ (+/+) and BRCA2−/− (−/−) cells and treated in vitro with RNase H1 (RH) pre‐immunoprecipitation where indicated. The data represent the mean ± SEM from five independent experiments. The statistical significance of the difference was calculated with unpaired Student t‐test, and the P‐values show the significant difference.
GST pull‐down assay using purified BRCA2T1 (T1) or BRCA2T1‐T207A (T1‐T207A) and DDX5. MBP antibody was used for the detection of both proteins. UB: unbound; E: eluate. Right: Quantification of the GST pull‐down experiments calculated as the pulled‐down BRCA2T1 (WT and T207A) with DDX5 relative to the input levels of BRCA2T1 (WT and T207A) and the amount of pulled‐down MBP‐DDX5‐GST. Results are presented as the fold change compared to the BRCA2 WT clone. The data represent the mean ± SD of three independent experiments. The statistical significance of the difference was calculated with unpaired t‐test, and the P‐values show the significant difference.
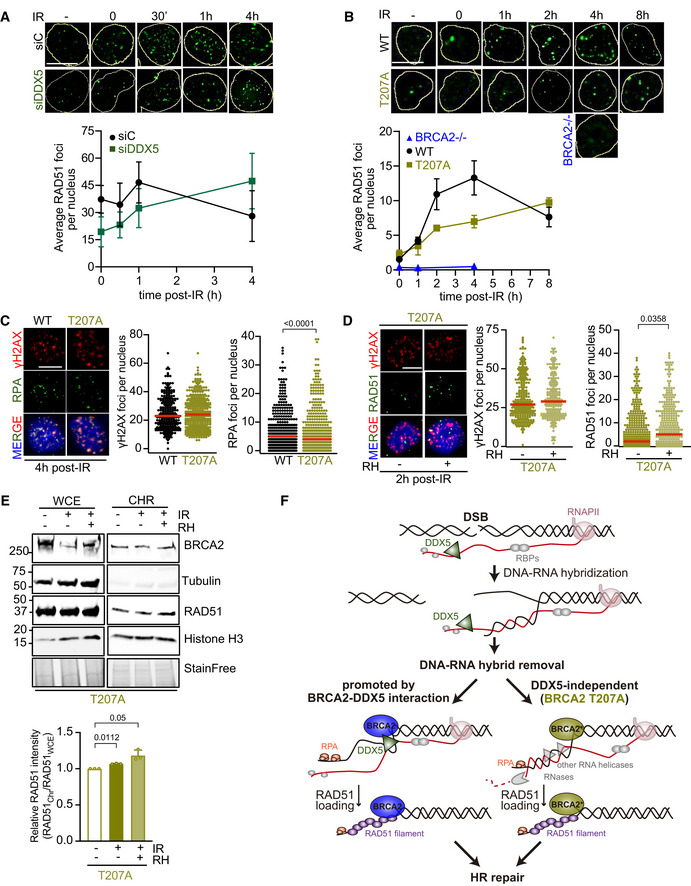
Top: Representative immunofluorescence images of cells hybridized with anti‐γH2AX antibody in U2OS cells depleted of DDX5 (siDDX5) and in control cells (siC) in cells left untreated (−) or at different time points after exposure to IR (6 Gy), as indicated. Scale bar indicates 10 µm. Nuclei as defined by auto threshold plugin on the DAPI image (ImageJ) are outlined in yellow. Bottom: Graph showing the average number of γH2AX foci. The data represent the mean ± SEM of three independent experiments.
Top: Representative immunofluorescence images of three independent experiments of nuclear γH2AX foci in BRCA2‐deficient DLD1 cells (BRCA2−/−) or BRCA2−/− bearing BRCA2 WT (WT) or BRCA2‐T207A (T207A) variant in cells left untreated or at different time points after exposure to IR (6Gy), as indicated. Scale bar indicates 10 µm. Nuclei as defined by auto threshold plugin on the DAPI image (ImageJ) are outlined in yellow. Bottom: Graph showing the average number of γH2AX foci. The data represent the mean ± SEM of three independent experiments.
Top: Representative immunofluorescence images of DLD1 BRCA2‐T207A stained for γH2AX and RAD51 in non‐treated conditions. When indicated, cells were transfected with a plasmid expressing RNaseH1 (+RH) 48 h prior fixation. Right: Quantification of the number of γH2AX foci (left) or RAD51 foci (right) per nucleus. The data shown are from at least 400 cells per condition from three independent experiments. For statistical comparison of the differences between the samples, we applied a Kruskal–Wallis test followed by Dunn’s multiple comparison test and no statistically significant differences were found. The red line in the plot indicates the median, and each symbol represents a single focus.
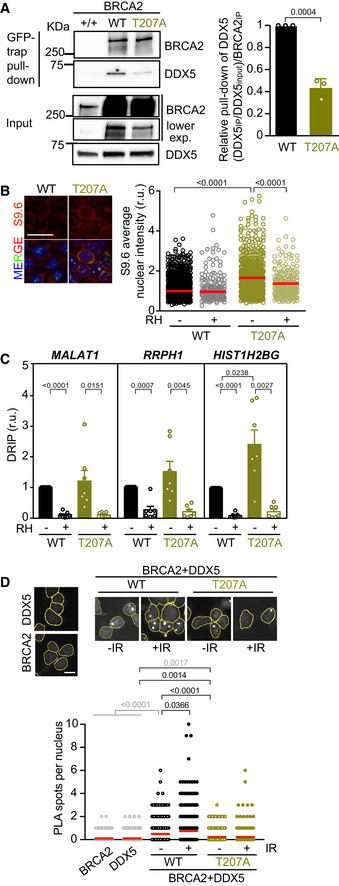
Left: GFP pull‐down assay from whole cell extracts of BRCA2‐deficient DLD1 expressing BRCA2 (WT) or the variant T207A (T207A). DLD1 BRCA2+/+ (+/+) cell extracts were used as control for the GFP‐trap. DDX5 and BRCA2 were detected with specific antibodies against DDX5 and BRCA2, respectively. Stain‐Free images of the gels before transfer were used as loading control (cropped image is shown). Right: Quantification of the GFP‐trap pull‐down experiments calculated as the co‐immunoprecipitated DDX5 with either BRCA2 WT or BRCA2‐T207A relative to the input levels of DDX5 and the amount of immunoprecipitated EGFP‐MBP‐BRCA2. Results are presented as the fold change compared to the BRCA2 WT clone. The data represent the mean ± SD of three independent experiments. The statistical significance of the difference was calculated with unpaired t‐test, and the P‐values show the significant difference.
Left: Representative images of S9.6 immunofluorescence of DLD1 cells bearing BRCA2 (WT) or BRCA2‐T207A (T207A). The merged images show the signal of S9.6, nucleolin (nucleoli) antibodies, and DAPI staining. Scale bar indicates 25 µm. Right: Quantification of the average nuclear intensity of S9.6 antibody in DLD1 BRCA2‐WT (WT) or BRCA2‐T207A (T207A) cells transfected with either a plasmid expressing GFP alone (−RH) or GFP‐RNase H1 (+RH), as indicated. The red line in the plot indicates the median, and each symbol represents the value of a single cell. Data correspond to at least 170 cells per condition from two independent experiments. The statistical significance of the difference was calculated with Mann–Whitney U‐test; P‐values show the significant difference. See also Fig EV5C.
Relative DRIP‐qPCR signal values (respect to the siC level at each locus) at the MALAT1, RRPH1, and HIST1H2BG loci in DLD1 BRCA2−/− cells bearing BRCA2 (WT) or BRCA2‐T207A (T207A) and treated in vitro with RNase H1 (RH) pre‐immunoprecipitation where indicated. The data represent the mean ± SEM from seven independent experiments. The statistical significance of the difference was calculated with paired Student t‐test; the P‐values show the significant difference. See also Fig EV5D.
Top: Representative images of in situ PLA performed between BRCA2 and DDX5 antibodies in cells bearing BRCA2 (WT) or BRCA2‐T207A (T207A), as indicated. Cells were fixed directly or 4 h post‐irradiation (6 Gy). Single antibody controls in non‐irradiated BRCA2 WT cells are shown. Scale bar indicates 10 µm. Bottom: Quantification of the number of PLA spots per nucleus. At least 750 cells were counted per condition from three independent experiments. For statistical comparison of the differences between the samples, we applied a Kruskal–Wallis test followed by Dunn’s multiple comparison test and the P‐values show significant differences. The red line in the plot indicates the median, and each symbol represents a single PLA spot.
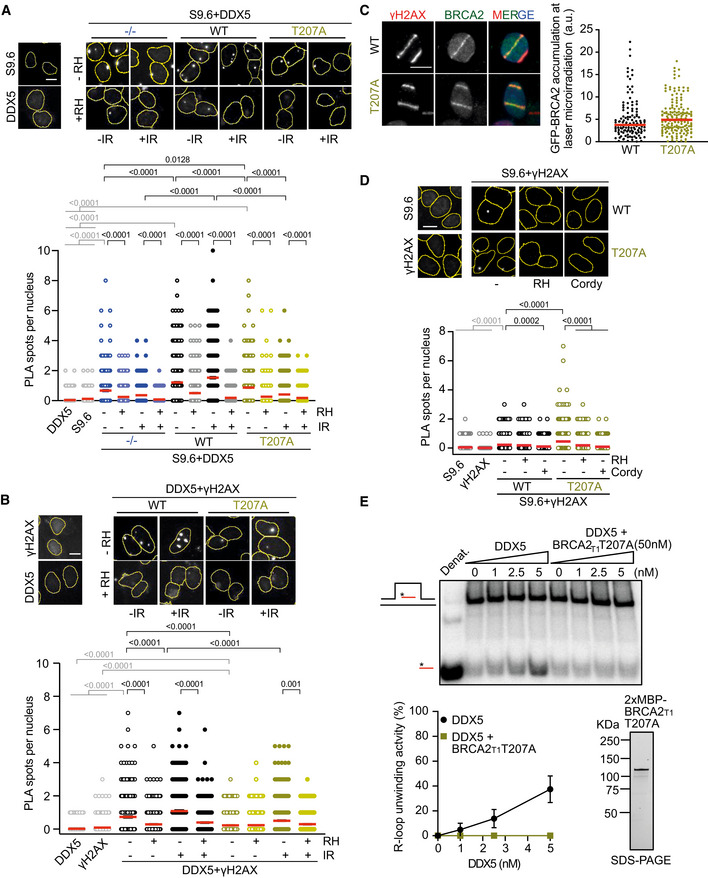
Top: Representative images of in situ PLA performed between DDX5 and S9.6 (DNA‐RNA hybrids) antibodies in BRCA2‐deficient DLD1 cells (BRCA2−/−) or DLD1 stable clones expressing BRCA2 (WT) or BRCA2‐T207A (T207A). Cells were fixed directly or 4 h post‐irradiation (6 Gy). When indicated, cells were transfected/treated with RNase H1 (RH) prior to fixation. Single antibody controls in non‐irradiated BRCA2 WT cells are shown. Scale bar indicates 10 µm. Bottom: Quantification of the number of PLA spots per nucleus. At least 500 cells were counted per condition from three independent experiments. For statistical comparison of the differences between the samples, we applied a Kruskal–Wallis test followed by Dunn’s multiple comparison test and the P‐values show significant differences. The red line in the plot indicates the median, and each symbol represents a single PLA spot.
Top: Representative images of in situ PLA performed between DDX5 and γH2AX antibodies in BRCA2‐deficient DLD1 cells (BRCA2−/−) bearing BRCA2 (WT) or BRCA2‐T207A (T207A). Cells were fixed directly or 4 h post‐irradiation (6 Gy). When indicated, cells were transfected/treated with RNase H1 (RH) prior to fixation. Single antibody controls in non‐irradiated BRCA2 WT cells are shown. Scale bar indicates 10 µm. Bottom: Quantification of the number of PLA spots per nucleus. At least 600 cells were counted per condition from three independent experiments. For statistical comparison of the differences between the samples, we applied a Kruskal–Wallis test followed by Dunn’s multiple comparison test and the P‐values show significant differences. The red line in the plot indicates the median, and each symbol represents a single PLA spot.
Left: Representative images of the recruitment of transient transfected GFP‐MBP‐BRCA2 (WT and T207A) to DNA damage tracks at 5 min post‐irradiation in U2OS cells. γH2AX is used as a marker of DNA damage. Scale bar indicates 10 µm. Right: Quantification of the intensity of GFP signal at the laser tracks. At least 130 cells were counted per condition from three independent experiments. For statistical comparison of the differences between the two samples, we applied an unpaired t‐test. The red line in the plot indicates the median, and each symbol represents a single cell intensity value.
Top: Representative images of in situ PLA performed between S9.6 (DNA‐RNA hybrids) and anti‐γH2AX antibodies in BRCA2‐deficient DLD1 cells (BRCA2−/−) bearing BRCA2 (WT) or BRCA2‐T207A (T207A). When indicated, cells were transfected/treated with RNase H1 (RH) or treated with cordycepin (Cordy) for 2 h at 37°C before fixation. Single antibody controls in non‐irradiated BRCA2 WT cells are shown. Scale bar indicates 10 µm. Nuclei as defined by auto threshold plugin on the DAPI image (ImageJ) are outlined in yellow. Bottom: Quantification of the number of PLA spots per nucleus. At least 600 cells were counted per condition from three independent experiments. For statistical comparison of the differences between the samples, we applied a Kruskal–Wallis test followed by Dunn’s multiple comparison test and the P‐values show significant differences. The red line in the plot indicates the median, and each symbol represents a single PLA spot.
Top: PAGE gel showing a representative unwinding assays in which purified MBP‐DDX5‐GST (1–5 nM) was incubated with 32P‐labeled synthetic R‐loop substrate in the presence or absence of 50 nM purified BRCA2T1‐T207A (bottom right). Bottom left: Quantification of the unwinding experiments showing the percentage of free RNA relative to the R‐loop substrate (unwound product) as a function of DDX5 concentration alone (black) or in the presence of BRCA2T1‐T207A (green). The data represent the mean ± SD of at least three independent experiments. Bottom right: SDS–PAGE showing 650 ng of purified 2XMBP‐BRCA2T1‐T207A used in the unwinding assay.
Top: Representative immunofluorescence images of cells stained for RAD51 (green) in U2OS cells depleted of DDX5 (siDDX5) and in control cells (siC) in non‐treated (−) or different time points after exposure to IR (6 Gy), as indicated. Scale bar indicates 10 µm. Bottom: Graph showing the average number of RAD51 repair foci in both cell lines. The data represent the mean ± SEM of three independent experiments. See also Fig EV5A.
Top: Representative immunofluorescence images of DLD1 BRCA2‐deficient cells (BRCA2−/−) or BRCA2−/− cells expressing BRCA2 WT (WT) or BRCA2‐T207A (T207A) in non‐treated or at different time points post‐IR (6 Gy), as indicated; hybridized with anti‐RAD51 antibody (green). Scale bar indicates 10 µm. Bottom: Graph showing the average number of RAD51 repair foci in the three cell lines. The data represent the mean ± SEM of three independent experiments. See also Fig EV5G.
Left: Representative immunofluorescence images of DLD1 BRCA2 WT or BRCA2‐T207A cells 4 h post‐irradiation (6 Gy) hybridized with anti‐γH2AX and anti‐RPA antibodies. Right: Quantification of the number of γH2AX and RPA foci per nucleus, as indicated. The data represent at least 400 cells per condition from two independent experiments. For statistical comparison of the differences between the samples, we applied a Kruskal–Wallis test followed by Dunn’s multiple comparison test and the P‐values show significant differences. The red line in the plot indicates the median, and each symbol represents a single focus.
Left: Representative immunofluorescence images of DLD1 BRCA2‐T207A cells 2 h post‐irradiation (6 Gy), as indicated, hybridized with anti‐γH2AX and anti‐RAD51 antibodies. (RH) RNase H. Right: Quantification of the number of γH2AX foci (left) or RAD51 foci (right) per nucleus. When indicated, cells were transfected with a plasmid expressing RNase H1 (RH) 48 h prior fixation. The data shown are from at least 400 cells per condition from three independent experiments. For statistical comparison of the differences between the samples, we applied a Kruskal–Wallis test followed by Dunn’s multiple comparison test and the P‐values show significant differences. The red line in the plot indicates the median, and each symbol represents a single focus. See also Fig EV5H.
Top: Subcellular fractionation showing amount of RAD51 in DLD1 stable clones expressing BRCA2‐T207A (T207A) in chromatin fraction. When indicated, cells were irradiated (2 h treatment) and/or transfected with a plasmid expressing RNase H1 (RH) 48 h prior fixation. α‐Tubulin and histone H3 signals are shown as markers of cytoplasmic and chromatin fraction, respectively. Bottom: Quantification of RAD51 levels detected by Western blot with a RAD51‐specific antibody in chromatin fraction relative to RAD51 levels in WCE. Results are presented as the fold change compared to the untreated sample. The data represent the mean ± SD of three independent experiments. The statistical significance of the difference was calculated with unpaired t‐test, and the P‐values show the significant difference.
Model. DNA‐RNA hybrid formation may be enhanced in the vicinity of DSBs due to the DNA rotation freedom provided by the break. Left: Through its interaction with DDX5, BRCA2 helps retain DDX5 at DSBs and stimulates its helicase activity to resolve the DNA‐RNA hybrids. Removal of the RNA from the hybrid would trigger RPA binding to the exposed ssDNA followed by the subsequent loading of RAD51 by BRCA2 and the displacement of RPA to resume HR. Right: When the interaction of BRCA2 with DDX5 is impaired as in cells bearing the breast cancer variant BRCA2‐T207A, DDX5 would not mediate hybrid removal, leading to hybrids that persist longer delaying the coating of the ssDNA by RPA. Eventually, the RNA from the hybrids would be cleared by other nucleases and helicases such as RNase H1 or Senataxin in a likely less efficient manner.
References
-
- Aguilera A, Gómez‐González B (2017) DNA‐RNA hybrids: the risks of DNA breakage during transcription. Nat Struct Mol Biol 24: 439–443 - PubMed
-
- ten Asbroek ALMA, van Groenigen M, Nooij M, Baas F (2002) The involvement of human ribonucleases H1 and H2 in the variation of response of cells to antisense phosphorothioate oligonucleotides. Eur J Biochem 269: 583–592 - PubMed
Publication types
MeSH terms
Substances
Associated data
- Actions
LinkOut - more resources
Full Text Sources
Other Literature Sources
Molecular Biology Databases
Research Materials
Miscellaneous
