. 2021 Apr 5;218(4):e20200737.
doi: 10.1084/jem.20200737.

Hematopoietic stem and progenitor cells are present in healthy gingiva tissue

Affiliations

Hematopoietic stem and progenitor cells are present in healthy gingiva tissue

Siddharth Krishnan et al. J Exp Med. .

Abstract

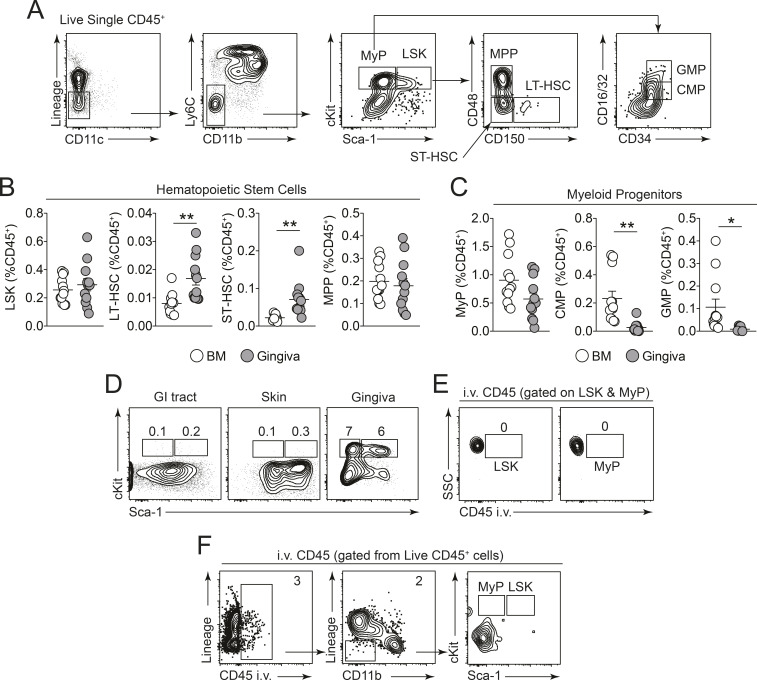
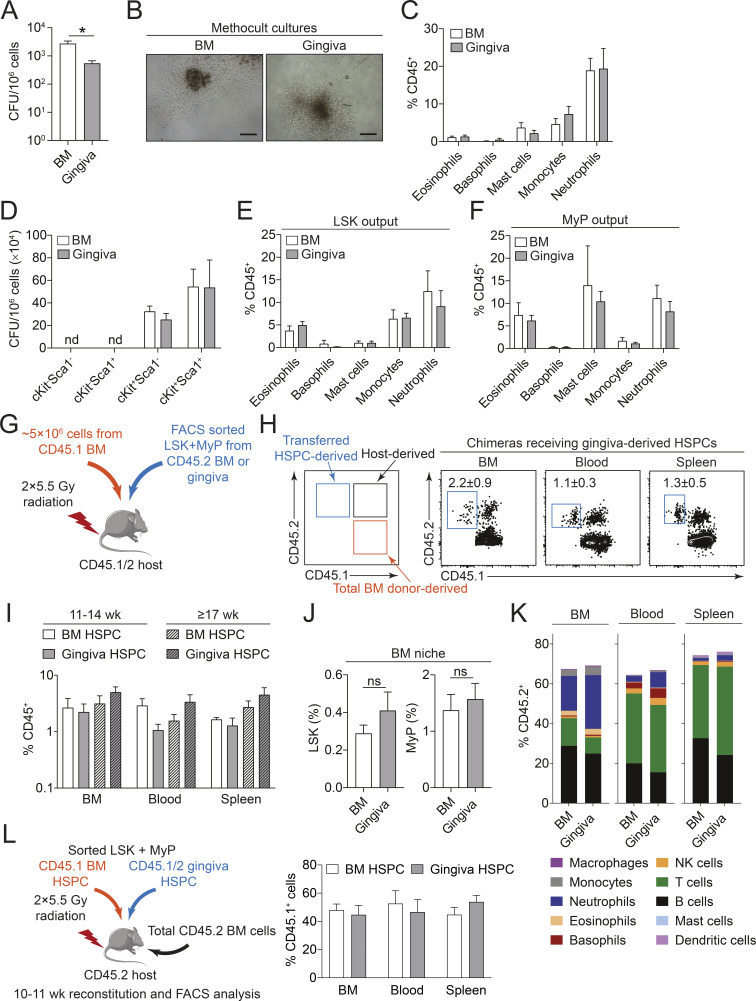
Hematopoietic stem cells reside in the bone marrow, where they generate the effector cells that drive immune responses. However, in response to inflammation, some hematopoietic stem and progenitor cells (HSPCs) are recruited to tissue sites and undergo extramedullary hematopoiesis. Contrasting with this paradigm, here we show residence and differentiation of HSPCs in healthy gingiva, a key oral barrier in the absence of overt inflammation. We initially defined a population of gingiva monocytes that could be locally maintained; we subsequently identified not only monocyte progenitors but also diverse HSPCs within the gingiva that could give rise to multiple myeloid lineages. Gingiva HSPCs possessed similar differentiation potentials, reconstitution capabilities, and heterogeneity to bone marrow HSPCs. However, gingival HSPCs responded differently to inflammatory insults, responding to oral but not systemic inflammation. Combined, we highlight a novel pathway of myeloid cell development at a healthy barrier, defining a gingiva-specific HSPC network that supports generation of a proportion of the innate immune cells that police this barrier.


Conflict of interest statement

Disclosures: The authors declare no competing interests exist.

Figures

None
Graphical abstract
Figure 1.
Figure 1.
A large population of monocytes is present in healthy gingiva. (A) Representative FACS plots showing monocytes (blue gate) and macrophages (red gate) as a percentage of live CD45+LinCD11b+Ly6C+/−CD64+/− cells (excludes Ly6CCD64 cells) in the gingiva and GI tract. In the skin, they were similarly identified but were additionally CD24low, and the Ly6C/CD64 was gated on CCR2. n = 6–13 mice per group. Lin = CD3ε, TCR-β, CD19, B220, NK1.1, Ter119, Siglec F, and Ly6G. (B) Representative contour plots of monocyte (Mos) labeling with i.v. administered, fluorescently conjugated CD45 antibody in the gingiva and blood. n = 2–3 mice and representative of two independent experiments. (C and D) Monocytes were FACS purified from the blood, BM, gingiva, skin, and GI tract and analyzed by RNA-seq. n = 2–3 biological replicates per group. (C) Hierarchical clustering of the gene expression profile of monocytes from the indicated tissue sites. FPKM, fragments per kilobase per million mapped reads. (D) Pathway analysis of genes up-regulated by monocytes in the BM and gingiva identified in cluster VI by hierarchical clustering of their transcriptomic profiles using PANTHER and graphed according to enrichment score. FDR, false discovery rate. (E) Frequencies of monocytes in the blood, BM, and gingiva labeled by a single dose of EdU administered in vivo. n = 4 mice per group from two independent experiments. (F) Frequencies and total numbers of monocytes (Mo) in the gingiva and blood of control (white bars) and Ccr2/ (gray bars) mice. n = 3–7 mice per group from two independent experiments. (G–I) Head-shielded BM chimeras were generated by irradiating CD45.2 (host) mice with their heads shielded by lead and reconstituting with CD45.1 (donor) BM. The proportions of donor-derived (white bar) and host-derived (black bar) monocytes (G), neutrophils (H), and eosinophils and basophils (I) were examined in the blood (non-shielded site) and the gingiva and ear skin (both shielded sites) at 11–12 wk after reconstitution. n = 6–11 mice per group from two to three experiments. (J) Representative pseudocolor plots identifying the common monocyte progenitor (cMoP) in BM and gingiva. n = 2–5 mice from two independent experiments. (K) Representative FACS plots identifying premonocytes in the gingiva. n = 6 mice from three independent experiments. (L) Frequencies of neutrophils in the blood, BM, and gingiva labeled by a single dose of EdU 24 h following administration. n = 4 mice per group from two independent experiments. (M) Representative FACS plots identifying preneutrophils and immature and mature neutrophils in the gingiva. n = 3–4 mice from two independent experiments. Data are presented as mean ± SEM on graphs and FACS plots. Statistical comparisons were performed using a two-way ANOVA with a Tukey’s post hoc test (E and G–I), unpaired t test with Welch’s correction (F, left panel), Mann–Whitney U test (F, right panel), and a one-way ANOVA with a post hoc Holm–Šídák test (L); ****, P < 0.0001; ***, P < 0.001; **, P < 0.01; and *, P < 0.05.
Figure S1.
Figure S1.
A unique monocyte population is present in the gingiva. (A) Gating strategy to identify monocytes in the gingiva and GI tract (numbers indicate frequencies expressed as mean ± SEM). (B) Quantification of monocytes as a percentage of live CD45+LinCD11b+Ly6C+/−CD64+/− cells (excludes Ly6CCD64 cells) in the gingiva of C57BL/6 and Balb/c mice and GI tract and skin of C57BL/6 mice. n = 6–13 mice per group. Lin = CD3ε, TCR-β, CD19, B220, NK1.1, Ter119, Siglec F, and Ly6G. (C and D) Representative staining of gingiva tissue for Ly6G+, Ly6Cbright, and F4/80+ cells. (C) Images show locations of cells staining positive for each marker. (D) Representative sections stained for Ly6G, Ly6C, and F4/80. Solid white line indicates edge of tooth. Scale bar = 200 µm. Staining from three separate experiments with n = 2–3 per experiment. (E) Representative histograms showing staining for CD44, CD68, CCR2, and CX3CR1 by gingival Ly6Chi monocytes (Mo). Data from seven experiments with two to three mice per experiment. FMO, fluorescence minus one. (F) Cytospins of sorted gingival Ly6Chi monocytes and macrophages (Mϕ) stained with H&E. Scale bar = 10 µm. Images are representative of two independent experiments. (G) Representative FACS plots of sorted BM and gingiva monocytes that were cultured with M-CSF for 7 d and analyzed by FACS. Data from two independent experiments. (H) Monocytes were FACS purified from the blood, BM, gingiva, skin, and GI tract and analyzed by RNA-seq. n = 2–3 biological replicates per group. Heatmap of the expression profile of canonical monocyte and macrophage-associated genes. FPKM, fragments per kilobase per million mapped reads. (I) Representative FACS plots showing host- and donor-derived Ly6Chi monocytes in the blood and gingiva of head-shielded chimeras 20 wk after reconstitution. Numbers indicate percentage of cells in the gate. (J) Quantification of donor-derived (white bar) and host-derived (black bar) Ly6Chi gingival monocytes 12 and 20 wk after reconstitution in head-shielded chimeras. n = 6–11 mice per group from two to three experiments. (K) Chimerism of Ly6Chi monocytes in the lungs of torso-shielded chimeras (left) and GI tract of abdomen-shielded chimeras (right). The frequency of donor-derived Ly6Chi gingiva monocytes was normalized to that of blood Ly6Chi monocytes to determine percent chimerism. Data from one to two experiments with n = 3–9 mice per group. (L) Proportions of innate cells presented as the percentage of all CD45+ cells in the gingiva, GI tract, and skin. n = 3 from three independent experiments. Asterisks indicate significant differences compared with gingiva. (M) tSNE map of CD45+LinLy6G+ gingival cells that were subjected to dimensional reduction based on Sca-1, cKit, CXCR2, CD45, Ly6G, CXCR4, MHCII, CD11b, Ly6C, CD11c, CD101, and Lin. Identified subpopulations are highlighted in the tSNE plot. Data representative of two experiments with n = 2–3 mice. Data are presented as mean ± SEM. Statistical comparisons were performed using a one-way ANOVA with a post hoc Tukey’s test (B) and a two-way ANOVA with a Tukey’s (L) and Holm–Šídák post hoc test (J); ****, P < 0.0001; **, P < 0.01; *, P < 0.05.
Figure 2.
Figure 2.
HSPCs are present in healthy gingiva. (A) Representative contour plots for the gating strategy to identify HSPCs in the gingiva. Lin = CD3ε, TCR-β, CD19, B220, NK1.1, Ter119, Siglec F, Ly6G, FcεR1α, CD11b, CD11c, and Ly6C. (B and C) Frequencies of HSCs (B) and MyP (C) in the BM and gingiva expressed as a percentage of total CD45+ cells. n = 12 mice per group from four independent experiments. ST-HSC, short-term HSC; GMP, granulocyte-macrophage progenitor. (D) Representative FACS plots showing HSPCs in the GI tract, skin, and gingiva. n = 3–6 from two independent experiments. Numbers show mean frequencies (among CD45+) and SEM. (E and F) Representative contour plots of gingiva HSPCs labeling with i.v. administered fluorescently labeled CD45 antibody. (E) Gating on LSK and MyP plots show staining for CD45 antibody injected i.v. (F) Gating on all cells staining positive for CD45 antibody injected i.v. and subsequent gating for LSK and MyP. Data are representative of two to three mice from three independent experiments. In all cases, numbers indicate percentage of cells in the gate. Data are presented as mean ± SEM. Statistical comparisons were performed using an unpaired t test with Welch’s correction (B and C); **, P < 0.01; *, P < 0.05.
Figure S2.
Figure S2.
HSPCs are present in gingival tissue and exhibit hematopoietic activity. (A) Number of HSCs in the BM per femur and gingiva. n = 12 mice per group pooled from four independent experiments. (B) Left: Representative FACS plots identify HSPCs in the gingiva of C57BL/6J and Balb/c mice. Numbers indicate frequencies of HSPCs among LincKit+ cells. Right: Frequencies of HSPCs in the gingiva of C57BL/6J and Balb/c mice expressed as a percentage of total CD45+ cells. n = 4–6 per group. Lin = CD3ε, TCR-β, CD19, B220, NK1.1, Ter119, Siglec F, Ly6G, FcεR1α, CD11b, CD11c, and Ly6C. (C) Absolute number of LT-HSCs from mice fed normal or a hardened chow diet for 8 wk. n = 8–9 mice per group pooled from three independent experiments. (D) CFU activity from MethoCult cultures of gingiva and small and large intestines. n = 2–6 per group pooled from four experiments. (E–H) CD45.1/2 hosts were sublethally irradiated and received equal numbers of LSK + MyPs FACS-sorted from the gingiva or BM of CD45.2 mice alongside total BM cells from CD45.1 mice. (E) Table showing numbers of chimera hosts into which HSPCs from either BM or gingiva were transferred and details of engraftment of the transferred HSPCs. (F) Bar graph showing frequencies of BM and gingiva HSPC-derived progeny in the indicated tissues expressed as a percentage of the total CD45+ population examined 11–14 wk (left) or ≥17 wk (right) after reconstitution. n = 3–6 mice per group from two independent experiments. SMLN, submandibular lymph node. (G) Bar graphs show frequencies of BM LSKs and MyPs that were derived from BM-HSPCs (white bars) or gingiva-HSPCs (gray bars) examined ≥17 wk after reconstitution. Data expressed as a percentage of total donor HSPC-derived cells. n = 5–8 mice per group from three independent experiments. (H) Lineage output of BM and gingiva HSPC-derived progeny in the BM, blood, and spleen at ≥17 wk after reconstitution, expressed as a percentage of total donor HSPC-derived cells. n = 7–12 mice per group from three independent experiments. (I) Equal numbers of LSK + MyPs were sorted from the BM of CD45.1 mice and gingiva of CD45.1/2 mice and transferred into sublethally irradiated CD45.2 hosts who also received total CD45.2 BM cells. Mice were reconstituted for 10–11 wk following which BM- and gingiva-derived cells were analyzed by FACS. Lineage output of BM and gingiva HSPC-derived progeny in the BM, blood, and spleen expressed as a percentage of total donor HSPC-derived cells. n = 3–5 mice per group from two independent experiments. Data are presented as mean ± SEM, except in H and I, where mean frequencies of HSPC-derived progeny are plotted. Statistical comparisons were performed using an unpaired t test (D and G) with Welch’s correction (A–C) and a two-way ANOVA with a Holm–Šídák post hoc test (F, H, and I); ****, P < 0.0001; ***, P < 0.001; **, P < 0.01; *, P < 0.05.
Figure 3.
Figure 3.
Gingival HSPCs are capable of hematopoietic reconstitution. (A–C) Single-cell suspensions from the BM (white bars) and gingiva (gray bars) were cultured in MethoCult medium for 10 d. (A) CFU activity from MethoCult cultures of total BM and gingiva tissue. (B) Representative photomicrographs of MethoCult colonies from cultures of single-cell preparations from BM and gingiva. Scale bar = 500 µm. (C) Quantification of the lineage output from MethoCult cultures of BM and gingiva preparations determined by flow cytometry. n = 4–12 per group from six experiments. (D–F) FACS-sorted hematopoietic progenitors were isolated from the BM and gingiva, and equal numbers of cells were seeded in MethoCult medium. (D) CFU activity of gingiva or BM FACS-sorted cells. (E and F) Quantification of the lineage output from MethoCult cultures of FACS-sorted LSK (cKit+Sca1+) and MyP (cKit+Sca1). Data representative of three independent experiments. (G) Schematic of the generation of whole-body chimeras. Anesthetized CD45.1/2 hosts were sublethally irradiated and received equal numbers of LSK + MyPs FACS sorted from the gingiva or BM of CD45.2 mice alongside total BM cells from CD45.1 mice. (H) Representative FACS plots identifying gingiva HSPC-derived CD45.2+ cells within total CD45+ cells (both CD45.1 and CD45.2) in the BM, blood, and spleen. (I) Quantification of BM and gingiva HSPC-derived cellular progeny in the indicated tissues expressed as a percentage of the total CD45+ population, at early time points (11–14 wk, solid bars) and late time points (≥17 wk, hatched bars) after reconstitution. n = 5–12 mice/group from two to three independent experiments for each time point. (J) Frequencies of BM LSK and MyPs that were derived from BM-HSPCs or gingiva-HSPCs examined 11–14 wk after reconstitution. Data expressed as a percentage of total donor HSPC-derived cells. n = 5–6 mice per group from two independent experiments. (K) Lineage output of BM and gingiva HSPC-derived progeny in the BM, blood, and spleen at 11–14 wk after reconstitution, expressed as a percentage of total donor HSPC-derived cells. n = 5–6 mice per group from two independent experiments. (L) Left: Equal numbers of LSK + MyPs were sorted from the BM of CD45.1 mice and gingiva of CD45.1/2 mice and transferred into sublethally irradiated CD45.2 hosts who also received total CD45.2 BM cells. Mice were reconstituted for 10–11 wk, after which the proportion of BM- or gingiva-derived cells was analyzed by FACS. Right: Proportions among all CD45.1 cells of BM- and gingiva-derived progeny in the BM, blood, and spleen. n = 5/group from two independent experiments. Data are presented as mean ± SEM except in K, where mean frequencies of HSPC-derived progeny are plotted. Statistical comparisons were performed using an unpaired t test with Welch’s correction (A and J), a two-way ANOVA with a post hoc Holm–Šídák test (C–F, K, and L), and Tukey’s test (I); *, P < 0.05. We acknowledge Servier Medical Art (https://smart.servier.com) for cartoons used in this figure.
Figure 4.
Figure 4.
BM and gingiva HSPCs exhibit distinct responsiveness to inflammation. (A–D) Total LSK + MyP cells were isolated by FACS from the gingiva and BM of mice and analyzed by single-cell RNA-seq. (A) tSNE plots show clustering in the two tissues. (B) Bar graph showing frequencies of cells in each cluster in BM (white bars) and gingiva (gray bars) samples. (C and D) Projection of the stemness and cell cycling index scores (from Giladi et al., 2018) onto the core model to identify their distribution across the clusters in the BM and gingiva. (E and F) Number of LSKs and MPPs in the BM per femur and gingiva of germ-free (GF) mice and specific pathogen–free (SPF) controls (E) or Ifnar1/ and controls (F). n = 6–9 mice per group. (G–I) LIP was induced in cohorts of mice, and HSPCs in the gingiva and BM were examined 10 d after ligature placement. (G) Graph shows fold-change in the numbers of LSK, MyP, and MPP cells in the gingiva and BM. n = 6 mice per group pooled from two independent experiments. (H) CFU activity from MethoCult cultures of BM (left) and gingiva (right). n = 6 mice pooled from four independent experiments. (I) Neutrophil output in MethoCult cultures of gingiva and BM assessed by flow cytometry. n = 6 mice per group pooled from four independent experiments. (J) Fold-change in the numbers of LSK, MyP, and LT-HSCs in the gingiva and BM 7 d following i.p. administration of β-glucan. n = 5–7 mice per group pooled from three independent experiments. Data are presented as mean ± SEM. Statistical comparisons were performed using an unpaired t test (E and J) with Welch’s correction (F, H, and I), a two-way ANOVA with a Holm–Šídák post hoc test (G). ***, P < 0.001; **, P < 0.01; *, P < 0.05.
Figure S3.
Figure S3.
HSPCs in the gingiva and BM show altered responsiveness to inflammatory signals. (A) Single-cell RNA-seq analysis of total LSK + MyP cells isolated by FACS from the gingiva and BM showing the annotation of identified lineages on the core model. (B–D) tSNE plots show the expression of erythroid (B), myeloid (C), and lymphoid (D) lineage-associated gene transcripts projected onto the core model. (E–H) LIP was induced in cohorts of mice, at day 10 after ligature placement, and gingiva HSPCs were FACS sorted from the gingiva. HSPCs were FACS sorted from naive gingiva as a control. (E) CFU activity from MethoCult cultures of sorted LSK and MyP. (F) Quantification of neutrophil output from MethoCult cultures of LSK sorted from control and LIP gingiva, as assessed by flow cytometry. n = 2 from two independent experiments. (G and H) Total HSPCs (LSK + MyP) were sorted from the gingiva of control or LIP CD45.1/2 mice and transferred into sublethally irradiated CD45.2 hosts along with total BM cells from CD45.1 mice. Mice were examined 10–11 wk after reconstitution. (G) Quantification of HSPC-derived cellular progeny in indicated tissues expressed as a percentage of the total CD45+ population. (H) Neutrophil output as a proportion of CD45+ cells from control or LIP gingival HSPCs in the BM, blood, and spleen expressed as a percentage of total donor HSPC-derived cells. n = 3–4 per group from two independent experiments. (I and J) Fold-change in the percentages of LSK (I) and MyP (J) in the gingiva and BM 18 h following i.p. administration of 5 µg LPS. n = 6–9 mice per group pooled from three experiments. Data are presented as the mean ± SEM. Statistical comparisons were performed using an unpaired t test (E and F) with Welch’s correction (H–J) and a two-way ANOVA with a Holm–Šídák post hoc test (G); ****, P < 0.0001; ***, P < 0.001; **, P < 0.01; *, P < 0.05.

References

    1. Abe, T., and Hajishengallis G.. 2013. Optimization of the ligature-induced periodontitis model in mice. J. Immunol. Methods. 394:49–54. 10.1016/j.jim.2013.05.002 - DOI - PMC - PubMed
    1. Anderson, K.G., Mayer-Barber K., Sung H., Beura L., James B.R., Taylor J.J., Qunaj L., Griffith T.S., Vezys V., Barber D.L., and Masopust D.. 2014. Intravascular staining for discrimination of vascular and tissue leukocytes. Nat. Protoc. 9:209–222. 10.1038/nprot.2014.005 - DOI - PMC - PubMed
    1. Atarashi, K., Suda W., Luo C., Kawaguchi T., Motoo I., Narushima S., Kiguchi Y., Yasuma K., Watanabe E., Tanoue T., et al. . 2017. Ectopic colonization of oral bacteria in the intestine drives TH1 cell induction and inflammation. Science. 358:359–365. 10.1126/science.aan4526 - DOI - PMC - PubMed
    1. Bain, C.C., Scott C.L., Uronen-Hansson H., Gudjonsson S., Jansson O., Grip O., Guilliams M., Malissen B., Agace W.W., and Mowat A.M.. 2013. Resident and pro-inflammatory macrophages in the colon represent alternative context-dependent fates of the same Ly6Chi monocyte precursors. Mucosal Immunol. 6:498–510. 10.1038/mi.2012.89 - DOI - PMC - PubMed
    1. Baldridge, M.T., King K.Y., Boles N.C., Weksberg D.C., and Goodell M.A.. 2010. Quiescent haematopoietic stem cells are activated by IFN-gamma in response to chronic infection. Nature. 465:793–797. 10.1038/nature09135 - DOI - PMC - PubMed

Publication types