. 2021 Mar 9;5(5):1137-1153.
doi: 10.1182/bloodadvances.2020001996.

Correction of β-thalassemia by CRISPR/Cas9 editing of the α-globin locus in human hematopoietic stem cells

Affiliations

Correction of β-thalassemia by CRISPR/Cas9 editing of the α-globin locus in human hematopoietic stem cells

Giulia Pavani et al. Blood Adv. .

Abstract

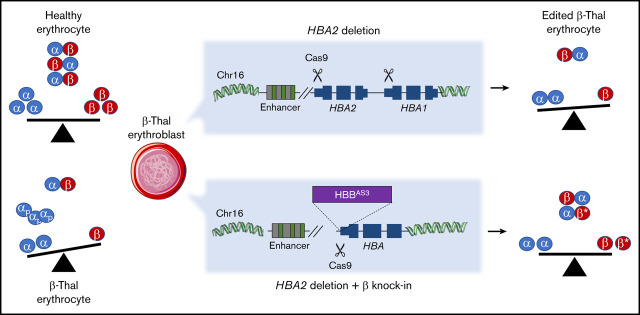
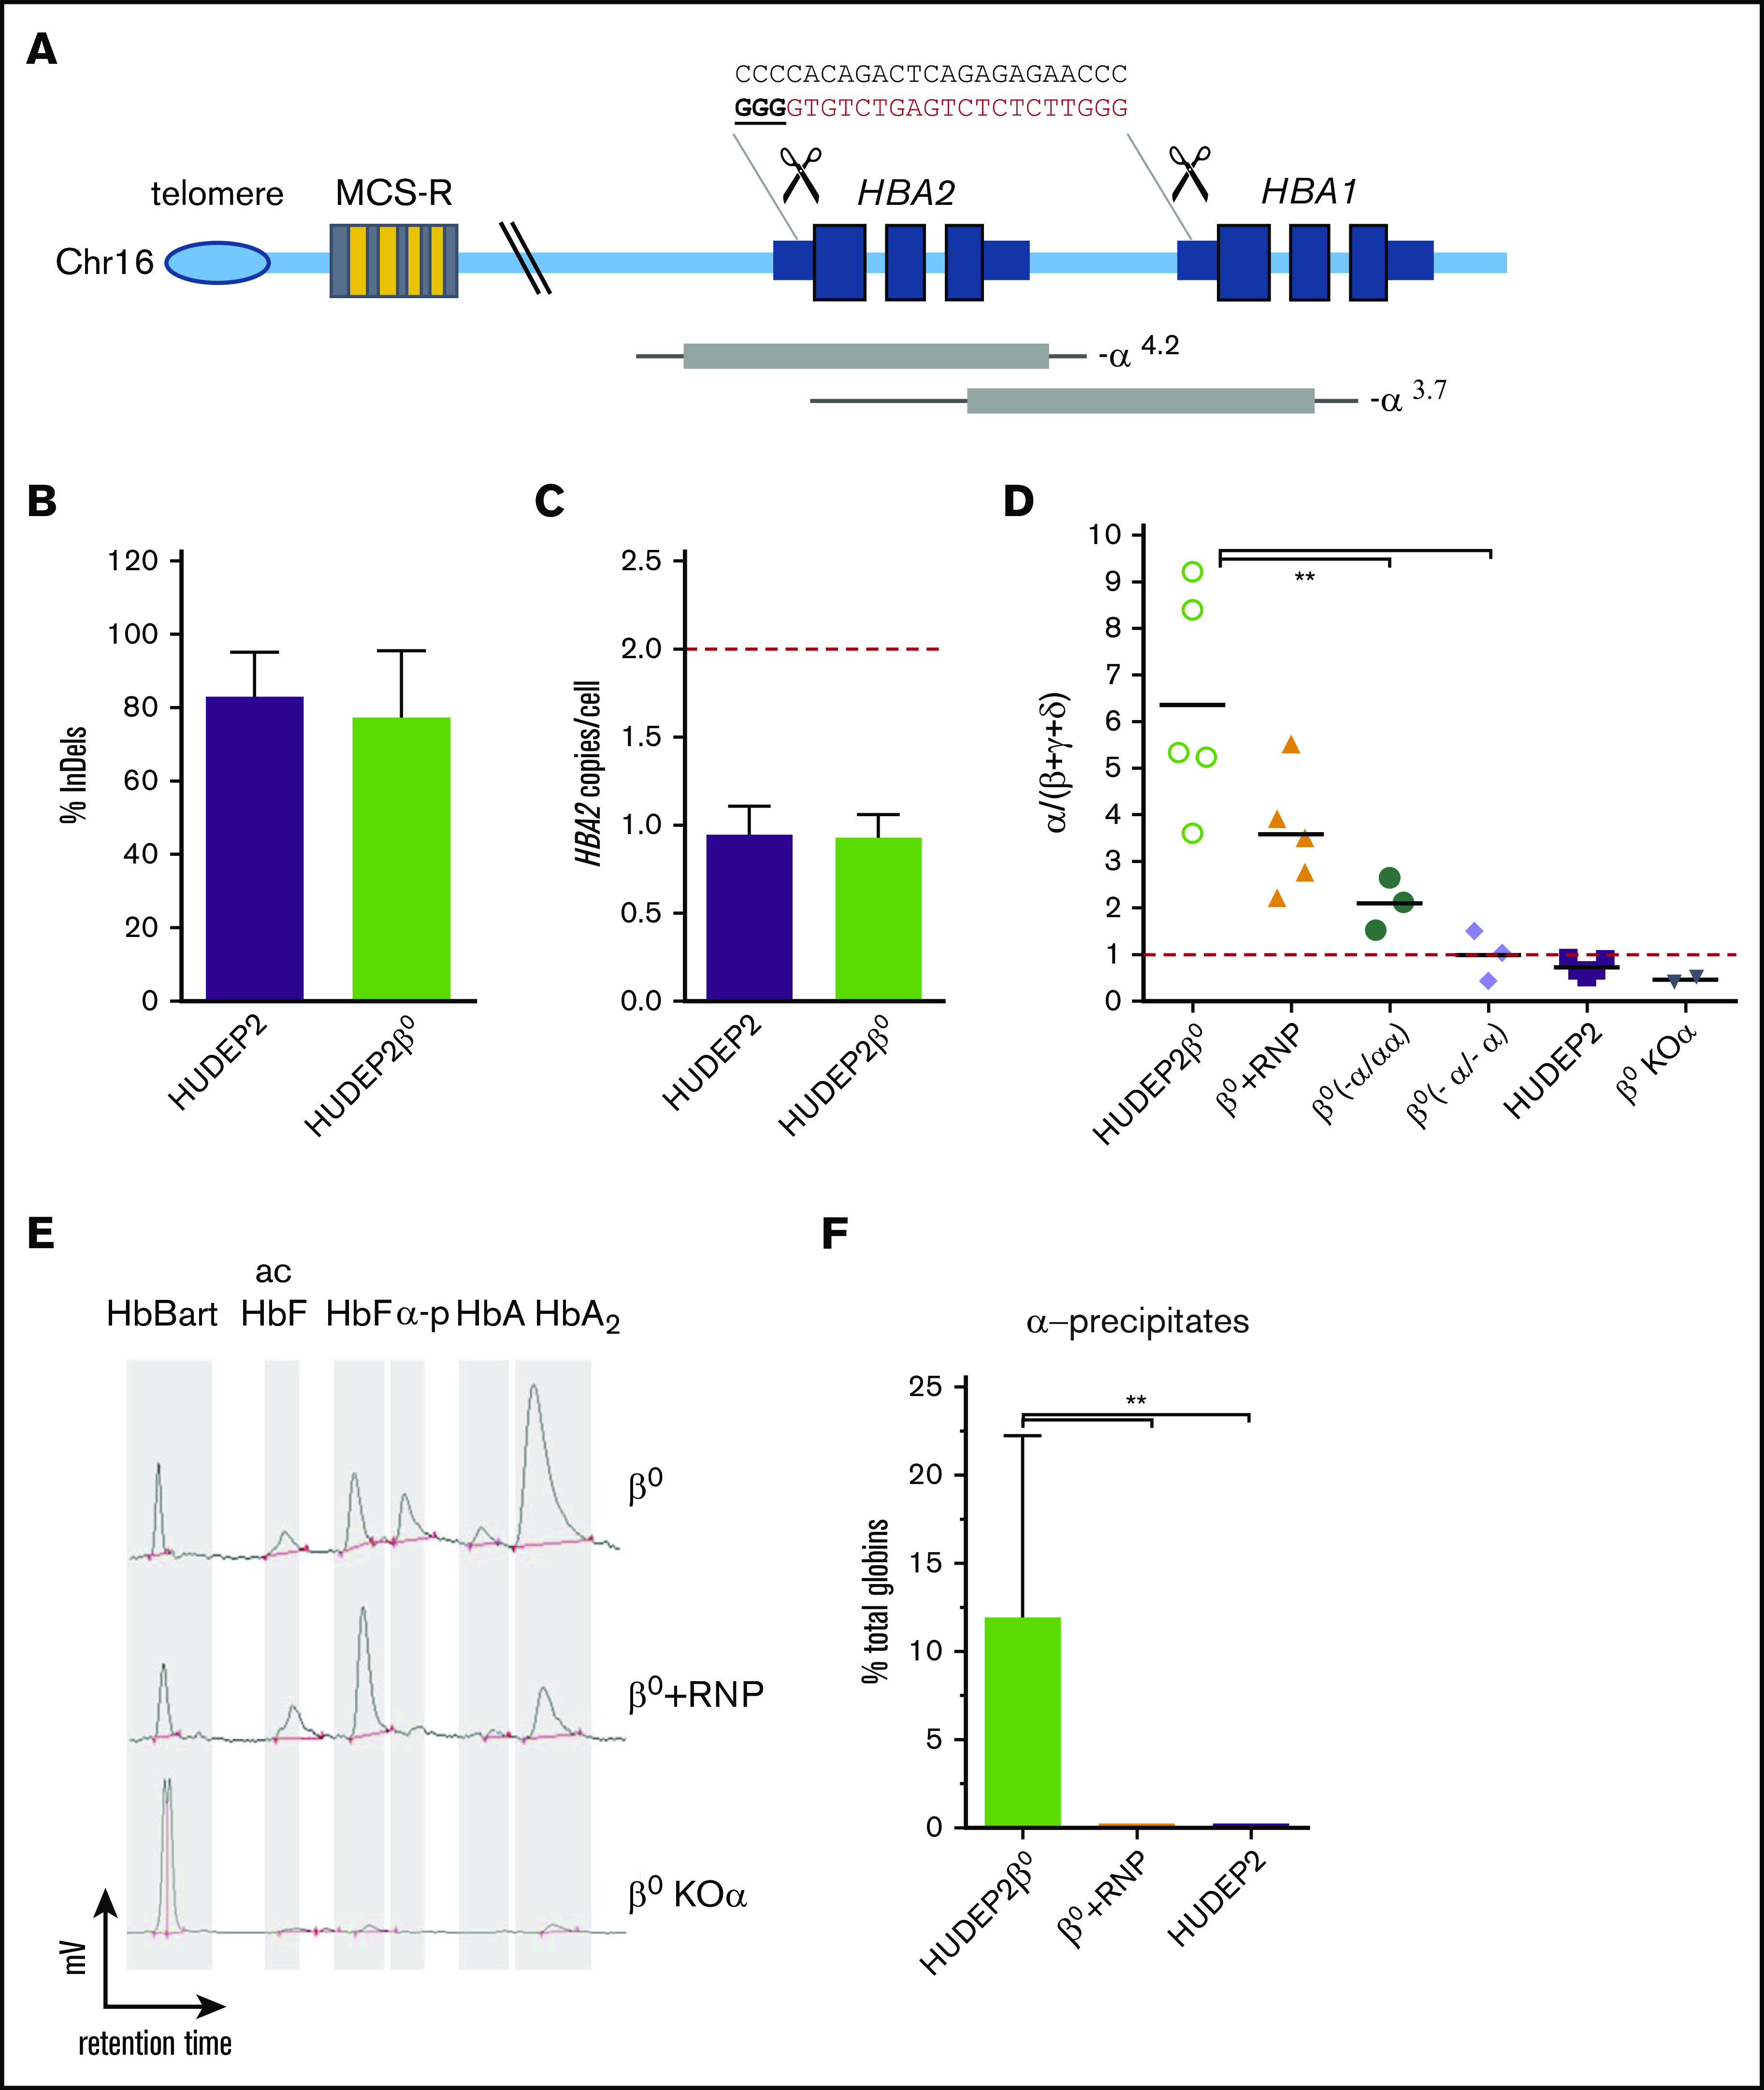
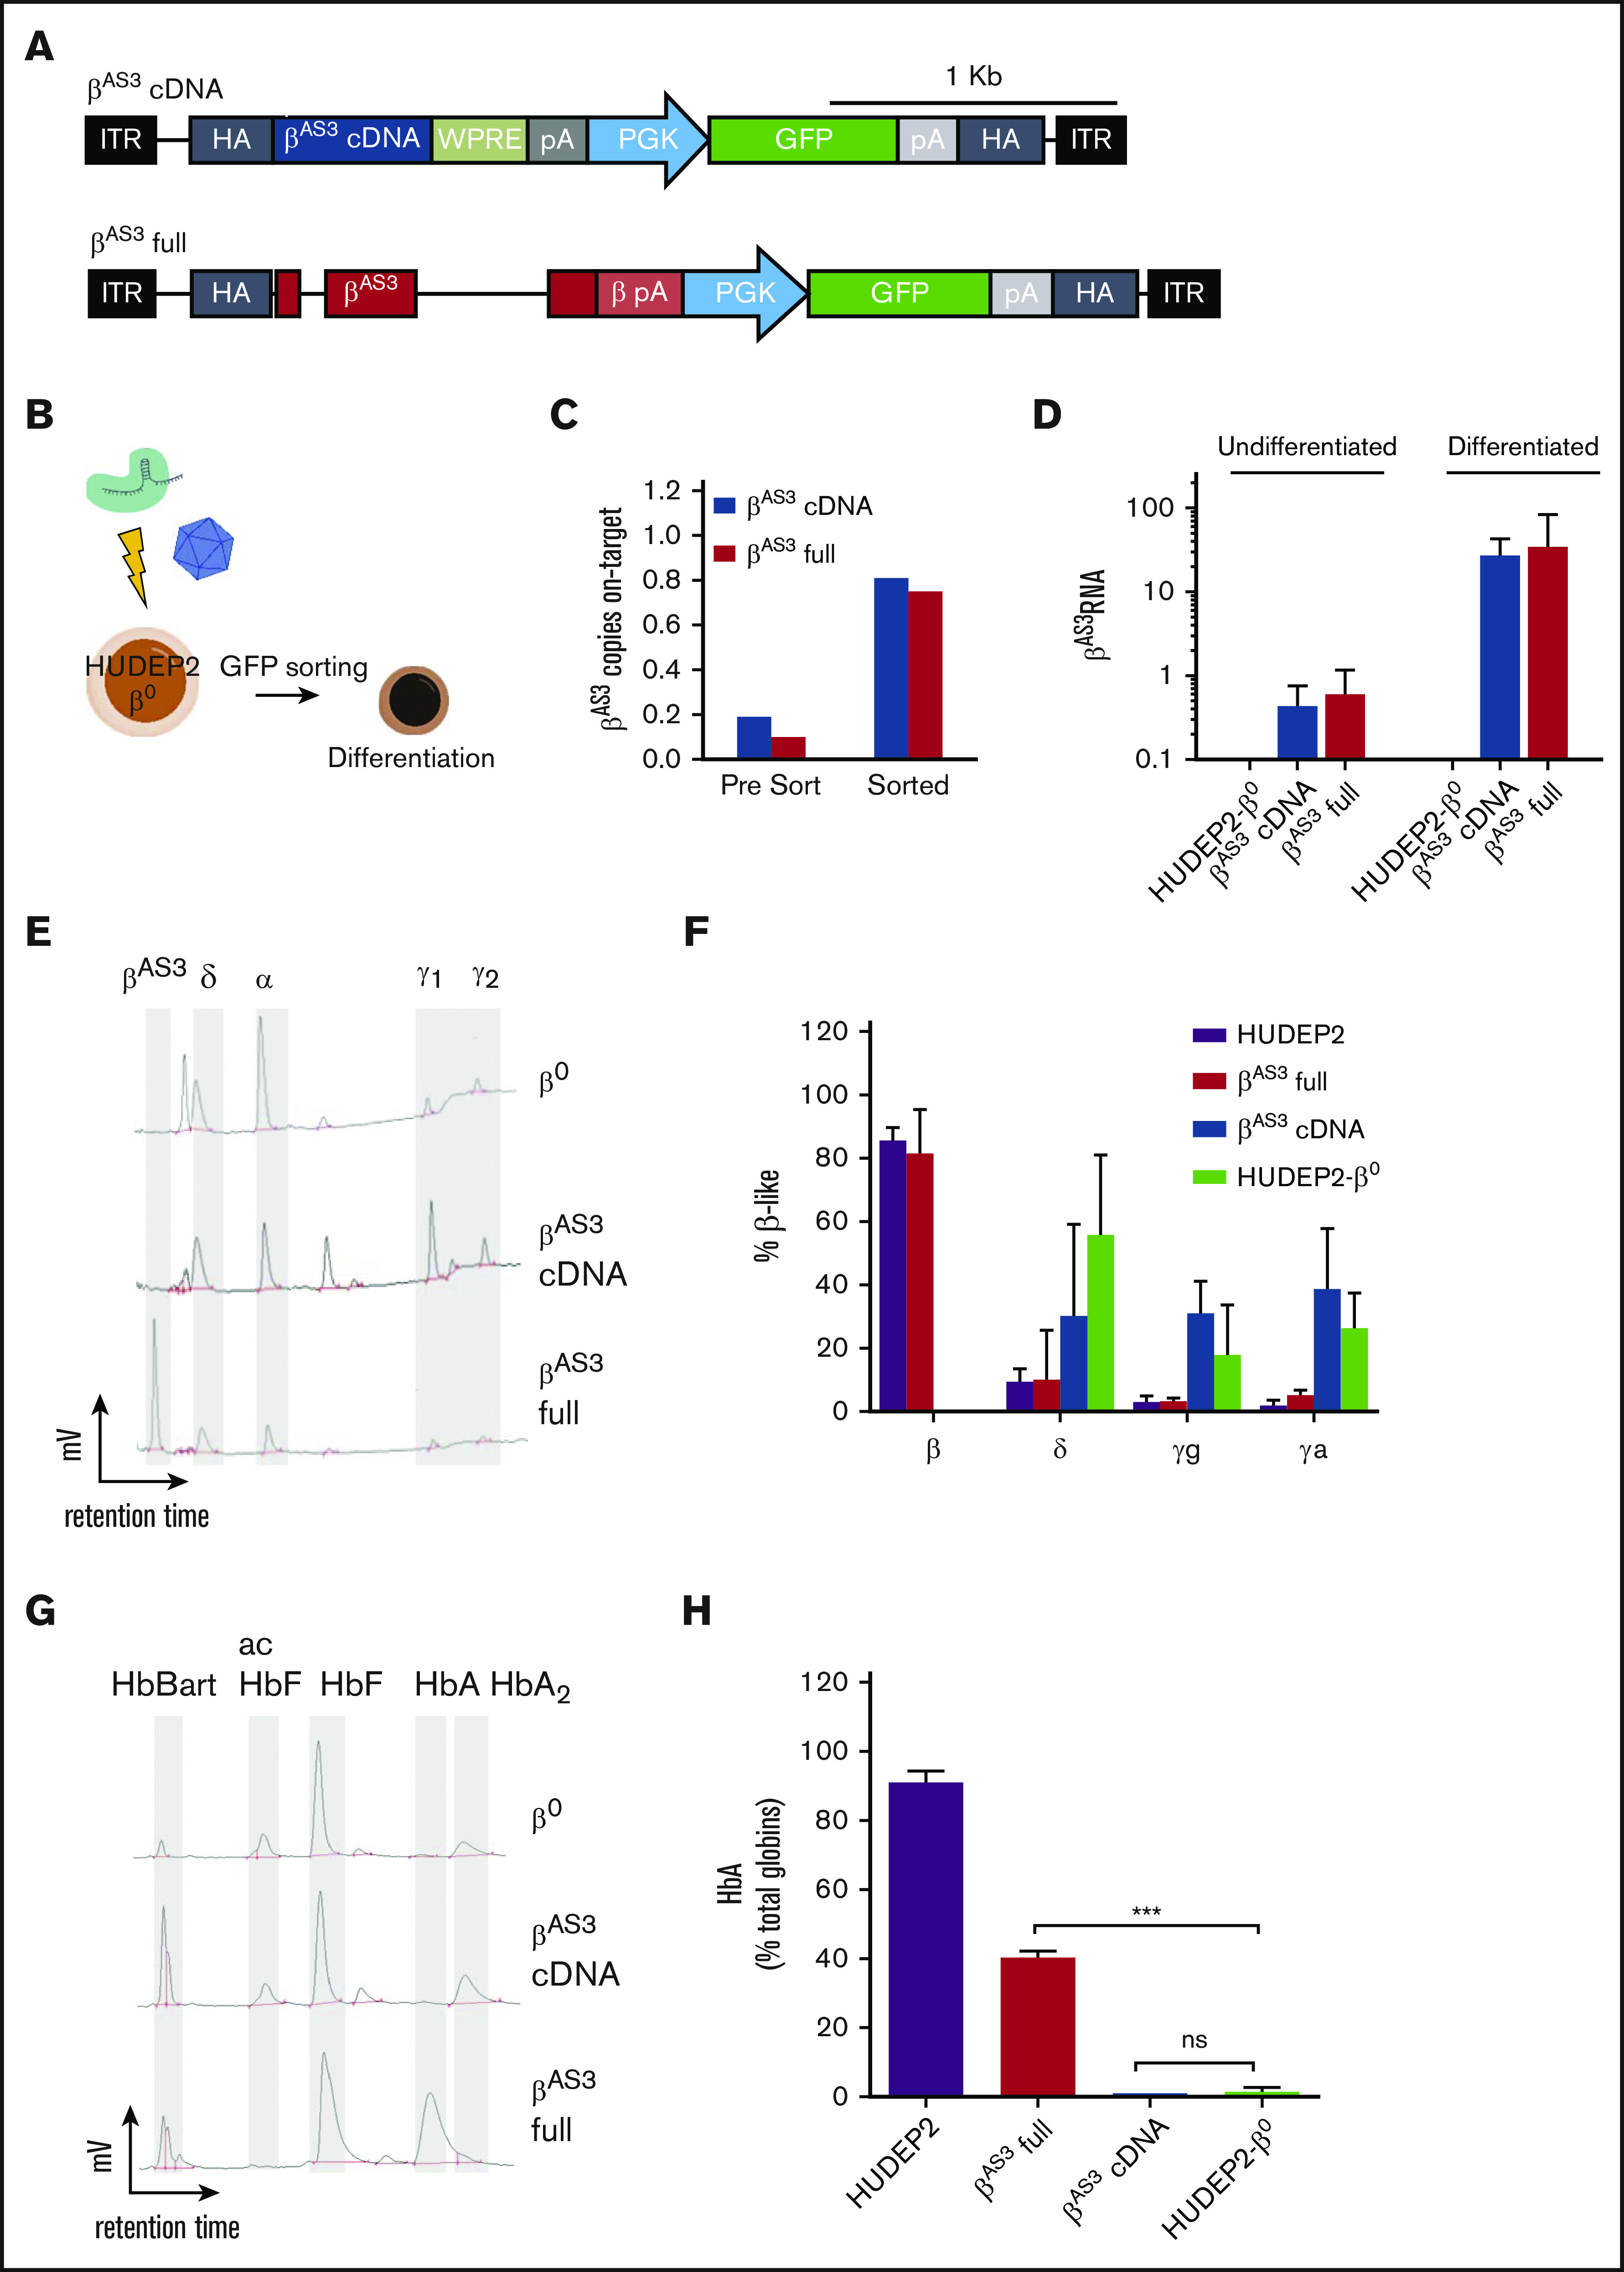
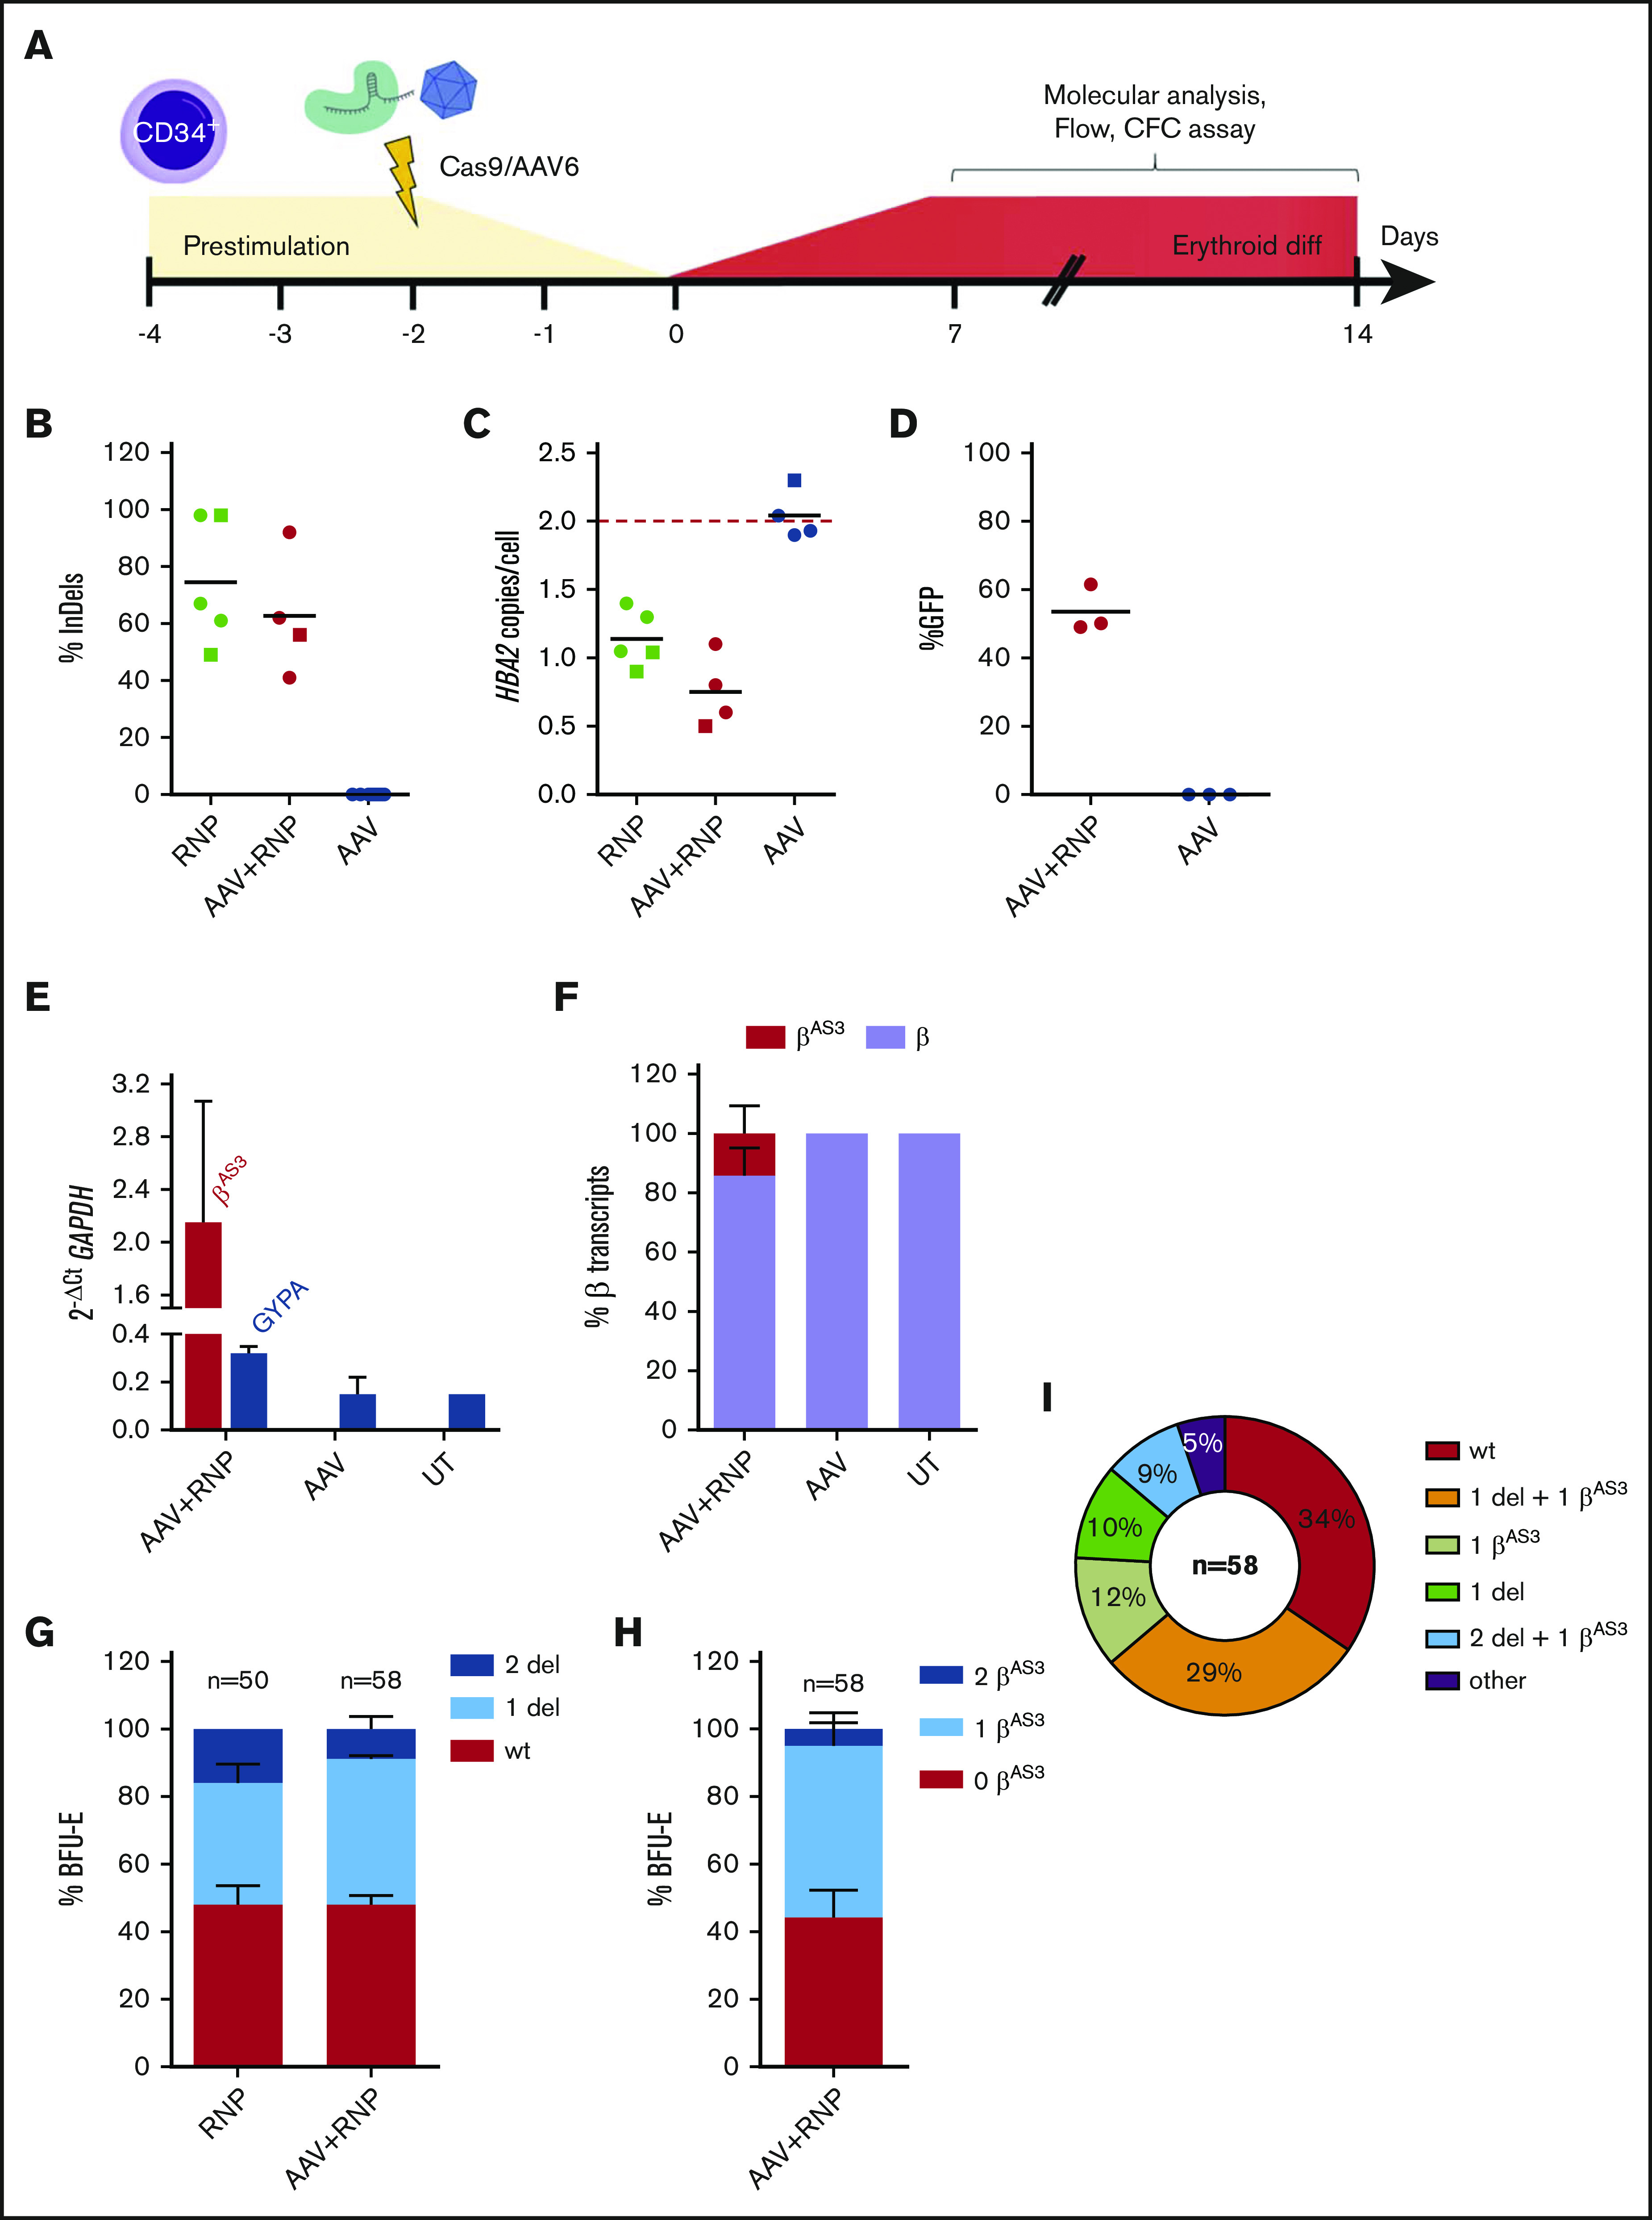
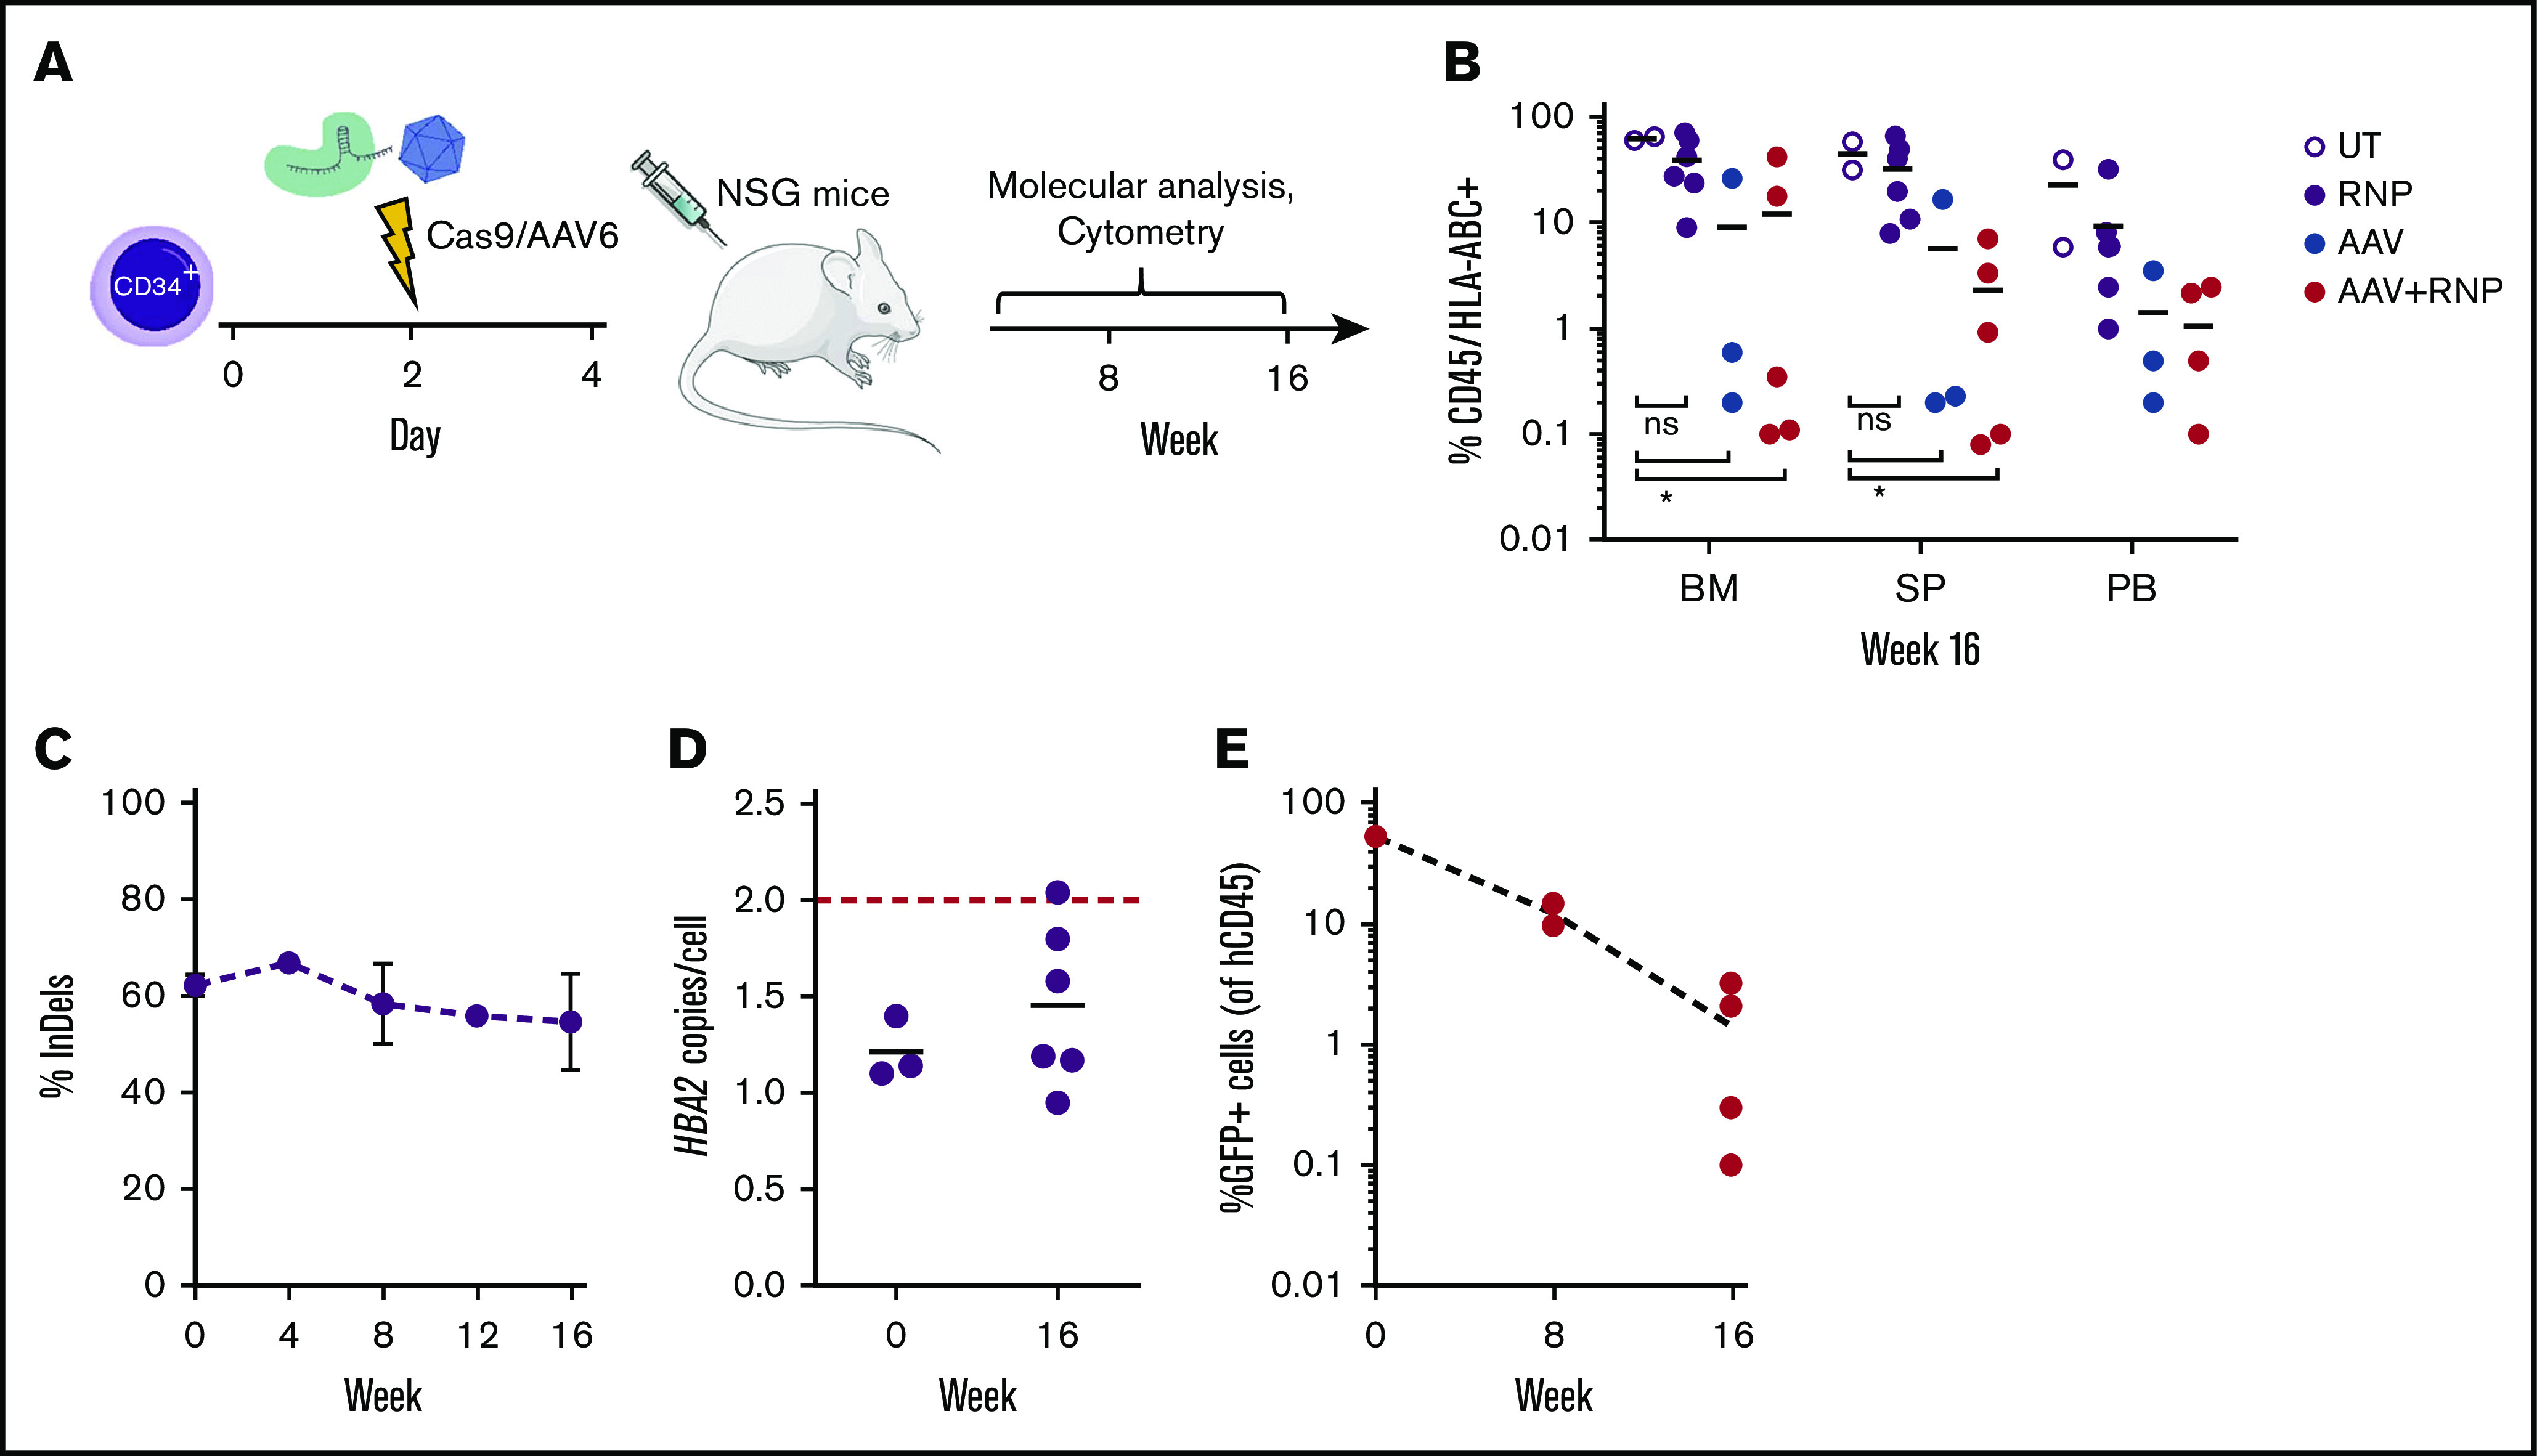
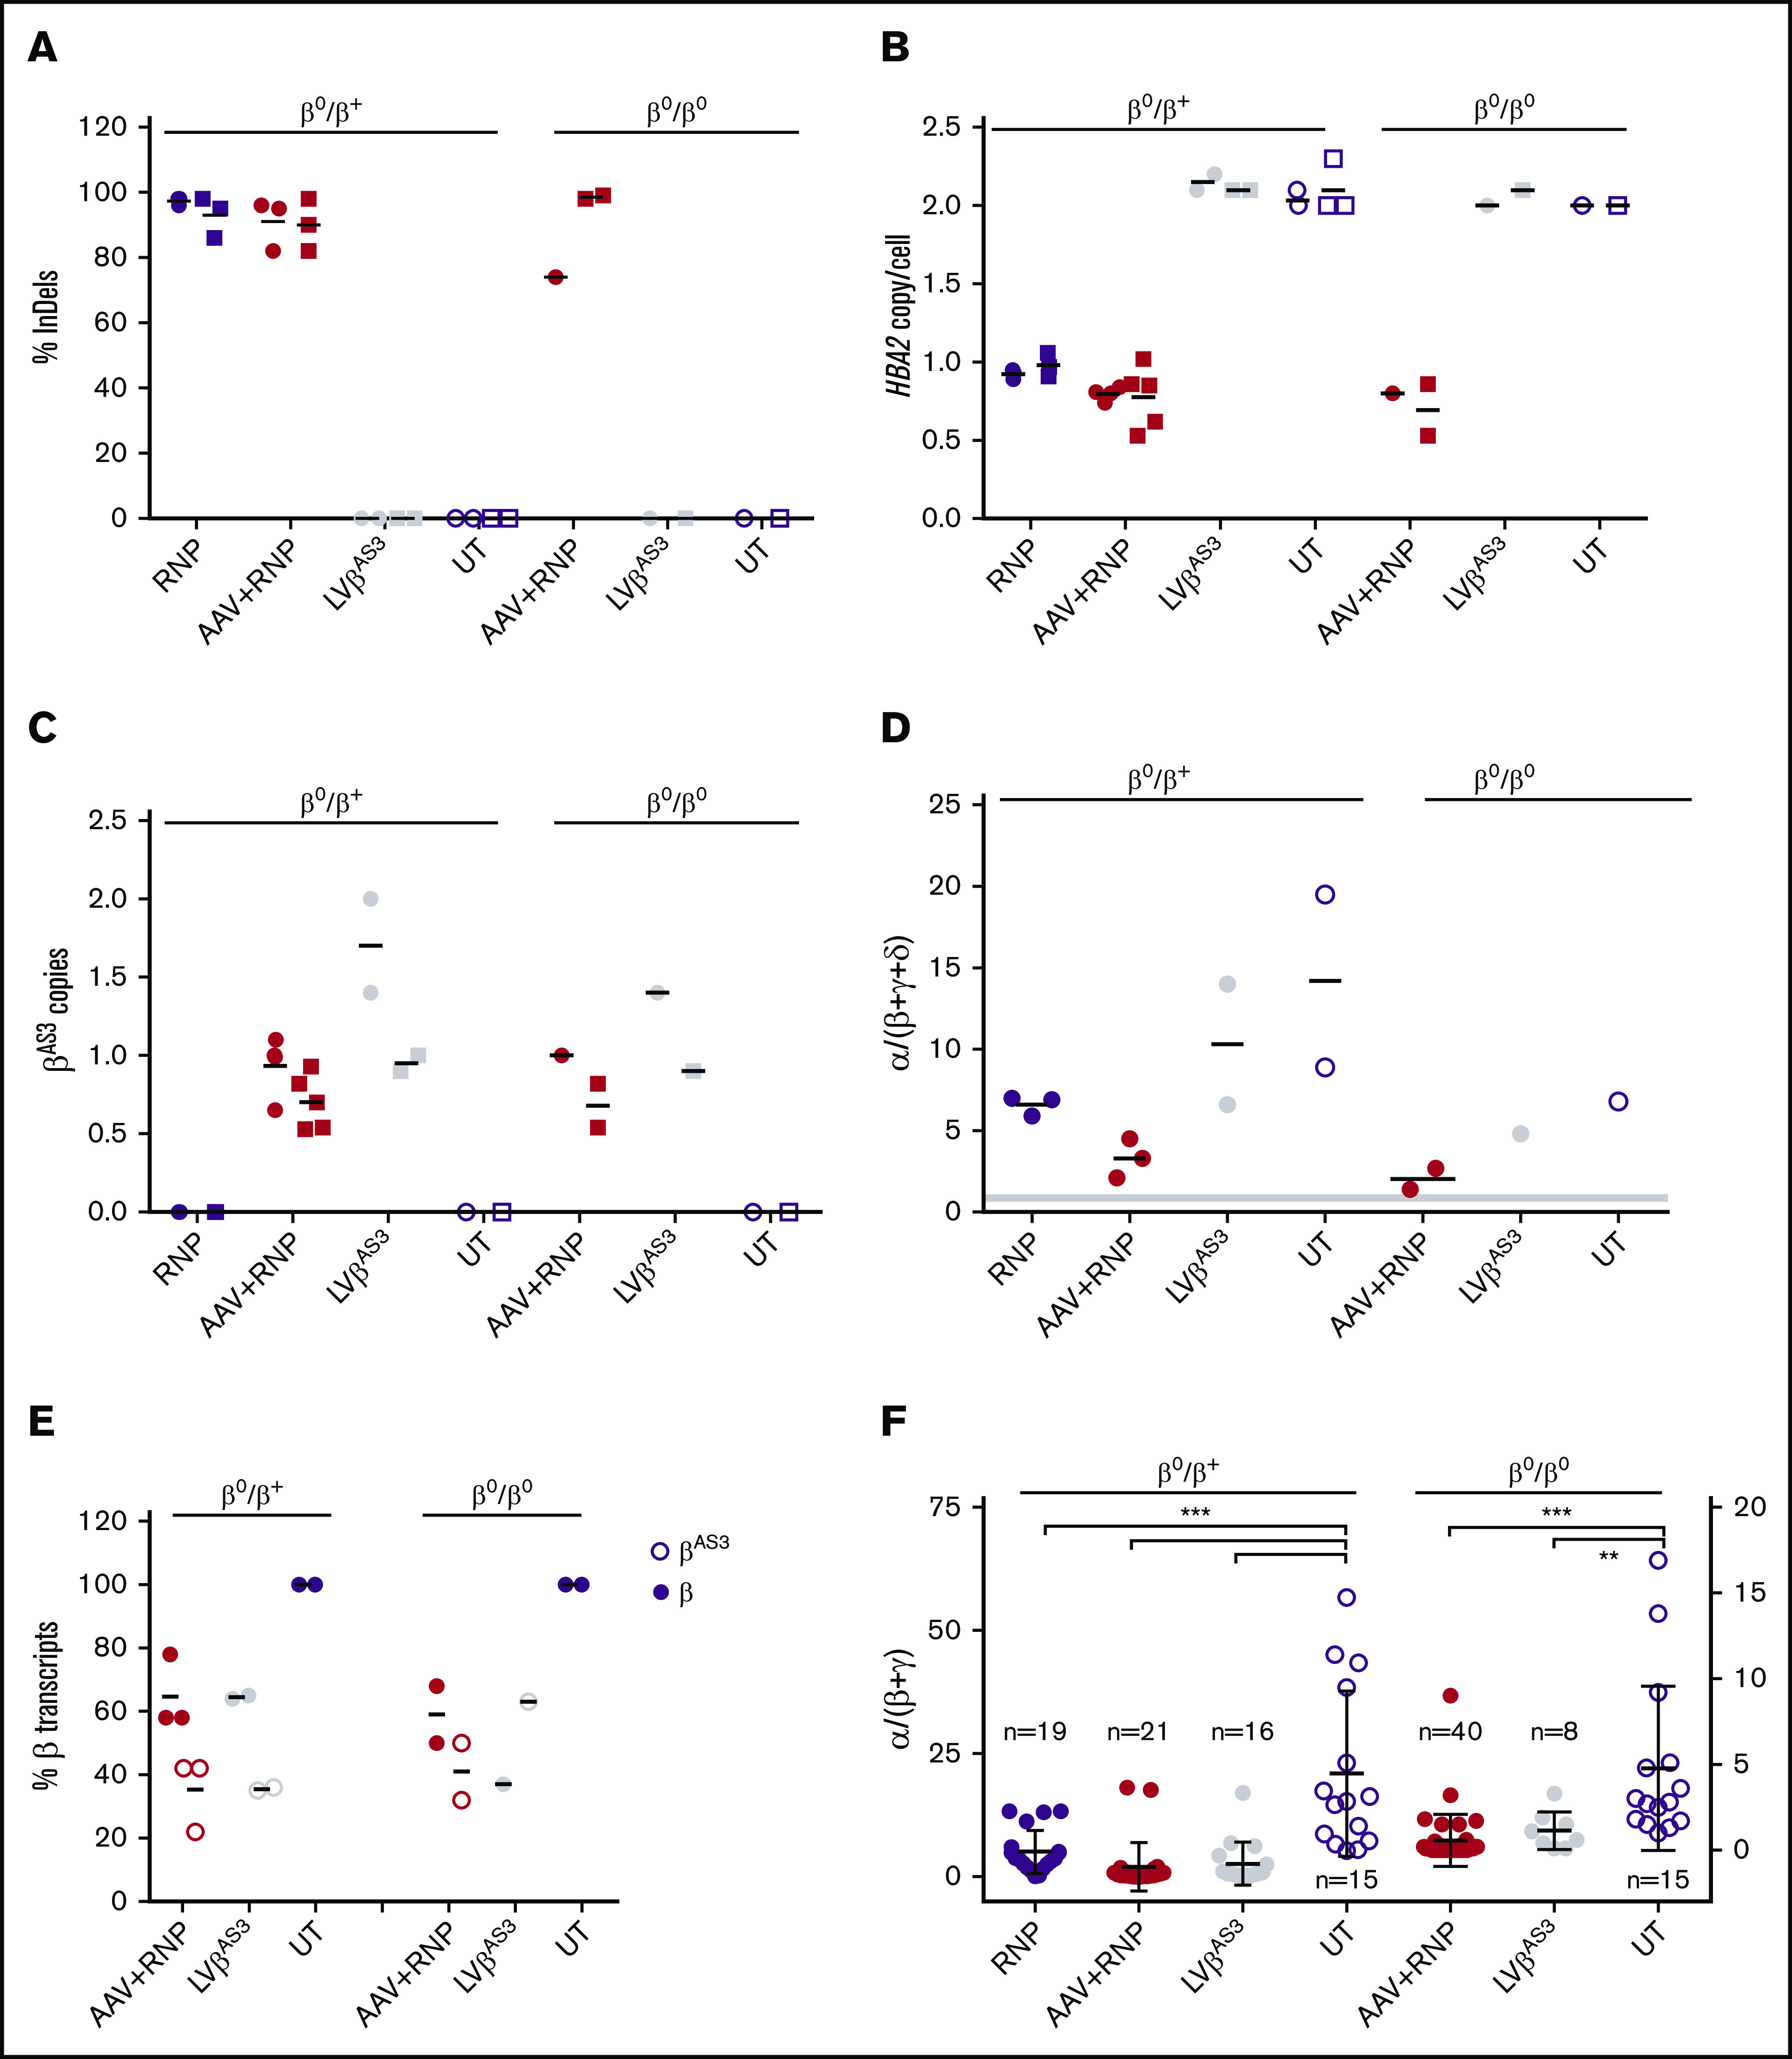
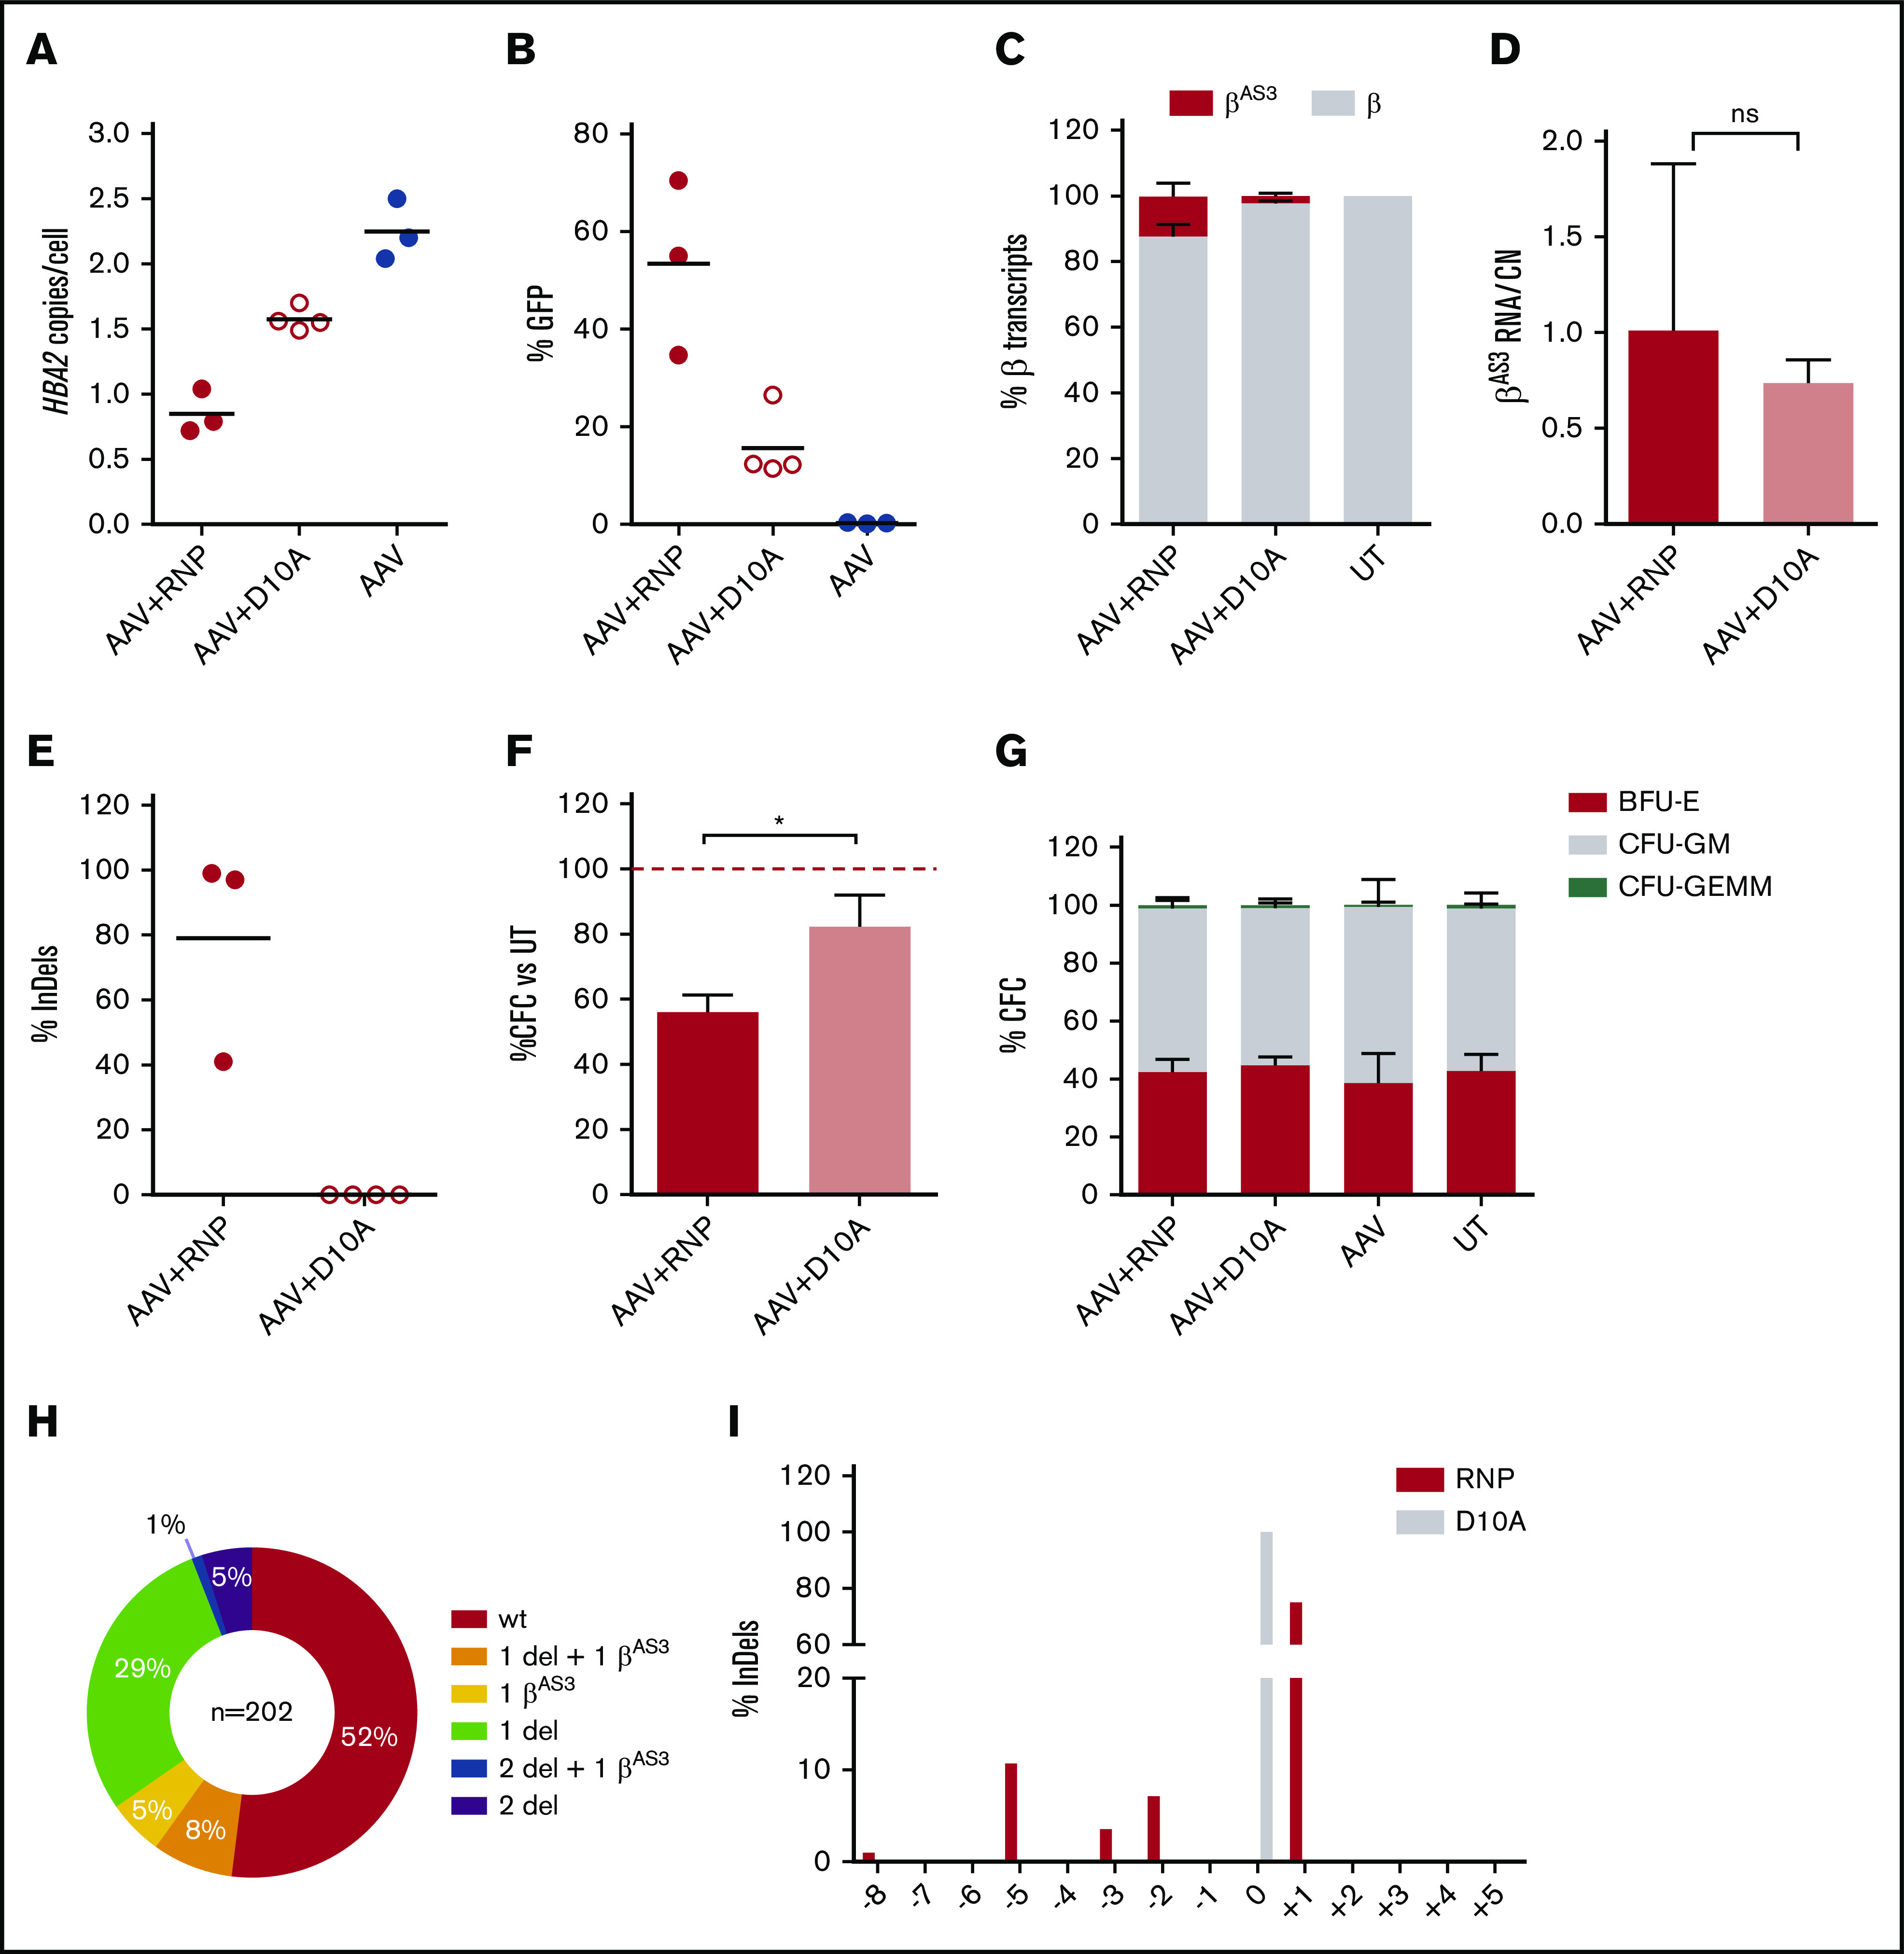
β-thalassemias (β-thal) are a group of blood disorders caused by mutations in the β-globin gene (HBB) cluster. β-globin associates with α-globin to form adult hemoglobin (HbA, α2β2), the main oxygen-carrier in erythrocytes. When β-globin chains are absent or limiting, free α-globins precipitate and damage cell membranes, causing hemolysis and ineffective erythropoiesis. Clinical data show that severity of β-thal correlates with the number of inherited α-globin genes (HBA1 and HBA2), with α-globin gene deletions having a beneficial effect for patients. Here, we describe a novel strategy to treat β-thal based on genome editing of the α-globin locus in human hematopoietic stem/progenitor cells (HSPCs). Using CRISPR/Cas9, we combined 2 therapeutic approaches: (1) α-globin downregulation, by deleting the HBA2 gene to recreate an α-thalassemia trait, and (2) β-globin expression, by targeted integration of a β-globin transgene downstream the HBA2 promoter. First, we optimized the CRISPR/Cas9 strategy and corrected the pathological phenotype in a cellular model of β-thalassemia (human erythroid progenitor cell [HUDEP-2] β0). Then, we edited healthy donor HSPCs and demonstrated that they maintained long-term repopulation capacity and multipotency in xenotransplanted mice. To assess the clinical potential of this approach, we next edited β-thal HSPCs and achieved correction of α/β globin imbalance in HSPC-derived erythroblasts. As a safer option for clinical translation, we performed editing in HSPCs using Cas9 nickase showing precise editing with no InDels. Overall, we described an innovative CRISPR/Cas9 approach to improve α/β globin imbalance in thalassemic HSPCs, paving the way for novel therapeutic strategies for β-thal.


Conflict of interest statement

Conflict-of-interest disclosure: G.P. and M.A. are the inventors of a patent describing this HSC-based gene therapy strategy for treating β-thalassemia (correction of β-thalassemia phenotype by genetically engineering hematopoietic stem cell; EP19305484.8). The remaining authors declare no competing financial interests.

Figures

None
Graphical abstract
Figure 1.
Figure 1.
Deletion of HBA2 reduces α-globin precipitates in HUDEP-2 β0cells. (A) Schematic representation of the α-globin locus. HBA1 and HBA2 genes are located in the subtelomeric region of chromosome (Chr) 16. Expression is regulated by 4 erythroid-specific enhancers (multispecies conserved elements [MCS-R]) located 10 to 50 kb upstream. Common occurring deletions are shown as gray bars and thin lines indicate regions of uncertainty of the breakpoints (adapted from Harteveld and Higgs). gRNA cutting sites are indicated as scissors. gRNA nucleotide sequence is indicated on top (in bold/underlined the protospacer adjacent motif sequence). (B) Editing efficiency in HUDEP-2 cells is expressed as percentage of modified HBA alleles. Bars represent mean ± SD (n = 3). (C) HBA2 copies in edited cells in panel B. Red dashed line indicates the number of expected HBA2 alleles in normal cells. (D) Reverse transcription-qPCR quantification of α/β-like globin mRNA ratios in HUDEP-2 β0 (n = 3-5) and in single-cell clones with monoallelic (α-/αα; n = 3) or biallelic (α-/α-; n = 3) HBA2 deletions. β0 + RNP = HUDEP2 β0 bulk population edited with gRNA HBA15/Cas9. β0 KOα = HUDEP2 β0 bulk population edited with gRNA HBB/Cas9 to induce α-globin KO. Red dashed line indicates the physiological α/β-like ratio of 1. Bars represent mean ± SD (**P < .01, ANOVA, Tukey test). (E) Representative HPLC chromatograms of globin tetramer analysis in edited HUDEP-2 β0. γ4, Hb Bart; acHbF, acetylated fetal hemoglobin; HbF, fetal hemoglobin (α2γ2); α-p, α-precipitates; HbA, adult hemoglobin (α2β2). (F) Quantification of α-precipitates. Every tetramer is reported as percent of total hemoglobins; bars show mean ± SD (n = 3; **P < .01; ANOVA, Tukey test).
Figure 2.
Figure 2.
Targeted integration of a βAS3transgene in the α-globin locus corrects thalassemic phenotype in HUDEP-2 β0cells. (A) AAV6 donors used for KI experiments. Both vectors contain a promoterless βAS3 transgene, followed by a phosphoglycerate kinase (PGK) promoter with a GFP reporter and simian virus pA. This cassette is flanked by 250-bp homology arms (homology) to gRNA genomic target. ITR, inverted terminal repeats. Top: βAS3 cDNA followed by the woodchuck posttranscriptionally regulatory element (WPRE) and SV40 pA (βAS3 cDNA); bottom: βAS3 transgene that includes endogenous introns, 3′UTR and pA (βAS3 full). A 1-kb scale bar is indicated at top. (B) Schematic representation of HUDEP-2 β0 targeting experiments. (C) KI efficiency of βAS3 cDNA (blue) or βAS3 full (red) in HUDEP-2 β0 cells measured by on-target ddPCR before and after sorting. (D) βAS3 transcript upregulation in targeted HUDEP-2 β0 upon erythroid differentiation (qPCR, n = 2, mean ± SD). (E-F) HPLC analysis of globin monomers in differentiated HUDEP-2 β0. Representative chromatograms (E) and relative quantification (F) of β-like subunits are shown; (mean ± SD; n = 3). (G-H) HPLC analysis of globin tetramers in differentiated HUDEP-2 β0. Representative chromatograms (G) and HbA (α2β2) quantification (H) are shown (mean ± SD, n = 3; **P < .01; ANOVA, Tukey test). ns, not significant.
Figure 3.
Figure 3.
HBA2 deletion and βAS3integration efficiency in HSPCs. (A) Schematic representation of HSPC targeting experiments. (B) Editing efficiencies in HSPCs at day 12 of erythroid differentiation. Lines represent mean. HBA2 copies (C) and KI efficiency (D) in edited HSPCs in erythroid liquid culture (●) or in BFU-E (■). Black lines represent mean; red line indicates the number of expected HBA2 alleles in untreated HSPCs. (E) βAS3 and glycophorin A (GYPA) transcripts in HSPC-derived erythroblasts (qPCR, n = 2, mean ± SD). (F) Relative abundance of endogenous β and KI-βAS3 mRNA at day 12 of erythroid liquid culture (n = 6, mean ± SD). HBA2 deletion (G) and βAS3 integration (H) pattern in single BFU-E. Bars represent mean ± SD (colonies derived from 2 independent experiments); no integration (0), monoallelic (1), and biallelic (2) KI or deletion (del). (I) Genotypes distribution of single KI-βAS3 BFU-E. Percentages are indicated (n = 58).
Figure 4.
Figure 4.
HBA2-deleted and βAS3KI HSPCs engraft NSG mice and maintain their multilineage potential. (A) Schematic representation of engraftment experiments. (B) Percentage of human CD45+/HLA-ABC+ cells in hematopoietic organs of mice. BM, bone marrow; PB, peripheral blood; SP, spleen. Black lines indicate mean. (C) InDel efficiency in PB of RNP-engrafted mice at different timepoints (mean ± SD; n = 2-4). (D) HBA2 copies in RNP-treated HSPCs at day 0 (injection) and in BM of engrafted mice at week 16. Black lines indicate mean; red line indicates the number of expected HBA2 alleles in untreated HSPCs. (E) GFP+ cells in PB of transplanted mice over time. GFP is expressed as percentage of CD45+ cells; line indicates mean.
Figure 5.
Figure 5.
Genome editing of the α-globin locus ameliorates globin balance in thalassemic HSPCs. InDels (A), HBA2 copies (B), and βAS3 integrated copies (C) quantification in edited thalassemic HSPCs in erythroid liquid culture (●) or in BFU-E (■). Black lines represent mean. HSPCs from 1 patient of each genotype were used. (D) α/β-like globin mRNA ratios in edited thalassemic erythroblasts at day 12. Black lines indicate mean; gray line shows the range of α/β-like globin ratio in healthy donor MPB and UCB HSPCs (n = 5). (E) Relative abundance of endogenous β and integrated βAS3 mRNA at day 12 of erythroid liquid culture. Black lines represent mean. (F) α/β-like globin mRNA ratios in edited thalassemic BFU-E. β0+colonies (n = 71) are plotted on the left axis, β00 (n = 63) on the right axis. Each dot represents a single colony. Black lines indicate mean ± SD (***P < .001; **P < .01; ANOVA, Tukey test). HSPCs derived from 1 patient of each genotype were used for this figure.
Figure 6.
Figure 6.
Cas9 nickase editing results in seamless HBA2 deletion and reduced HSPCs toxicity. (A-B) HBA2 copies (A) and KI efficiency (B) in Cas9 (RNP) or Cas9 nickase (RNP D10A) edited HSPCs in erythroid liquid culture. Black lines represent mean. (C) Relative abundance of endogenous β and KI-βAS3 mRNA at day 12 of erythroid liquid culture (mean ± SD, n = 3-4). (D) expression of βAS3 transcripts normalized by copy number (CN) in Cas9- or Cas9 nickase-treated erythroblasts (mean ± SD, n = 4-5). (E) InDel quantification at gRNA target site in edited HSPCs. Black lines represent mean. (F) CFC number expressed as percentage of untreated control (UT). Bars represent mean ± SD (n = 3-4); red dashed line indicates 100%. (G) CFU frequency in edited HSPCs. BFU-E, burst-forming unit-erythroid; CFU-GM, CFU-granulocyte, macrophage. Colony-forming unit-granulocyte, erythroid, macrophage, megakaryocyte; Bars represent mean ± SD (n = 2-4). (H) Genotypes of BFU-E (n = 202) derived from RNP D10A + AAV HSPCs. Percentages are indicated. (I) Frequency of different InDel patterns in HBA2 deleted BFU-E treated with Cas9 (RNP, red; n = 28) or Cas9 nickase (RNP D10A, gray; n = 96). Editing was measured across HBA2 deletion junctions.

References

    1. Cao A, Galanello R. Beta-thalassemia. Genet Med. 2010;12(2):61-76. - PubMed
    1. Weatherall DJ. The challenge of haemoglobinopathies in resource-poor countries. Br J Haematol. 2011;154(6):736-744. - PubMed
    1. Mettananda S, Gibbons RJ, Higgs DR. α-Globin as a molecular target in the treatment of β-thalassemia. Blood. 2015;125(24):3694-3701. - PMC - PubMed
    1. Sharma V, Saxena R. Effect of alpha-gene numbers on phenotype of HbE/beta thalassemia patients. Ann Hematol. 2009;88(10):1035-1036. - PubMed
    1. Fucharoen S, Weatherall DJ. The hemoglobin E thalassemias. Cold Spring Harb Perspect Med. 2012;2(8):a011734. - PMC - PubMed

Publication types