. 2021 Apr 15;131(8):e145853.
doi: 10.1172/JCI145853.

Identification of SARS-CoV-2-specific immune alterations in acutely ill patients

Affiliations

Identification of SARS-CoV-2-specific immune alterations in acutely ill patients

Rose-Marie Rébillard et al. J Clin Invest. .

Abstract

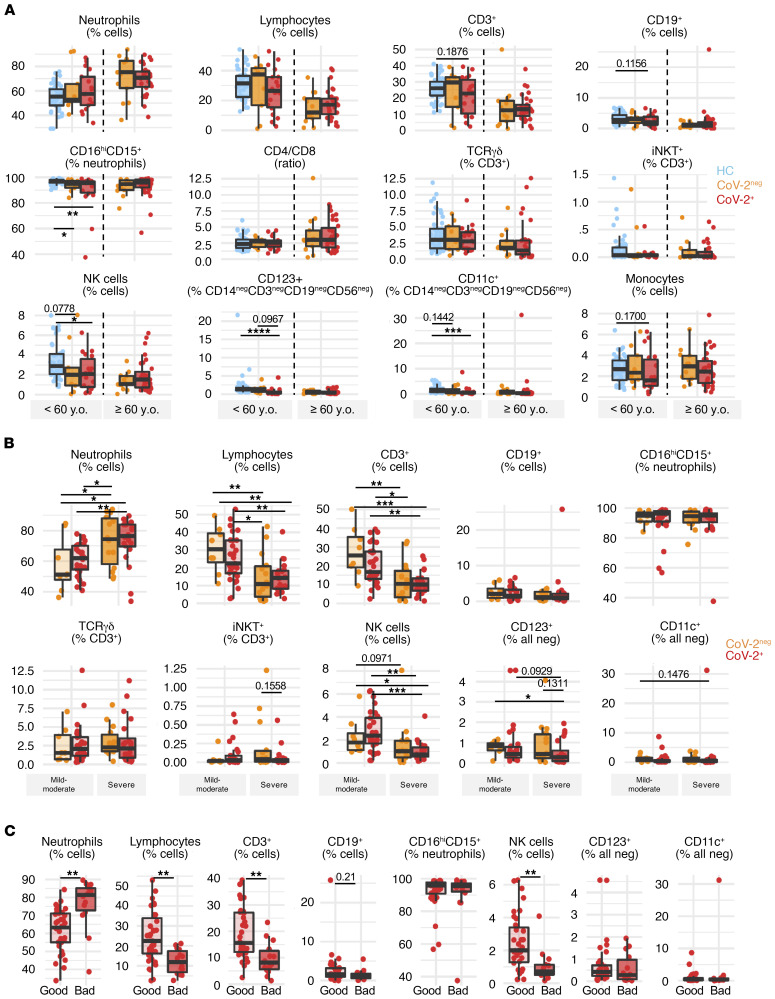
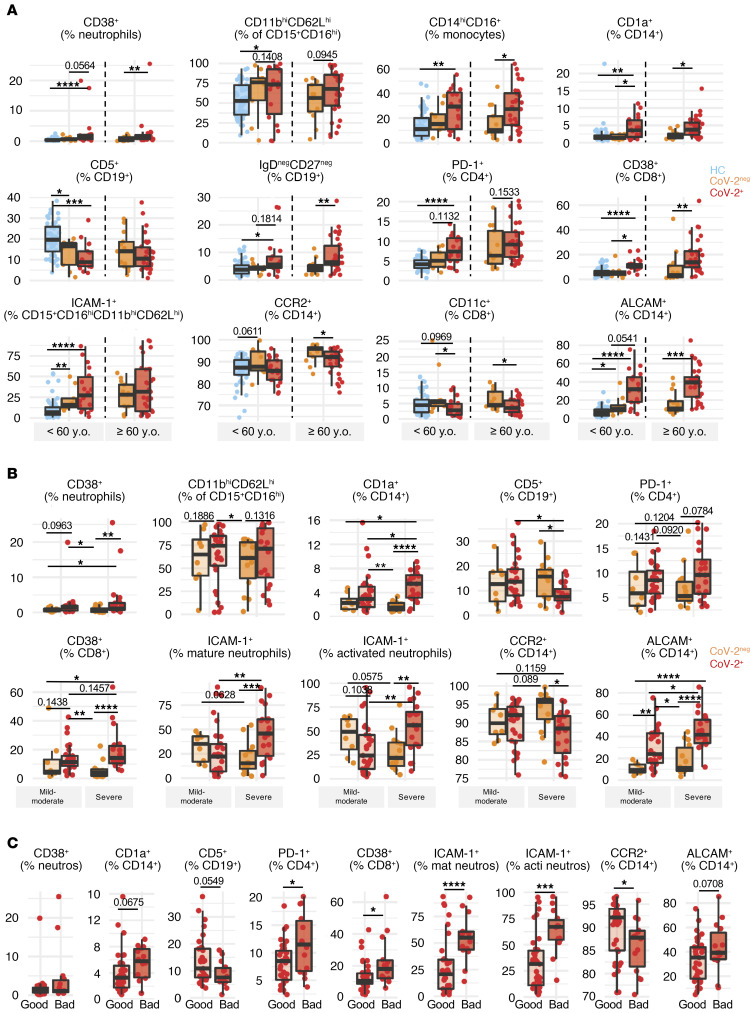
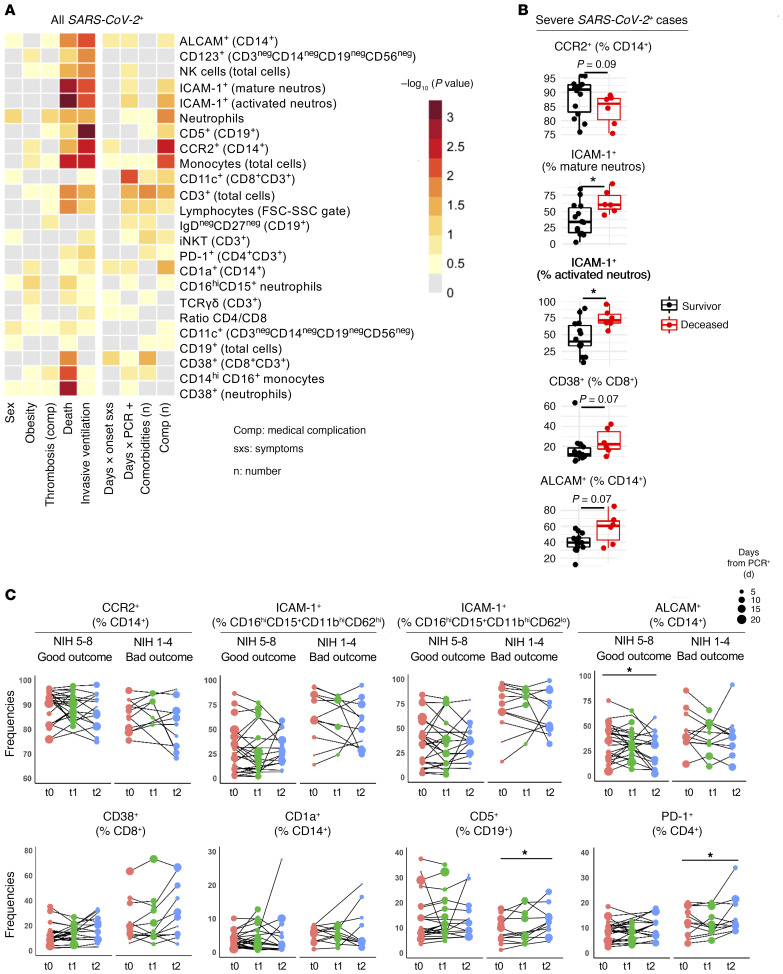
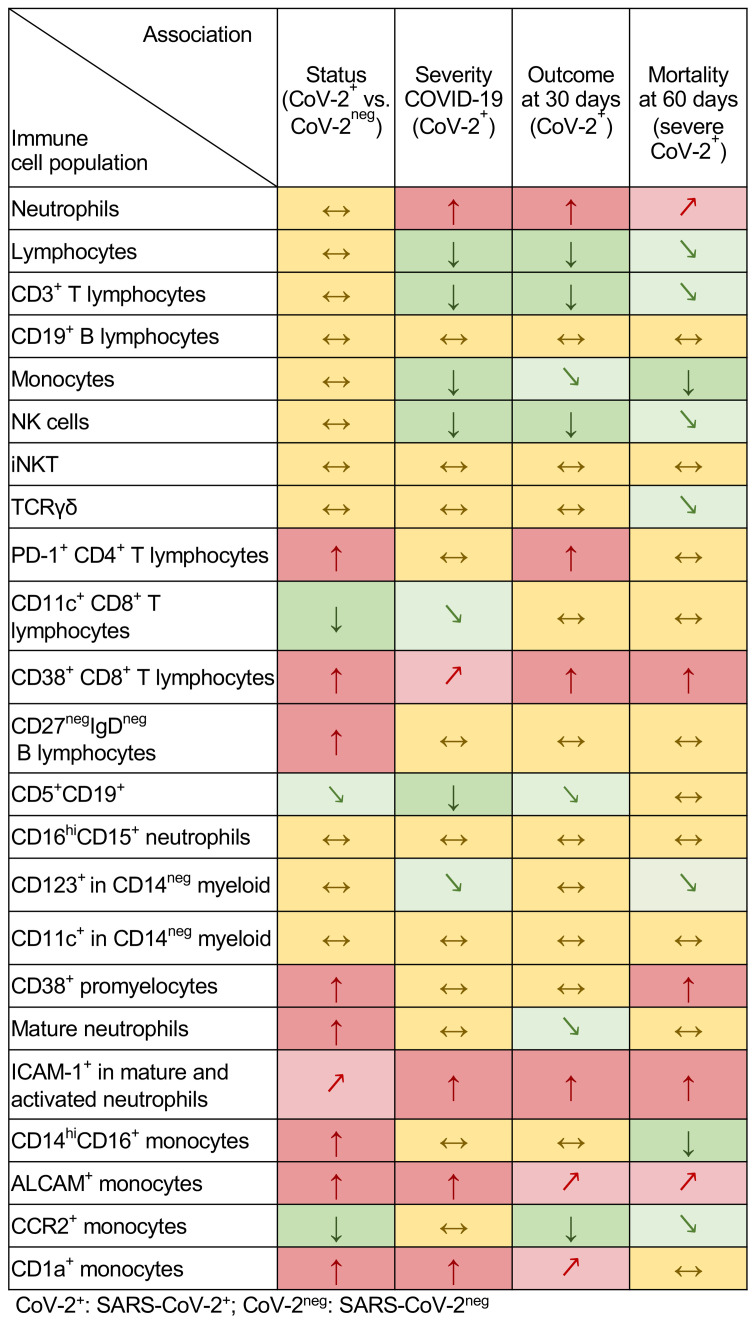
Dysregulated immune profiles have been described in symptomatic patients infected with SARS-CoV-2. Whether the reported immune alterations are specific to SARS-CoV-2 infection or also triggered by other acute illnesses remains unclear. We performed flow cytometry analysis on fresh peripheral blood from a consecutive cohort of (a) patients hospitalized with acute SARS-CoV-2 infection, (b) patients of comparable age and sex hospitalized for another acute disease (SARS-CoV-2 negative), and (c) healthy controls. Using both data-driven and hypothesis-driven analyses, we found several dysregulations in immune cell subsets (e.g., decreased proportion of T cells) that were similarly associated with acute SARS-CoV-2 infection and non-COVID-19-related acute illnesses. In contrast, we identified specific differences in myeloid and lymphocyte subsets that were associated with SARS-CoV-2 status (e.g., elevated proportion of ICAM-1+ mature/activated neutrophils, ALCAM+ monocytes, and CD38+CD8+ T cells). A subset of SARS-CoV-2-specific immune alterations correlated with disease severity, disease outcome at 30 days, and mortality. Our data provide an understanding of the immune dysregulation specifically associated with SARS-CoV-2 infection among acute care hospitalized patients. Our study lays the foundation for the development of specific biomarkers to stratify SARS-CoV-2-positive patients at risk of unfavorable outcomes and to uncover candidate molecules to investigate from a therapeutic perspective.

Keywords: Adaptive immunity; COVID-19; Innate immunity.


Conflict of interest statement

Conflict of interest: The authors have declared that no conflict of interest exists.

Figures

Figure 1
Figure 1. Clinical characteristics of hospitalized patients.
Association among clinical parameters in hospitalized patients as illustrated by heatmap and hierarchical clustering of the –log10(P value). Fisher’s exact test for association of binary variables (upper part), and Wilcoxon’s rank-sum test for association between binary and continuous variables (lower part). Blue squares indicate that only SARS-CoV-2+ patients were considered for this parameter.
Figure 2
Figure 2. Data-driven flow cytometry analysis.
(A) Representative dot plots of multiple samples acquired in 4 different batches for CD19-BV605, CD4-BUV496, IgD-PE-Cy7, and CD24-PerCP-Cy5.5. Red arrows identify samples from the same individual acquired in 2 different batches. (BD) Representation of FlowSOM populations on UMAP projection axis and (EG) their corresponding heatmaps showing geometric mean fluorescence of the different markers for the different subpopulations (data-driven analysis). Cellular markers are indicated on the x axis and population number on the y axis of heatmaps.
Figure 3
Figure 3. Data-driven analysis shows common and distinct alterations in immune cell populations in SARS-CoV-2+ and SARS-CoV-2 hospitalized patients.
(AC) Data-driven analysis. (A) Heatmap showing the median frequencies of immune cell populations differentially regulated in SARS-CoV-2+ patients (CoV-2+), SARS-CoV-2 patients (CoV-2), and healthy control (HC) samples. (B and C) Box-and-whisker plots showing frequencies of dysregulated immune cell populations in (B) CoV-2+ (red) compared with CoV-2 (yellow) and HC (blue) and in (C) hospitalized patients (both CoV-2+ and CoV-2) compared with HC (blue). HC, n = 49; CoV-2, n = 21; CoV-2+, n = 42. Kruskal-Wallis test followed by a Dunn’s post hoc test for multiple pairwise comparisons. *P < 0.05; **P < 0.01; ****P < 0.0001.
Figure 4
Figure 4. Hypothesis-driven analysis identifies common and distinct alterations in immune cell populations in SARS-CoV-2+ and SARS-CoV-2 hospitalized patients.
(AC) Hypothesis-driven (based on conventional manual gating) analysis. Heatmaps showing the median frequency of immune cell populations identified as significantly altered (adjusted P < 0.05) in CoV-2+ (n = 50) compared with HC (n = 49) and/or CoV-2 (n = 22) in stain 1 (S1 panel), stain 2 (S2 panel), and stain 3 (S3 panel). Kruskal-Wallis test followed by a Dunn’s post hoc test for multiple pairwise comparisons. Nominal P values were adjusted for multiple testing within each stain, FDR significance threshold set at 0.05. Color scale indicates the z score, across the groups, of subpopulation median frequencies. *P < 0.05 for populations significantly altered in SARS-CoV-2+ compared with HC and with SARS-CoV-2 samples. Monos, monocytes; Neutros, neutrophils; Lymphos, lymphocytes.
Figure 5
Figure 5. Alterations in immune cell populations commonly observed in SARS-CoV-2+ and SARS-CoV-2 hospitalized patients.
(AC) Frequencies of different subsets of immune cell populations in peripheral blood (hypothesis-driven analysis based on conventional manual gating) from SARS-CoV-2+ (CoV-2+, red) and SARS-CoV-2 (CoV-2, yellow) hospitalized patients and healthy controls (HC, blue) (A) according to age group (HC <60 years n = 49; CoV-2 hospitalized <60 years n = 9, ≥60 years n = 13; CoV-2+ <60 years n = 20, ≥60 years n = 30), (B) according to disease severity in hospitalized patients (CoV-2 mild/moderate disease n = 8, severe disease n = 14; CoV-2+ mild/moderate disease n = 29, severe disease n = 21), and (C) according to clinical outcome at 30 days in SARS-CoV-2+ patients (NIH score 5–8, n = 36) versus (NIH score 1–4, n = 14). Mann-Whitney U test (for n = 2 categories) and Kruskal-Wallis test (for n > 2 categories) followed by Dunn’s post hoc test for multiple pairwise comparisons were used. Each symbol represents 1 donor. *P < 0.05; **P < 0.01; ***P < 0.001; ****P < 0.0001.
Figure 6
Figure 6. Alterations in immune cell populations distinguishing SARS-CoV-2+ from SARS-CoV-2 hospitalized patients.
(AC) Frequencies of different subsets of immune cell populations in peripheral blood (hypothesis-driven analysis based on conventional manual gating) from SARS-CoV-2+ (CoV-2+, red) and SARS-CoV-2 (CoV-2, yellow) hospitalized patients and healthy controls (HC, blue) (A) according to age groups (HC <60 years n = 49; CoV-2 hospitalized <60 years n = 9, ≥60 years n = 13; CoV-2+ <60 years n = 20, ≥60 years n = 30), (B) according to disease severity in hospitalized patients (CoV-2 mild/moderate disease n = 8, severe disease n = 14; CoV-2+ mild/moderate disease n = 29, severe disease n = 21), and (C) according to clinical outcome at 30 days in SARS-CoV-2+ patients (NIH score 5–8, n = 36) versus (NIH score 1–4, n = 14). Mann-Whitney U test (for n = 2 categories) and Kruskal-Wallis test (for n > 2 categories) followed by Dunn’s post hoc test for multiple pairwise comparisons were used. Each symbol represents 1 donor. *P < 0.05; **P < 0.01; ***P < 0.001; ****P < 0.0001.
Figure 7
Figure 7. Association between clinical parameters and longitudinal analysis of immune cell populations altered in SARS-CoV-2+ patients.
(A) Association between immune cell subsets and clinical parameters in SARS-CoV-2+ patients as illustrated by heatmap and hierarchical clustering of the –log10(P value) analyzed by Mann-Whitney U test for categorical clinical parameters and by Spearman’s correlation for continuous clinical parameters. (B) Proportions of different immune cell subsets among severe SARS-CoV-2+ patients (severe COVID-19) according to survival at 60 days. Mann-Whitney U test was used. (C) Changes over time in frequencies of selected populations identified as specific to SARS-CoV-2+, between baseline (t0), 24–72 hours (t1), and 4–7 days (t2). Size of dots reflects delay (in days) between first documented positive SARS-CoV-2 PCR to baseline sampling. Baseline samples were taken a median of 6 days (31/38 within 2- to 10-day interval) after first positive SARS-CoV-2 PCR. Generalized estimating equations analysis. Each symbol represents 1 patient. *P < 0.05.
Figure 8
Figure 8. Summary of identified alterations in subsets of immune cells according to status, severity, outcome, and mortality.
Red upward arrows indicate increased frequencies, green downward arrows decreased frequencies, and yellow bidirectional arrows similar frequencies of immune cells in the blood of SARS-CoV-2+ versus SARS-CoV-2 patients in severe versus mild/moderate, in unfavorable versus good outcome, and in deceased patients versus survivors.

Similar articles

Cited by

References

    1. Guan WJ, et al. Clinical characteristics of coronavirus disease 2019 in China. N Engl J Med. 2020;382(18):1708–1720. doi: 10.1056/NEJMoa2002032. - DOI - PMC - PubMed
    1. Richardson S, et al. Presenting characteristics, comorbidities, and outcomes among 5700 patients hospitalized with COVID-19 in the New York City area. JAMA. 2020;323(20):2052–2059. doi: 10.1001/jama.2020.6775. - DOI - PMC - PubMed
    1. Petrilli CM, et al. Factors associated with hospital admission and critical illness among 5279 people with coronavirus disease 2019 in New York City: prospective cohort study. BMJ. 2020;369:m1966. - PMC - PubMed
    1. Williamson EJ, et al. Factors associated with COVID-19-related death using OpenSAFELY. Nature. 2020;584(7821):430–436. doi: 10.1038/s41586-020-2521-4. - DOI - PMC - PubMed
    1. Onder G, et al. Case-fatality rate and characteristics of patients dying in relation to COVID-19 in Italy. JAMA. 2020;323(18):1775–1776. - PubMed

Publication types

MeSH terms