. 2021 Feb 26;17(2):e1009405.
doi: 10.1371/journal.pgen.1009405. eCollection 2021 Feb.

Power analysis of transcriptome-wide association study: Implications for practical protocol choice

Affiliations

Power analysis of transcriptome-wide association study: Implications for practical protocol choice

Chen Cao et al. PLoS Genet. .

Abstract

The transcriptome-wide association study (TWAS) has emerged as one of several promising techniques for integrating multi-scale 'omics' data into traditional genome-wide association studies (GWAS). Unlike GWAS, which associates phenotypic variance directly with genetic variants, TWAS uses a reference dataset to train a predictive model for gene expressions, which allows it to associate phenotype with variants through the mediating effect of expressions. Although effective, this core innovation of TWAS is poorly understood, since the predictive accuracy of the genotype-expression model is generally low and further bounded by expression heritability. This raises the question: to what degree does the accuracy of the expression model affect the power of TWAS? Furthermore, would replacing predictions with actual, experimentally determined expressions improve power? To answer these questions, we compared the power of GWAS, TWAS, and a hypothetical protocol utilizing real expression data. We derived non-centrality parameters (NCPs) for linear mixed models (LMMs) to enable closed-form calculations of statistical power that do not rely on specific protocol implementations. We examined two representative scenarios: causality (genotype contributes to phenotype through expression) and pleiotropy (genotype contributes directly to both phenotype and expression), and also tested the effects of various properties including expression heritability. Our analysis reveals two main outcomes: (1) Under pleiotropy, the use of predicted expressions in TWAS is superior to actual expressions. This explains why TWAS can function with weak expression models, and shows that TWAS remains relevant even when real expressions are available. (2) GWAS outperforms TWAS when expression heritability is below a threshold of 0.04 under causality, or 0.06 under pleiotropy. Analysis of existing publications suggests that TWAS has been misapplied in place of GWAS, in situations where expression heritability is low.


Conflict of interest statement

The authors have declared that no competing interests exist.

Figures

Fig 1
Fig 1
Causality (A) and Pleiotropy (B) scenarios for genotype (X), expression (Z) and phenotype (Y).
Fig 2
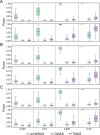
Fig 2. Causality scenario when expression heritability is high and PVX is low.
The PVX is 0.005, 0.01, 0.025, and 0.05 in the four columns as indicated by the X-axis labels. The number of genes contributing to phenotype for (A), (B) and (C) are 4, 9, and 13 respectively. The expression heritability for the top and bottom rows of (A), (B) and (C) are 0.1 and 0.3 respectively. The number of causal variants per gene is randomly sampled from the interval [4,9].
Fig 3
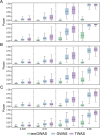
Fig 3. Causality scenario when expression heritability is low and PVX is high.
The PVX is 0.05 and 0.1 in the two columns as indicated by the X-axis labels. The numbers of genes contributing to phenotype in the left, middle and right panels are 4, 9, and 13 respectively. The expression heritability levels in (A), (B), (C) and (D) are 0.025, 0.03, 0.04, and 0.08 respectively. The number of causal variants per gene is randomly sampled from the interval [4,9].
Fig 4
Fig 4. Pleiotropy scenario when expression heritability is high and trait heritability is low.
The trait heritability is 0.005, 0.01, 0.025, and 0.05 in the four columns as indicated by the X-axis labels. The numbers of genes contributing to phenotype for (A), (B) and (C) are 4, 9, and 13 respectively. The expression heritability for the top and bottom rows of (A), (B) and (C) are 0.1 and 0.3 respectively. The number of causal variants per gene is randomly sampled from the interval [4,9].
Fig 5
Fig 5. Pleiotropy scenario when expression heritability is low and trait heritability is high.
The PVX is 0.05 and 0.1 in the two columns as indicated by the X-axis labels. The numbers of genes contributing to phenotype for the left, middle and right panels are 4, 9, and 13 respectively. The expression heritability levels in (A), (B), (C) and (D) are 0.025, 0.04, 0.06, and 0.08 respectively. The number of causal variants per gene is randomly sampled from the interval [4,9].

References

    1. Trapnell C, Williams BA, Pertea G, Mortazavi A, Kwan G, van Baren MJ, et al.. Transcript assembly and quantification by RNA-Seq reveals unannotated transcripts and isoform switching during cell differentiation. Nat Biotechnol. 2010;28(5):511–5. Epub 2010/05/04. 10.1038/nbt.1621 - DOI - PMC - PubMed
    1. Wang Z, Gerstein M, Snyder M. RNA-Seq: a revolutionary tool for transcriptomics. Nat Rev Genet. 2009;10(1):57–63. Epub 2008/11/19. 10.1038/nrg2484 - DOI - PMC - PubMed
    1. McGettigan PA. Transcriptomics in the RNA-seq era. Curr Opin Chem Biol. 2013;17(1):4–11. Epub 2013/01/08. 10.1016/j.cbpa.2012.12.008 . - DOI - PubMed
    1. Ozsolak F, Milos PM. RNA sequencing: advances, challenges and opportunities. Nat Rev Genet. 2011;12(2):87–98. Epub 2010/12/31. 10.1038/nrg2934 - DOI - PMC - PubMed
    1. Selevsek N, Chang CY, Gillet LC, Navarro P, Bernhardt OM, Reiter L, et al.. Reproducible and consistent quantification of the Saccharomyces cerevisiae proteome by SWATH-mass spectrometry. Mol Cell Proteomics. 2015;14(3):739–49. Epub 2015/01/07. 10.1074/mcp.M113.035550 - DOI - PMC - PubMed

Publication types

LinkOut - more resources