. 2021 Feb 26;17(2):e1008638.
doi: 10.1371/journal.pcbi.1008638. eCollection 2021 Feb.

Ancestral haplotype reconstruction in endogamous populations using identity-by-descent

Affiliations

Ancestral haplotype reconstruction in endogamous populations using identity-by-descent

Kelly Finke et al. PLoS Comput Biol. .

Abstract

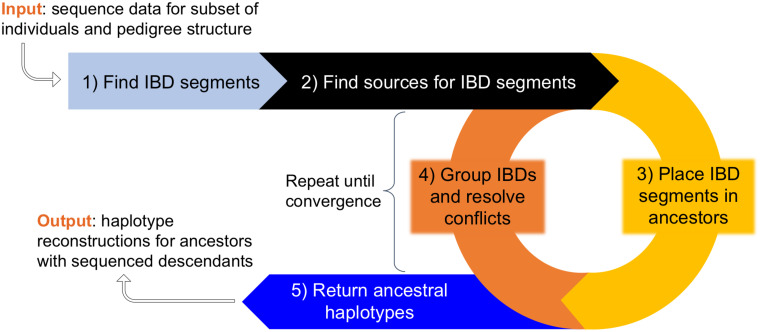
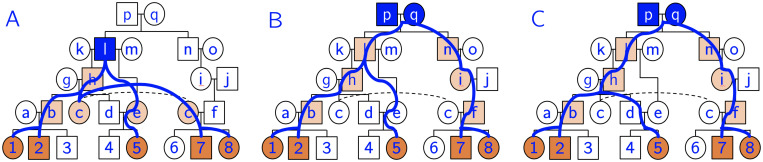
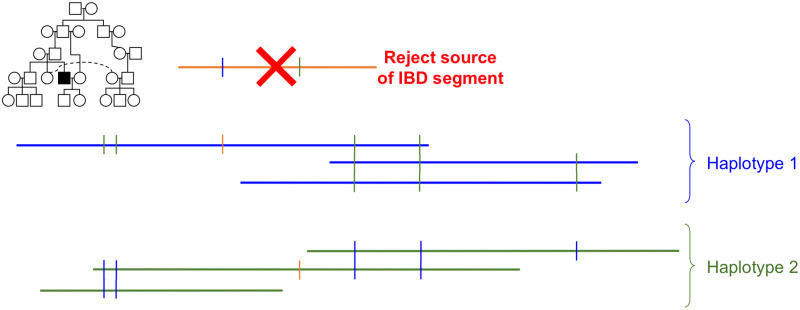
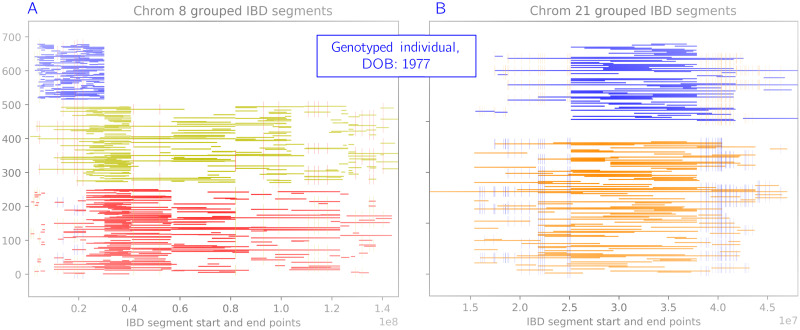
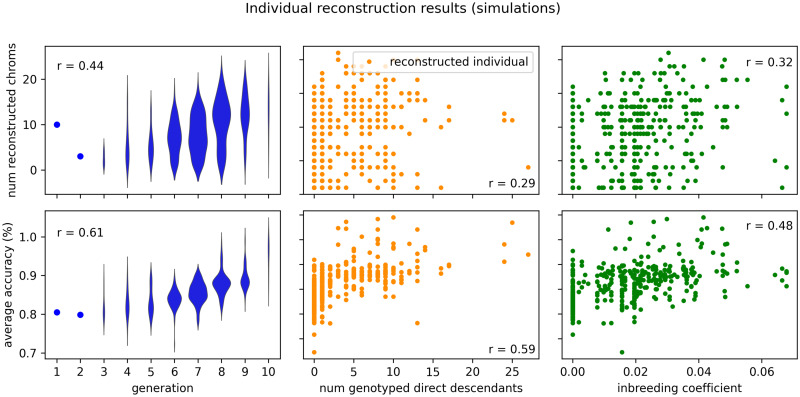
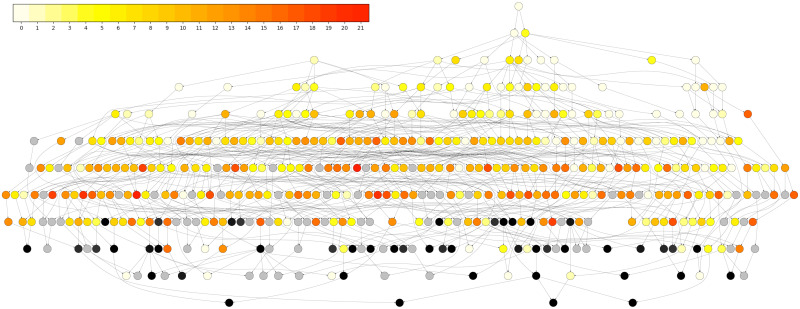
In this work we develop a novel algorithm for reconstructing the genomes of ancestral individuals, given genotype or sequence data from contemporary individuals and an extended pedigree of family relationships. A pedigree with complete genomes for every individual enables the study of allele frequency dynamics and haplotype diversity across generations, including deviations from neutrality such as transmission distortion. When studying heritable diseases, ancestral haplotypes can be used to augment genome-wide association studies and track disease inheritance patterns. The building blocks of our reconstruction algorithm are segments of Identity-By-Descent (IBD) shared between two or more genotyped individuals. The method alternates between identifying a source for each IBD segment and assembling IBD segments placed within each ancestral individual. Unlike previous approaches, our method is able to accommodate complex pedigree structures with hundreds of individuals genotyped at millions of SNPs. We apply our method to an Old Order Amish pedigree from Lancaster, Pennsylvania, whose founders came to North America from Europe during the early 18th century. The pedigree includes 1338 individuals from the past 12 generations, 394 with genotype data. The motivation for reconstruction is to understand the genetic basis of diseases segregating in the family through tracking haplotype transmission over time. Using our algorithm thread, we are able to reconstruct an average of 224 ancestral individuals per chromosome. For these ancestral individuals, on average we reconstruct 79% of their haplotypes. We also identify a region on chromosome 16 that is difficult to reconstruct-we find that this region harbors a short Amish-specific copy number variation and the gene HYDIN. thread was developed for endogamous populations, but can be applied to any extensive pedigree with the recent generations genotyped. We anticipate that this type of practical ancestral reconstruction will become more common and necessary to understand rare and complex heritable diseases in extended families.


Conflict of interest statement

The authors have declared that no competing interests exist.

Figures

Fig 1
Fig 1. Problem statement illustration.
Squares represent males and circles represent females. Horizontal lines create couples and show sibling relationships. Parents and offspring are connected by vertical lines. Filled in symbols represent individuals who have been genotyped. Our aim is to reconstruct all ungenotyped individuals (orange question marks) who have genotyped descendants.
Fig 2
Fig 2. Algorithm overview.
In the first two steps we identify IBD segments and compile a list of potential sources for each one. In the iterative phase, we alternate between choosing sources for each IBD and grouping the IBDs that are placed within each individual. If the IBDs assigned to an individual can be arranged into two haplotypes meeting thresholds for coverage defined in Methods, then those haplotypes are considered strong. IBD segments that conflict with strong haplotypes are rejected and must be assigned a different source. When we are no longer building more haplotypes, we return the reconstructed chromosomes.
Fig 3
Fig 3. Genetic similarity vs. kinship.
For each pair of genotyped individuals, we compute their genetic similarity (counting genotyped SNPs only) and plot this on the y-axis against their kinship coefficient on the x-axis. The expected linear trend is apparent, with an average sequence similarity of 72.5%. The minimum similarity out of all pairs was 70.5%, and the maximum was 99.999% (twins).
Fig 4
Fig 4. Source-finding illustration.
(A) Let individuals 1–8 be the genotyped individuals of this pedigree. Let C = {1, 2, 5, 7, 8} (orange individuals) be the cohort sharing IBD segment I. Note that this pedigree contains two loops, since c and f share recent ancestors p and q, and d and e share recent ancestor . The multiset Mp for each ancestral individual p is shown below the node name. Mp is formed by concatenating the multisets of p’s children, and it represents the number of paths from ancestor p to each member of the cohort. (B) After trimming redundant ancestors and merging couples, we obtain a set of putative sources for the IBD segment. In this case, we have three potential sources: S = {gh, , pq}. We begin the iterative phase by selecting the source with the fewest descendance paths, which in this case is gh (starred). We place the IBD segment in individuals that are on all paths from gh to the cohort. In this case we would add the IBD segment to individuals b, c, and d (light orange).
Fig 5
Fig 5. Example descendance paths.
Given a cohort of five individuals sharing an IBD segment (orange), we often obtain multiple sources (blue nodes) and multiple descendance paths (blue lines) from each source. In this example we have 11 total paths from three sources. After we choose a source, we assign the IBD segment to ancestors along all descendance paths (light orange). (A) One path from source . (B)-(C) Two different descendance paths from the same source pq. We would not assign the IBD to d and e since they are not on all paths from this source.
Fig 6
Fig 6. Grouping algorithm illustration.
Each horizontal line represents one IBD segment that we placed within a specific individual (highlighted in the pedigree inset). Each vertical line indicates a difference (heterozygous site) between groups. In this case, the orange IBD segment conflicts with both the blue and green groups, so we would reject its source and attempt to find a new one in the next iteration.
Fig 7
Fig 7. Example of the grouping algorithm on a genotyped individual.
Each horizontal line represents one IBD segment shared with a cohort of other genotyped individuals. IBD segments of the same color represent haplotypes, and have a consistent sequence along the chromosome. Small vertical lines represent heterozygous sites between the two haplotypes. (A) Chrom 8: very occasionally we merge groups incorrectly and obtain three groups. (B) Chrom 21: we almost always see two clear haplotypes (here we also see a large stretch of homozygosity).
Fig 8
Fig 8. Individual results: Simulated data.
The same results as Table 3, but shown on the individual level. The top set of figures shows reconstruction completeness as measured by the number of reconstructed chromosomes. The bottom set of figures shows reconstruction accuracy as measured by sequence identity averaged over the reconstructed chromosomes. These two metrics are plotted against three statistics about each individual: the generation number (lower is more ancient), the number of genotyped direct descendants (children and grandchildren), and the inbreeding coefficient as calculated by PedHunter using the entire AGDB comprised of more than 500,000 individuals. Correlation coefficients are shown for each relationship.
Fig 9
Fig 9. Varying population size and source-finding approach: Simulated data.
The top panel shows the average reconstruction accuracy of chromosome 21 as a function of pre-migration population size. The bottom panel shows the number of reconstructed individuals for the corresponding scenarios. The greedy source-identification algorithm is denoted “min path” and the probabilistic algorithm is denoted “max prob”. There is a clear tradeoff between accuracy and the number of individuals reconstructed.
Fig 10
Fig 10. IBD length distribution.
Left: IBD length distribution for the real data for chromosome 21. Right: IBD length distribution for the simulated data for chromosome 21. x-axis units are 10Mbp.
Fig 11
Fig 11. Conflict resolution example.
The blue and green groups are removed, since they are less strong than the cyan and red groups. In the next iteration, we retain only strong groups and consider the individual reconstructed. Newly sourced IBDs after this point may not conflict with these reconstructed haplotypes.
Fig 12
Fig 12. Successful ancestral reconstructions.
Ancestral reconstructions of ungenotyped individuals, from a variety of chromosomes and generations (back in time). As we go back in time, we generally have fewer IBD segments to group.
Fig 13
Fig 13. Nuclear family graph.
Each node represents a nuclear family (parents and children). When a child of one family becomes the parent of another, we draw an edge. Black nodes have at least 80% of the family genotyped. Gray nodes have at least 80% of the family without genotyped descendants. Yellow (fewer)—Red (more) colors represent the average number of chromosomes reconstructed for the individuals in the family.

Similar articles

Cited by

References

    1. Campbell CD, Chong JX, Malig M, Ko A, Dumont BL, Han L, et al.. Estimating the human mutation rate using autozygosity in a founder population. Nature Genetics. 2012;44(11):1277–1281. 10.1038/ng.2418 - DOI - PMC - PubMed
    1. Sun JX, Helgason A, Masson G, Ebenesersdóttir SS, Li H, Mallick S, et al.. A direct characterization of human mutation based on microsatellites. Nature Genetics. 2012;44(10):1161–1165. 10.1038/ng.2398 - DOI - PMC - PubMed
    1. Broman KW, Murray JC, Sheffield VC, White RL, Weber JL. Comprehensive human genetic maps: individual and sex-specific variation in recombination. American Journal of Human Genetics. 1998;63(3):861–869. 10.1086/302011 - DOI - PMC - PubMed
    1. Kong A, Gudbjartsson DF, Sainz J, Jonsdottir GM, Gudjonsson SA, Richardsson B, et al.. A high-resolution recombination map of the human genome. Nature Genetics. 2002;31(3):241–247. 10.1038/ng917 - DOI - PubMed
    1. Keightley PD, Ness RW, Halligan DL, Haddrill PR. Estimation of the spontaneous mutation rate per nucleotide site in a Drosophila melanogaster full-sib family. Genetics. 2014;196(1):313–320. 10.1534/genetics.113.158758 - DOI - PMC - PubMed

Publication types