. 2021 Feb 26;17(2):e1008731.
doi: 10.1371/journal.pcbi.1008731. eCollection 2021 Feb.

Evidence for spreading seizure as a cause of theta-alpha activity electrographic pattern in stereo-EEG seizure recordings

Affiliations

Evidence for spreading seizure as a cause of theta-alpha activity electrographic pattern in stereo-EEG seizure recordings

Viktor Sip et al. PLoS Comput Biol. .

Abstract

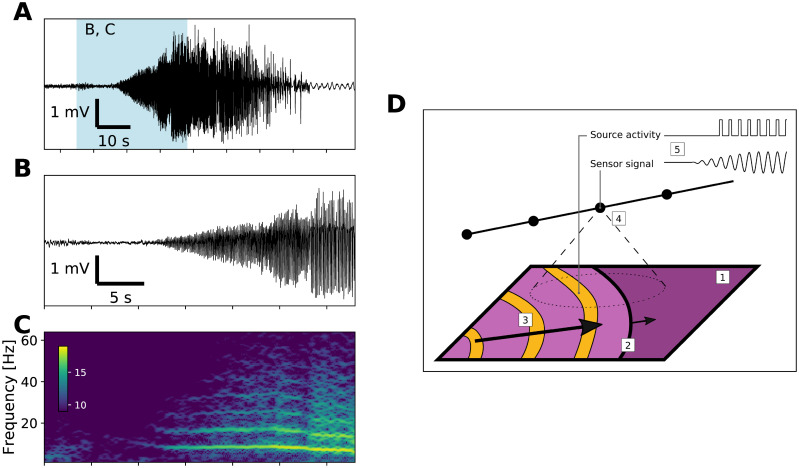
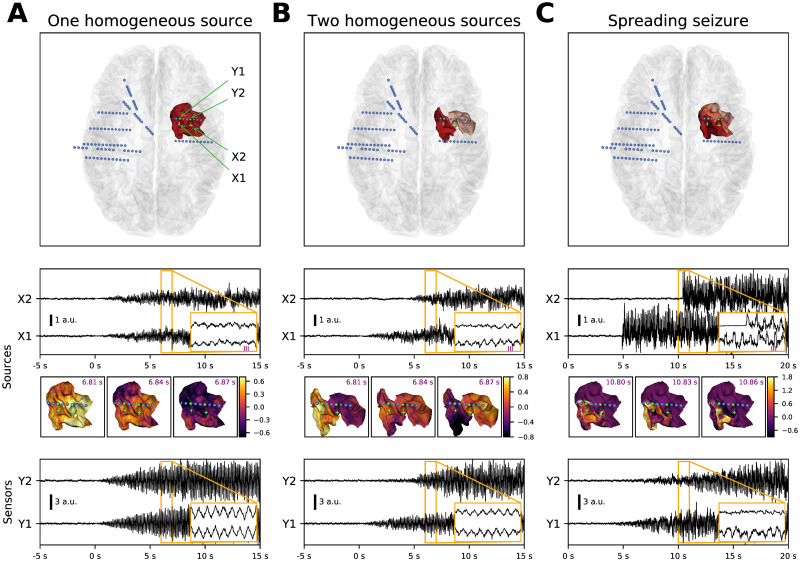
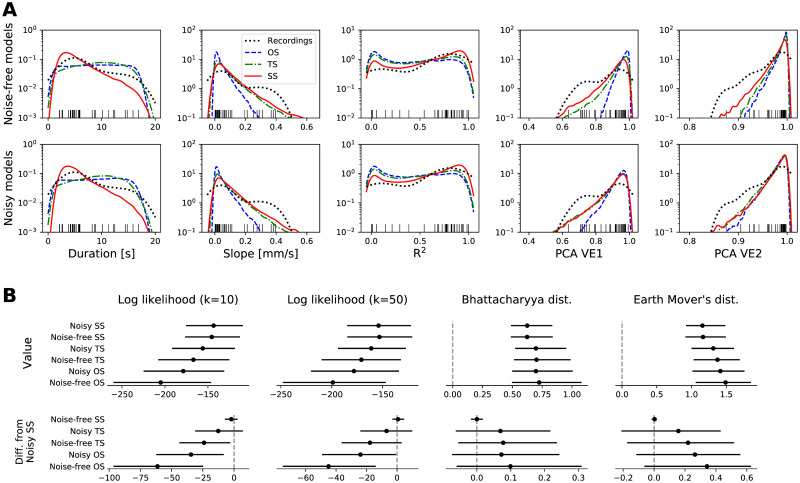
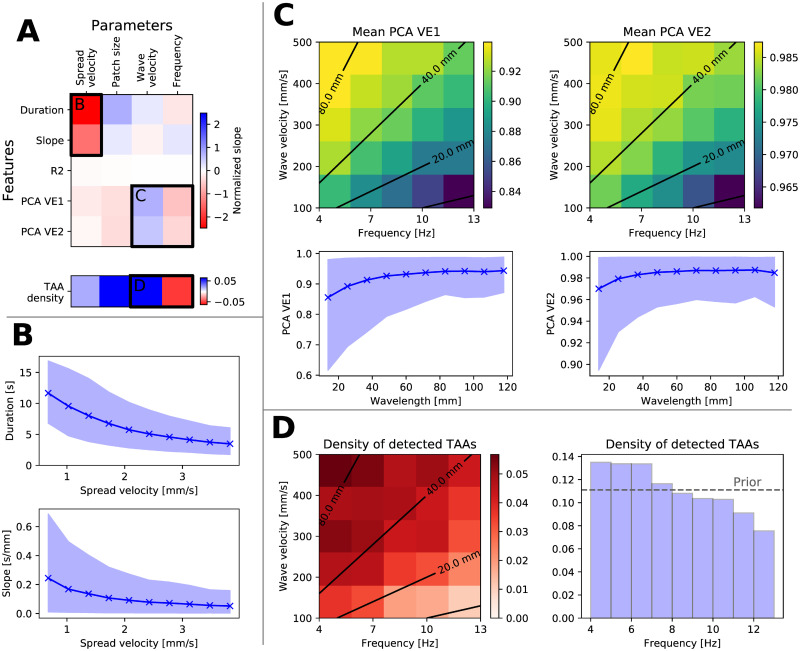
Intracranial electroencephalography is a standard tool in clinical evaluation of patients with focal epilepsy. Various early electrographic seizure patterns differing in frequency, amplitude, and waveform of the oscillations are observed. The pattern most common in the areas of seizure propagation is the so-called theta-alpha activity (TAA), whose defining features are oscillations in the θ - α range and gradually increasing amplitude. A deeper understanding of the mechanism underlying the generation of the TAA pattern is however lacking. In this work we evaluate the hypothesis that the TAA patterns are caused by seizures spreading across the cortex. To do so, we perform simulations of seizure dynamics on detailed patient-derived cortical surfaces using the spreading seizure model as well as reference models with one or two homogeneous sources. We then detect the occurrences of the TAA patterns both in the simulated stereo-electroencephalographic signals and in the signals of recorded epileptic seizures from a cohort of fifty patients, and we compare the features of the groups of detected TAA patterns to assess the plausibility of the different models. Our results show that spreading seizure hypothesis is qualitatively consistent with the evidence available in the seizure recordings, and it can explain the features of the detected TAA groups best among the examined models.


Conflict of interest statement

The authors have declared that no competing interests exist.

Figures

Fig 1
Fig 1. Example of the TAA pattern and the hypothesized mechanism.
(A) Recording of a seizure from a contact of an implanted depth electrode in monopolar representation. Blue background marks the limits of the details in panels B and C. (B) Detail of the TAA pattern at the seizure onset. (C) Time-frequency representation of the signal in panel B (log transformed). The signal is dominated by oscillations around 8 Hz and its higher harmonics. (D) Hypothesized mechanism of the emergence of TAA pattern. During a seizure, cortical sheet (1) is gradually recruited into seizure activity via slowly progressing seizure wavefront (2). Inside the recruited area the abnormal activity is organized by fast traveling waves (3). Implanted sensors record the local field potential generated by nearby located cortical tissue (4), and through this spatial averaging, the rapid onset at the source level is transformed into gradual onset on the sensor level (5).
Fig 2
Fig 2. Models of the seizure activity.
Each column presents an example of a simulated seizure with the different models in the noisy variation. From top to bottom, the panels show the position of the seizure patch and the implanted electrodes, source activity in two points on the patch, snapshots of the source activity (at time points marked in the inset above), and simulated sensor activity on two contacts located close to the seizure patch. (A) One homogeneous source model posits that the seizure activity is generated by one contiguous cortical patch, where any point follows the same dynamics (apart from the stochastic noise) with gradually increasing oscillations. (B) In the two homogeneous sources model, there are two patches recruited with a delay. On each patch any point follows the same dynamics with gradual onset as in the one source model. (C) In the spreading seizure model, the seizure activity start at a single point located on the cortical patch, and the seizure then slowly spreads until the whole patch is recruited (recruitment time is represented by the patch color in top panel). In every cortical unit represented by a vertex of the triangulation the seizure activity starts instantly with no transition period (second panel). Despite this rapid onset on the source level, the onset of the seizure activity at the sensor level is gradual (bottom panel). This is due to the spatial averaging effect of the measured local field potential, which transforms the slow spatial spread of the seizure into gradual onset in a sensor signal. The lowermost panel shows that all models produce SEEG signal resembling the TAA pattern.
Fig 3
Fig 3. Detection of TAAs and extracting the features of a TAA group.
(A) For each channel, we calculate the normalized log-power in the θα band and determine the period of growth (in blue) from the baseline to full seizure activity. We then test if the growth is roughly close to linear (R2 > 0.75). If so, we check whether the largest peak of the normalized spectral density lies in the θα band and whether all other peaks are its harmonics. (B) When the TAA pattern is detected on four or more consecutive contacts on a single electrode, three features are extracted: the slope and coefficient of determination of the TAA onsets (in red) and average duration of the TAA patterns (in blue). The figure shows an example on five contacts of the electrode TB’ implanted in the left temporo-basal cortex. (C) In the TAA interval, the principal component analysis of the SEEG signals is done to extract two more features: the variance explained by the first one and first two components.
Fig 4
Fig 4
(A) Classification of the contacts based on the recorded/simulated activity. Seizure activity was detected on around 25% of contacts in the recordings and around 10% in the simulations. The TAA pattern was detected on a subset of these seizing contact, and contacts that belong to a TAA group formed even smaller subset. (B) Location of the contacts in the brain. In the spreading seizure model, the TAA patterns are distributed homogeneously in the brain, following the implantation (first column). In the recordings, the TAA patterns occur dominantly in the temporal lobe. (C) Delays of the TAA pattern onset relative to the clinically marked seizure onset in the recordings. Majority of the TAAs appear between eight to twenty second after the seizure onset. (D) Frequencies of the oscillations in the TAA patterns detected in the patient recordings.
Fig 5
Fig 5
(A) Features of the detected TAA groups in the recordings and simulations. Each panel shows the density of one of the five features of the TAA group (see Fig 3) obtained from the samples via kernel density estimation for noise-free (top row) and noisy (bottom row) simulations. Each black tick at the bottom edge corresponds to a TAA group in the recordings; these ticks match the density marked by the black dotted line, and are the same in both rows. (B) Quantification of the fit of the models to the empirical data. The four columns show the median and the confidence intervals at 95% level of four measures of a goodness-of-fit: k-nearest-neighbor estimation of log-likelihood (with k = 10 and k = 50; higher is better) and Bhattacharyya and Earth Mover’s distances (lower is better). Upper panels show the values itself, lower panels show the difference to the noisy spreading seizure model. To calculate the Bhattacharyya and Earth Mover’s distances, the samples were binned into 1024 uniform bins (each dimension divided into four bins) with limits indicated by the outermost ticks on x-axes in panel A. The confidence intervals are obtained by bootstrapping, that is repeatedly calculating given measure with a random resample with replacement from the original 32-element sample of detected TAA instances. Number of resamples was 1000, except for the Earth Mover’s distance where only 100 was used due to the computational demands. Abbreviation of the model names: OS—One homogeneous source, TS—Two homogeneous sources, SS—Spreading seizure.
Fig 6
Fig 6. Effects of the model parameters on the features of detected TAAs in the spreading seizure model in the noisy variant.
(A) Upper plot shows the slope of linear regression sp,f between all parameters and features, normalized by the parameter range width wp and standard deviation σf of the feature sp,f wp/σf. Lower plot shows the normalized change in parameter mean for detected TAAs and the prior distribution, (μpTAAμpprior)/wp, indicating shift of the parameter density to higher/lower values. More saturated blue (red) elements indicate stronger positive (negative) relation. Labeled regions are analyzed in other panels. (B) Relation between the spread velocity and duration of the TAAs and slope of the TAA spread. Solid line and points represent the mean of the features, the shaded area is the 10-90 percentile range. (C) Relation between the frequency and wave velocity and variance explained by the first one and first two components. In the upper plots, black contours indicate the wavelength = wave velocity / frequency. The relation between the features and the wavelength is shown in the lower panels. (D) Relation between the frequency and wave velocity and the density of detected TAAs. The number of detected TAAs decreases with shorter wavelength (left panel) as well as with the frequency alone (right panel).

Similar articles

Cited by

References

    1. Bartolomei F, Lagarde S, Wendling F, McGonigal A, Jirsa V, Guye M, et al.. Defining epileptogenic networks: Contribution of SEEG and signal analysis. Epilepsia. 2017;58(7):1131–1147. 10.1111/epi.13791 - DOI - PubMed
    1. Parvizi J, Kastner S. Promises and limitations of human intracranial electroencephalography. Nature Neuroscience. 2018;21(4):474–483. 10.1038/s41593-018-0108-2 - DOI - PMC - PubMed
    1. Alarcon G, Binnie CD, Elwes RDC, Polkey CE. Power spectrum and intracranial EEG patterns at seizure onset in partial epilepsy. Electroencephalography and Clinical Neurophysiology. 1995;94(5):326–337. 10.1016/0013-4694(94)00286-T - DOI - PubMed
    1. Schiller Y, Cascino GD, Busacker NE, Sharbrough FW. Characterization and Comparison of Local Onset and Remote Propagated Electrographic Seizures Recorded with Intracranial Electrodes. Epilepsia. 1998;39(4):380–388. 10.1111/j.1528-1157.1998.tb01390.x - DOI - PubMed
    1. Doležalová I, Brázdil M, Hermanová M, Horáková I, Rektor I, Kuba R. Intracranial EEG seizure onset patterns in unilateral temporal lobe epilepsy and their relationship to other variables. Clinical Neurophysiology. 2013;124(6):1079–1088. 10.1016/j.clinph.2012.12.046 - DOI - PubMed

Publication types