. 2021 Feb 26;17(2):e1009373.
doi: 10.1371/journal.pgen.1009373. eCollection 2021 Feb.

Detection of hard and soft selective sweeps from Drosophila melanogaster population genomic data

Affiliations

Detection of hard and soft selective sweeps from Drosophila melanogaster population genomic data

Nandita R Garud et al. PLoS Genet. .

Abstract

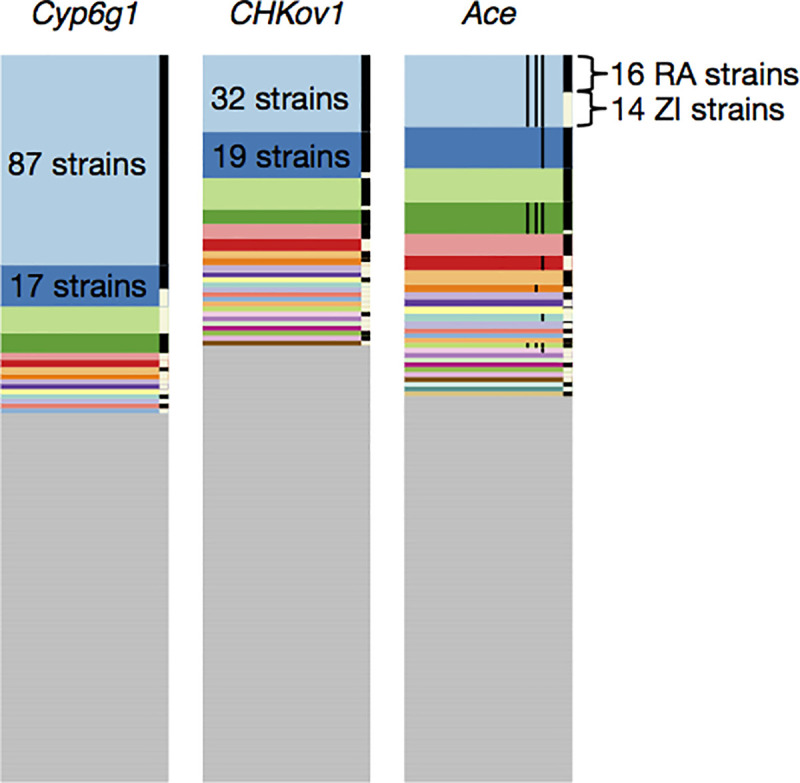
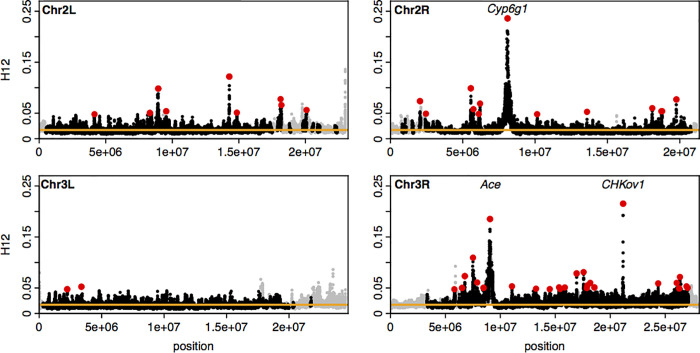
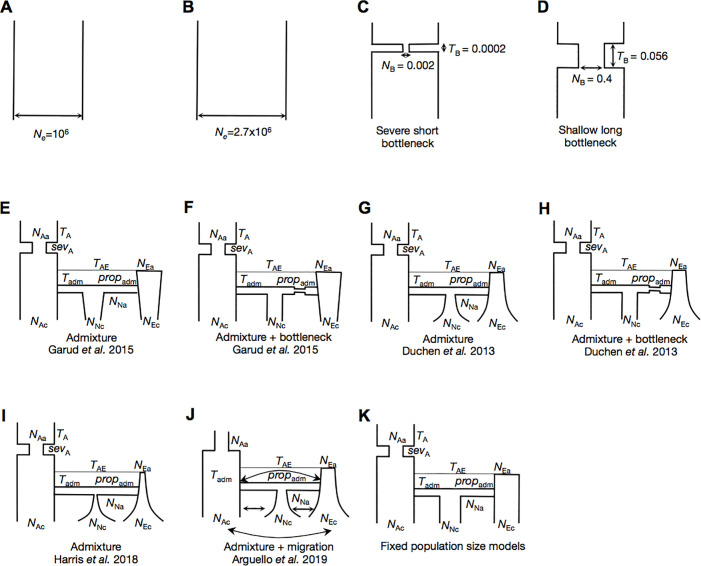
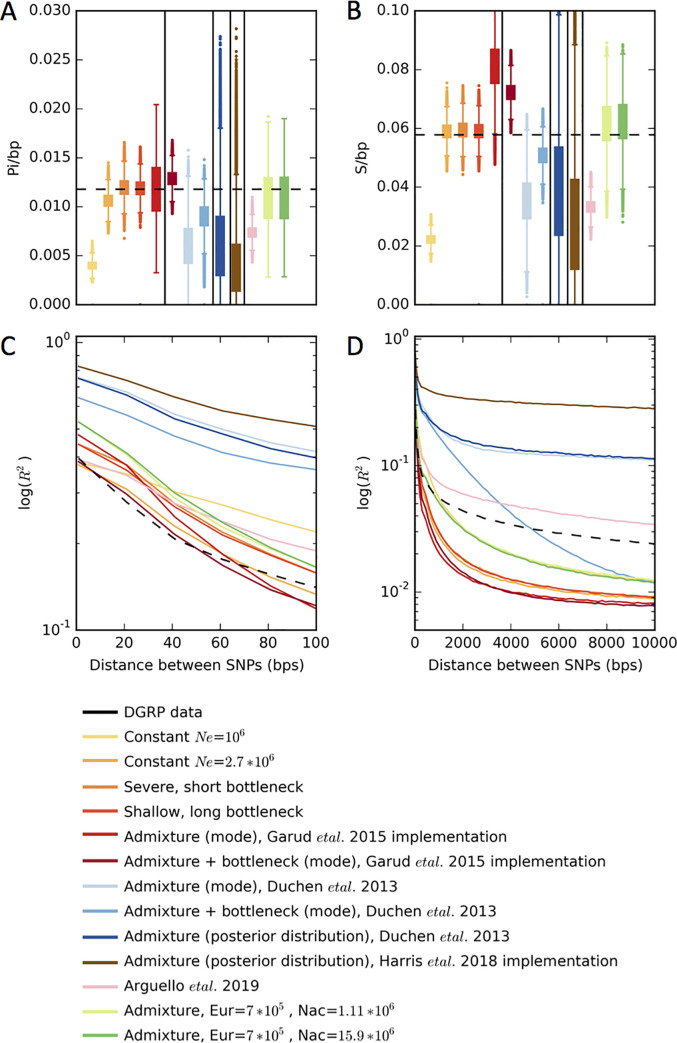
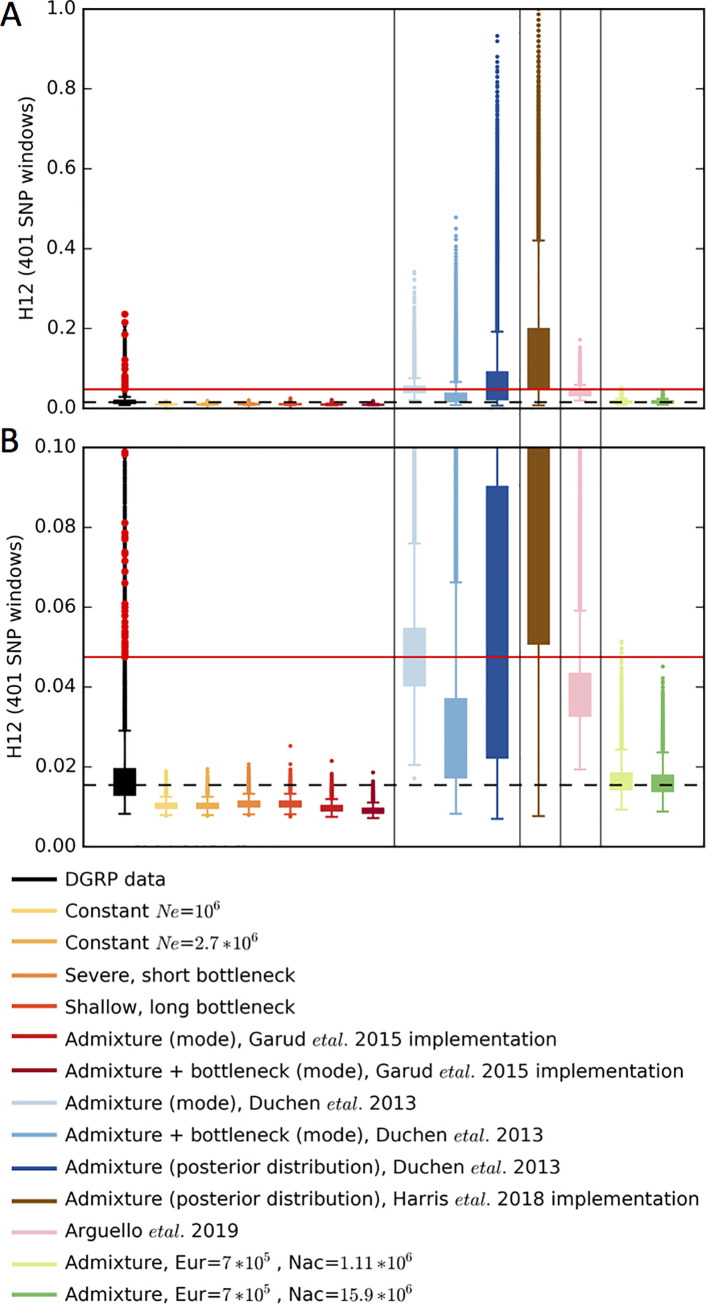
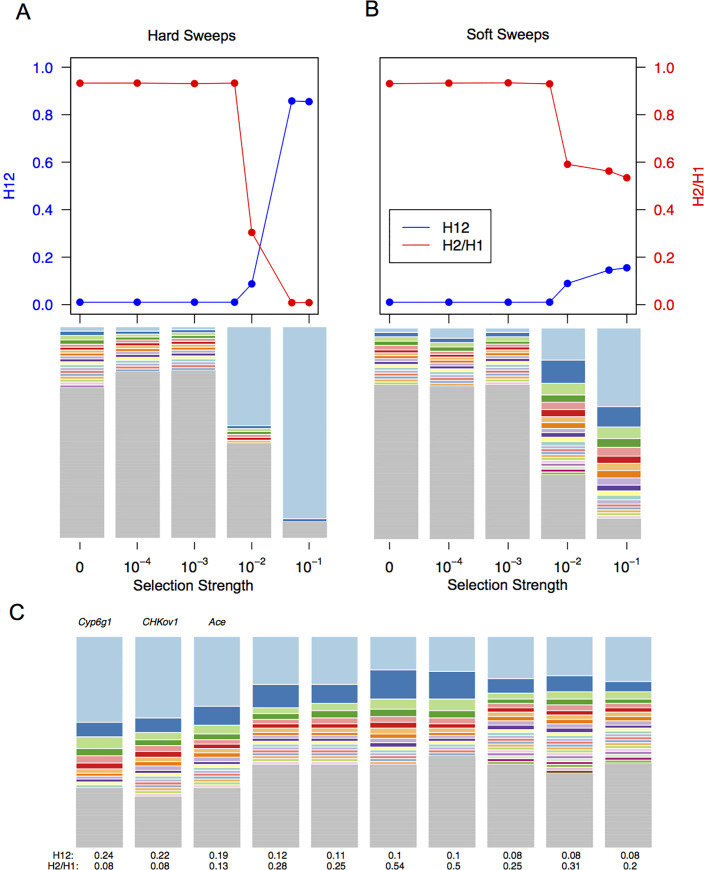
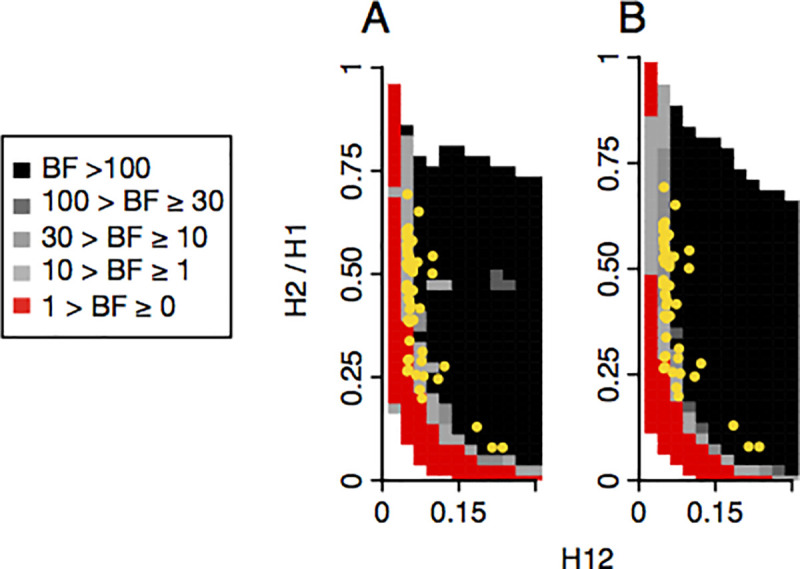
Whether hard sweeps or soft sweeps dominate adaptation has been a matter of much debate. Recently, we developed haplotype homozygosity statistics that (i) can detect both hard and soft sweeps with similar power and (ii) can classify the detected sweeps as hard or soft. The application of our method to population genomic data from a natural population of Drosophila melanogaster (DGRP) allowed us to rediscover three known cases of adaptation at the loci Ace, Cyp6g1, and CHKov1 known to be driven by soft sweeps, and detected additional candidate loci for recent and strong sweeps. Surprisingly, all of the top 50 candidates showed patterns much more consistent with soft rather than hard sweeps. Recently, Harris et al. 2018 criticized this work, suggesting that all the candidate loci detected by our haplotype statistics, including the positive controls, are unlikely to be sweeps at all and that instead these haplotype patterns can be more easily explained by complex neutral demographic models. They also claim that these neutral non-sweeps are likely to be hard instead of soft sweeps. Here, we reanalyze the DGRP data using a range of complex admixture demographic models and reconfirm our original published results suggesting that the majority of recent and strong sweeps in D. melanogaster are first likely to be true sweeps, and second, that they do appear to be soft. Furthermore, we discuss ways to take this work forward given that most demographic models employed in such analyses are necessarily too simple to capture the full demographic complexity, while more realistic models are unlikely to be inferred correctly because they require a large number of free parameters.


Conflict of interest statement

The authors have declared that no competing interests exist.

Figures

Fig 1
Fig 1. Haplotype frequency spectra at the Cyp6g1, CHKov1, and Ace loci.
Recreated from Garud and Petrov 2016 [17]. Haplotype frequency spectra at the three positive controls in a joint dataset, comprised of 300 Raleigh (RA) and Zambian (ZI) strains in 801 SNP windows, centered around the sites of the selective sweeps. 801 SNP windows in the joint data set correspond to slightly smaller analysis window sizes (<10 kb) in terms of base pairs on average than in the Raleigh or Zambian data alone. Each color bar represents a different, unique haplotype, and the height of the bar represents the number of chromosomes sharing the haplotype. The grey bars represent unique, singleton haplotypes in the sample. On the right side of each of the frequency spectra are black and white bars, indicating which strains are from RA and ZI, respectively. At all three positive controls, common haplotypes are shared across the two populations. The thin vertical black lines shown in the haplotype spectrum for Ace correspond to the presence of three adaptive mutations that confer pesticide resistance.
Fig 2
Fig 2. H12 scan of DGRP data.
Recreated from Garud et al. 2015 [34]. Scan of the four autosomes using the H12 statistic. Each point indicates an H12 value computed in a 401 SNP window. Grey points indicate regions excluded from the analysis with recombination rates lower than 5x10^-7 cM/bp. The orange line represents the 1-per-genome FDR line calculated from simulations of a neutral model with constant population size of 10^6. Red points indicate the top 50 extreme outlier peaks relative to the 1-per-genome FDR line. Three positive controls are indicated at Ace, Cyp6g1, and CHKov1.
Fig 3
Fig 3. Neutral demographic models.
Diversity statistics were measured in simulations of 11 neutral demographic models: (A) A constant Ne = 106 model (B) A constant Ne = 2.7x10⁶ model (fit to Watterson’s θW measured in autosomal short introns in DGRP data) (C) A severe short bottleneck model fit to Pi and S in autosomal short introns in DGRP data (D) A shallow long bottleneck model fit to Pi and S in autosomal short introns in DGRP data (E) The implemented admixture model in Garud et al. 2015 (F) The implemented admixture + bottleneck model in Garud et al. 2015 (G) The admixture model proposed by Duchen et al. 2013 (H) The admixture + bottleneck model proposed by Duchen et al. 2013 (I) The implemented admixture model in Harris et al. 2018 (J) The admixture model proposed by Arguello et al. 2019 (K) A variant of the Duchen et al. 2013 admixture model where North America, Europe, and Africa have fixed population sizes.
Fig 4
Fig 4. Distributions of Pi, S, and linkage disequilibrium in data and simulations.
Distributions of (A) Pi/bp, (B) S/bp, (C) short range LD (R2), and (D) long range LD measured in DGRP data and simulated neutral demographic models. In Figures A and B, models belonging to the following categories are delineated with a vertical line: models implemented in Garud et al., models implemented in Duchen et al, model specified by Harris et al., the model proposed by Arguello et al, and finally, models proposed in this paper. Simulations were generated with a recombination rate ρ = 5×10⁻⁷ cM/bp. Diversity statistics were calculated in DGRP data in genomic regions with ρ ≥ 5×10⁻⁷ cM/bp. The horizontal dashed lines in (A) and (B) depict the median Pi/bp, S/bp, and H12 values measured in DGRP data. For each model, statistics from 1.3x10⁵ simulations are plotted in (A) and (B). The dashed black lines in (C) and (D) correspond to mean LD values computed in DGRP data. LD in simulations was estimated from 1x10⁷ pairs of SNPs. Histograms and quantile-quantile plots of the full distributions of Pi/bp and S/bp are shown in S3–S14 Figs.
Fig 5
Fig 5. H12 distributions in data and simulations.
Distributions of H12 in 401 SNP windows. Shown are the (A) full distribution and (B) truncated y-axis for visual clarity. Simulations were generated with a recombination rate ρ = 5×10⁻⁷ cM/bp and H12 was calculated in DGRP data in genomic regions with ρ ≥ 5×10⁻⁷ cM/bp. The horizontal dashed line indicates the median H12 value in DGRP data and the horizontal red line indicates the lowest H12 value for the top 50 peaks. H12 values from 1.3x10⁵ simulations for each model are plotted. The distribution of genome-wide H12 values measured in DGRP data is shown in black. Overlaid in red points are the H12 values corresponding to the top 50 empirical outliers in the DGRP scan. Histograms and quantile-quantile plots of the full distributions of H12 in data and simulations are shown in S15–S21 Figs.
Fig 6
Fig 6. Signatures of hard and soft sweeps in simulations and DGRP data.
(A) Top panel: H12 and H2/H1 values associated with hard sweeps simulated with varying selection strengths in a constant Ne = 2.7*10^6 model. Each point represents the mean H12 or H2/H1 value for 2000 forward simulations in which selection began 0.0001*Ne generations ago. Bottom panel: haplotype frequency spectra for a random simulation for a given selection scenario. (B) same as (A) except for soft sweeps. (C) Haplotype frequency spectra for the top 10 peaks in DGRP data. The analysis window with the highest H12 value for each peak is plotted.
Fig 7
Fig 7. Range of H12 and H2/H1 values expected for hard and soft sweeps under two admixture models.
Bayes factors (BFs) were calculated for a grid of H12 and H2/H1 values to demonstrate the range of H12 and H2/H1 values expected under hard versus soft sweeps. Panels A and B show results for variations of the admixture model proposed by Duchen et al. 2013, where Africa, North America, and Europe have constant population sizes. In (A), the population sizes for North America and Europe were held constant at 1,110,000 and 700,000 individuals, respectively. In (B), the population sizes for North America and Europe were held fixed at 15,984,500 and 700,000 individuals, respectively. BFs were calculated by computing the ratio of the number of soft sweep versus hard sweep simulations that were within a Euclidean distance of 10% of a given pair of H12 and H2/H1 values. Red portions of the grid represent H12 and H2/H1 values that are more easily generated by hard sweeps, while grey portions represent regions of space more easily generated under soft sweeps. Each panel presents the results from 105 hard and soft sweep simulations, respectively. Hard sweeps were generated with θA = 0.01 and soft sweeps were generated with θA = 10. A recombination rate of ρ = 5×10⁻⁷ cM/bp was used for all simulations. The H12 and H2/H1 values for the top 50 empirical outliers in the DGRP scan are overlaid in yellow.

References

    1. Andolfatto P, Przeworski M. A Genome-Wide Departure From the Standard Neutral Model in Natural Populations of Drosophila. Genetics. 2000;156(1):257–68. - PMC - PubMed
    1. Fay JC, Wu CI. Hitchhiking under positive Darwinian selection. Genetics [Internet]. 2000;155(3):1405–13. Available from: http://www.ncbi.nlm.nih.gov/pubmed/10880498. - PMC - PubMed
    1. Smith NG, Eyre-Walker A. Adaptive protein evolution in Drosophila. Nature [Internet]. 2002;415(6875):1022–4. Available from: http://www.ncbi.nlm.nih.gov/pubmed/11875568. 10.1038/4151022a - DOI - PubMed
    1. Bierne N, Eyre-Walker A. The genomic rate of adaptive amino acid substitution in Drosophila. Mol Biol Evol [Internet]. 2004;21(7):1350–60. Available from: http://www.ncbi.nlm.nih.gov/pubmed/15044594. 10.1093/molbev/msh134 - DOI - PubMed
    1. Andolfatto P. Adaptive evolution of non-coding DNA in Drosophila. Nature [Internet]. 2005;437(7062):1149–52. Available from: http://www.ncbi.nlm.nih.gov/pubmed/16237443. 10.1038/nature04107 - DOI - PubMed