. 2021 Feb 26;17(2):e1009346.
doi: 10.1371/journal.ppat.1009346. eCollection 2021 Feb.

Epigenomic characterization of latent HIV infection identifies latency regulating transcription factors

Affiliations

Epigenomic characterization of latent HIV infection identifies latency regulating transcription factors

Stuart R Jefferys et al. PLoS Pathog. .

Abstract

Transcriptional silencing of HIV in CD4 T cells generates a reservoir of latently infected cells that can reseed infection after interruption of therapy. As such, these cells represent the principal barrier to curing HIV infection, but little is known about their characteristics. To further our understanding of the molecular mechanisms of latency, we characterized a primary cell model of HIV latency in which infected cells adopt heterogeneous transcriptional fates. In this model, we observed that latency is a stable, heritable state that is transmitted through cell division. Using Assay of Transposon-Accessible Chromatin sequencing (ATACseq) we found that latently infected cells exhibit greatly reduced proviral accessibility, indicating the presence of chromatin-based structural barriers to viral gene expression. By quantifying the activity of host cell transcription factors, we observe elevated activity of Forkhead and Kruppel-like factor transcription factors (TFs), and reduced activity of AP-1, RUNX and GATA TFs in latently infected cells. Interestingly, latency reversing agents with different mechanisms of action caused distinct patterns of chromatin reopening across the provirus. We observe that binding sites for the chromatin insulator CTCF are highly enriched in the differentially open chromatin of infected CD4 T cells. Furthermore, depletion of CTCF inhibited HIV latency, identifying this factor as playing a key role in the initiation or enforcement of latency. These data indicate that HIV latency develops preferentially in cells with a distinct pattern of TF activity that promotes a closed proviral structure and inhibits viral gene expression. Furthermore, these findings identify CTCF as a novel regulator of HIV latency.


Conflict of interest statement

The authors have declared that no competing interests exist.

Figures
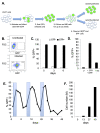
Fig 1
Fig 1. HIV infected CD4 T cells enter a stable, heritable state of viral latency in vitro.
A. Schematic overview of primary CD4 T cell HIV latency model. B. Flow cytometry plot showing a representative gating of actively infected (GFP+) and latently infected (GFP-) cells. C. GFP+ and GFP- cells were flow sorted from the HIV-GFP infected population and cultured for 6 days post sorting. Viral gene expression was measured at days 0, 3, and 6 post sorting, and the percentage of cells in the GFP+ gate was measured. Each bar represents the average of three independent replicates. D. Sorted infected GFP- cells at 12wpi were reactivated using αCD3/CD28 beads. At 24h, unstimulated cells (U) and stimulated cells (+αCD3/CD28) were analyzed by flow cytometry and the percentage of GFP+ cells analyzed. The reactivated cells were then removed from the activating beads and cultured for an additional 14 days (+14d), then analyzed again by flow cytometry. E. Sorted GFP- cells from an infected population were serially stimulated through their TCR (+αCD3/CD28) and GFP expression was monitored over time by flow cytometry. Shaded areas indicate times during which αCD3/CD28 beads were added to the culture to stimulate the cells. Each datapoint represents the average of two independent replicates. F. Cell numbers were counted at selected timepoints during the serial stimulation shown in E and total cell numbers are shown in millions of cells (M).
Fig 2
Fig 2. Latently infected cells are epigenomically distinct from actively infected cells.
HIV-GFP infected cells at 12 wpi were flow sorted into GFP- and GFP+ populations and analyzed by ATACseq. A. Alignment of the reads to the human genome demonstrates enrichment of reads near transcriptional start sites (TSS). B. Size distribution of library fragment sizes showing nucleosomal laddering. C. Differentially accessible regions of the cellular genome were identified and fold change versus false discovery rate (FDR) displayed as a volcano plot. Peaks that are significantly (FDR <0.1) more open in GFP+ cells (“up”) are indicated in red, while peaks that are significantly more open in latently infected cells (“down”) are indicated in blue. The data represents an aggregate of infected cells from two independent donors.
Fig 3
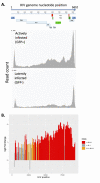
Fig 3. The HIV provirus has reduced accessibility in latently infected cells.
A. HIV-GFP infected cells at 12wpi were flow sorted into GFP- and GFP+ populations and analyzed by ATACseq. ATACseq reads from the cells were aligned to an HIV reference genome to examine accessibility of the provirus. The intensity of read coverage was graphed across the HIV genome for GFP+ (upper panel) and GFP- (lower panel) cells. Graph shows an aggregate analysis of two donors. B. The change in accessibility across the HIV genome during active infection vs latency is shown by determining the fold change between GFP- and GFP+ cells within 73bp bins tiled across HIV. Positive fold change indicates greater accessibility in GFP+ cells. The false discovery rate (FDR) for each 73bp bin is illustrated by the color of each bar: red = <0.01, orange = 0.1 to 0.01, grey = >0.1.
Fig 4
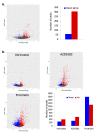
Fig 4. LRAs promote re-opening of the HIV provirus.
HIV-GFP infected CD4 cells at 12wpi were stimulated with three different latency reversing agents–vorinostat (250nM), AZD5582 (250nM), prostratin (250nM) or DMSO (0.1%) vehicle for 24hrs A. GFP expression in the culture was analyzed by flow cytometry and the percent GFP+ was plotted. B. Stimulated cells were then analyzed by ATACseq. Reads were aligned to the HIV genome and the fold change of reads mapping to HIV in each of the LRA-stimulated conditions are shown. VOR = vorinostat, PROST = prostratin. C. The read coverage across the HIV genome for the four conditions (DMSO control and the LRA conditions) are shown. D. Fold change in accessibility after LRA stimulation is shown by examination of 73bp bins across the genome (Left panels). Individual bars are color coded by the false discover rate (FDR): red = <0.01, orange = 0.1 to 0.01, grey = >0.1. The total number of differentially accessible 73bp bins across the genome in each FDR category are shown in the right panel. Data represent an aggregate of four independent replicate experiments.
Fig 5
Fig 5. LRAs induce changes to chromatin accessibility in infected cells.
ATACseq reads from HIV-GFP infected cells at 12wpi that had been stimulated with vorinostat (250nM), AZD5582 (250nM), prostratin (250nM) or DMSO vehicle for 24hrs were aligned to the human genome. Differentially accessible regions were identified, and fold changes vs FDR plotted as a volcano plot. Data represent an aggregate analysis of four independent replicate experiments. Fold changes versus FDR are displayed as a volcano plot. Peaks that are significantly (FDR < 0.1) more open after LRA stimulation are indicated in red (“up”), while peaks that are significantly more closed are indicated in blue (“down”).
Fig 6
Fig 6. Differential opening of CTCF sites in latency vs active infection, and during latency reversal.
A. Differentially accessible regions of the cellular genome containing consensus CTCF binding sites were identified by comparison of actively infected (GFP+) and latently infected (GFP-) cells, and fold changes versus FDR values are displayed as a volcano plot. Red datapoints indicate regions that are more accessible in actively infected (GFP+) cells (“up”), while blue datapoints represent regions that are more open in latently infected (GFP-) cells (“down”). B. Host cell chromatin peaks containing CTCF binding sites are displayed for the three LRA drug treatment conditions. Peaks with significantly different accessibility (FDR <0.1) after stimulation of HIV infected cells are highlighted in red (upregulated by LRA) and blue (downregulated by LRA). The data represents an aggregate of infected cells from four independent replicate experiments.
Fig 7
Fig 7. CTCF depletion in latently infected CD4 T cells inhibits HIV latency.
N6 cells were transduced with lentiviruses that express mCherry and an shRNA targeting CTCF or a control scrambled shRNA. A. Transduced N6 cells were analyzed by western blot to examine CTCF expression as well as a loading control (β-Actin). B. Transduced N6 cells were analyzed at 2 weeks post infection by flow cytometry, and the percentage GFP+ cells within the mCherry+ gate determined. Data represent the average of two technical replicates from one of two representative experiments. C. A representative FACS plot of HSA expression in shRNA transduced N6 cells. D. Primary CD4 T cells at 2 days post activation were infected with HIV-GFP, then nucleofected with Cas9 complexed with a control sgRNA, a Tat sgRNA or a CTCF sgRNA. E. At one week post infection, the impact on CTCF mRNA levels, relative to beta-actin was quantified by Taqman qPCR. CTCF expression is displayed in arbitrary units and represents the average of four replicates. F. The infected/nucleofected cells were analyzed for GFP expression over four weeks of infection and the percent of latently infected (GFP-) cells was determined. Each datapoint is the average of two independent nucleofection reactions. Asterisks represent significant differences (P<0.05, Student’s T test).
Fig 8
Fig 8. Schematic model of transcription factor activity and HIV latency.
HIV-GFP infected cells exhibit variegated levels of transcriptional silencing. Comparison of actively infected (green) and latently infected (white) CD4 T cells reveals latency associated TF activity. Latently infected cells have elevated Forkhead (FOX) and Kruppel-like factor (KLF) TF activity, and reduced AP-1, RUNX and GATA TF activity relative to actively infected cells. The chromatin insulator CTCF promotes HIV latency.

Similar articles

Cited by

References

    1. Yoshimura K. Current status of HIV/AIDS in the ART era. J Infect Chemother Off J Jpn Soc Chemother. 2017;23: 12–16. 10.1016/j.jiac.2016.10.002 - DOI - PubMed
    1. Lederman MM, Calabrese L, Funderburg NT, Clagett B, Medvik K, Bonilla H, et al.. Immunologic Failure Despite Suppressive Antiretroviral Therapy Is Related to Activation and Turnover of Memory CD4 Cells. J Infect Dis. 2011;204: 1217–1226. 10.1093/infdis/jir507 - DOI - PMC - PubMed
    1. Lederman MM, Funderburg NT, Sekaly RP, Klatt NR, Hunt PW. Residual Immune Dysregulation Syndrome in Treated HIV infection. Adv Immunol. 2013;119: 51–83. 10.1016/B978-0-12-407707-2.00002-3 - DOI - PMC - PubMed
    1. Lichtfuss GF, Hoy J, Rajasuriar R, Kramski M, Crowe SM, Lewin SR. Biomarkers of immune dysfunction following combination antiretroviral therapy for HIV infection. Biomark Med. 2011;5: 171–186. 10.2217/bmm.11.15 - DOI - PubMed
    1. Serrano-Villar S, Sainz T, Lee SA, Hunt PW, Sinclair E, Shacklett BL, et al.. HIV-Infected Individuals with Low CD4/CD8 Ratio despite Effective Antiretroviral Therapy Exhibit Altered T Cell Subsets, Heightened CD8+ T Cell Activation, and Increased Risk of Non-AIDS Morbidity and Mortality. PLoS Pathog. 2014;10. 10.1371/journal.ppat.1004078 - DOI - PMC - PubMed

Publication types