Meta-Analysis
. 2021 Mar 4;108(3):482-501.
doi: 10.1016/j.ajhg.2021.02.008. Epub 2021 Feb 25.

Mendelian pathway analysis of laboratory traits reveals distinct roles for ciliary subcompartments in common disease pathogenesis

Affiliations
Meta-Analysis

Mendelian pathway analysis of laboratory traits reveals distinct roles for ciliary subcompartments in common disease pathogenesis

Theodore George Drivas et al. Am J Hum Genet. .

Abstract

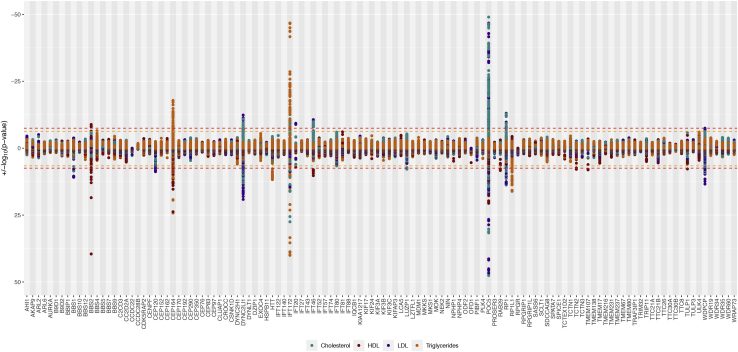
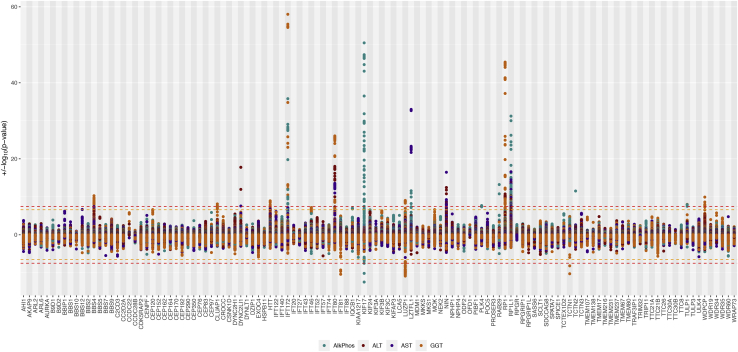
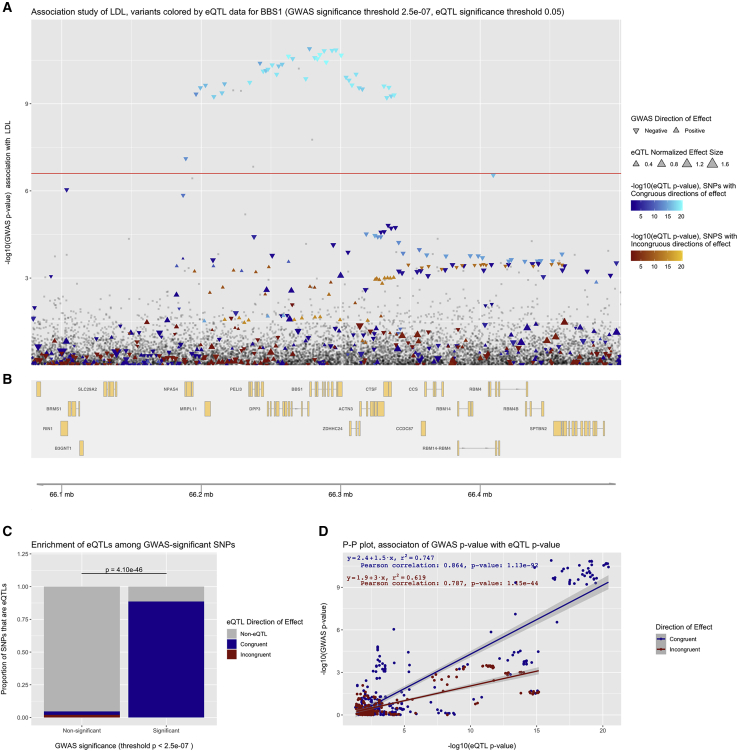
Rare monogenic disorders of the primary cilium, termed ciliopathies, are characterized by extreme presentations of otherwise common diseases, such as diabetes, hepatic fibrosis, and kidney failure. However, despite a recent revolution in our understanding of the cilium's role in rare disease pathogenesis, the organelle's contribution to common disease remains largely unknown. Hypothesizing that common genetic variants within Mendelian ciliopathy genes might contribute to common complex diseases pathogenesis, we performed association studies of 16,874 common genetic variants across 122 ciliary genes with 12 quantitative laboratory traits characteristic of ciliopathy syndromes in 452,593 individuals in the UK Biobank. We incorporated tissue-specific gene expression analysis, expression quantitative trait loci, and Mendelian disease phenotype information into our analysis and replicated our findings in meta-analysis. 101 statistically significant associations were identified across 42 of the 122 examined ciliary genes (including eight novel replicating associations). These ciliary genes were widely expressed in tissues relevant to the phenotypes being studied, and eQTL analysis revealed strong evidence for correlation between ciliary gene expression levels and laboratory traits. Perhaps most interestingly, our analysis identified different ciliary subcompartments as being specifically associated with distinct sets of phenotypes. Taken together, our data demonstrate the utility of a Mendelian pathway-based approach to genomic association studies, challenge the widely held belief that the cilium is an organelle important mainly in development and in rare syndromic disease pathogenesis, and provide a framework for the continued integration of common and rare disease genetics to provide insight into the pathophysiology of human diseases of immense public health burden.

Keywords: Mendelian disease; bioinformatics; ciliopathies; cilium; complex trait; genomics.


Conflict of interest statement

M.D.R. is on the Scientific Advisory Board for Cipherome and for Goldfinch Bio. X.Z. is currently employed by Regeneron Pharmaceuticals, but all work for this manuscript was completed prior to her beginning in this position. The authors declare no additional competing interests.

Figures

Figure 1
Figure 1
Schematic of analysis workflow for the data presented Phenotype and genotype data from the UKBB release version 2 was extracted and processed as indicated. Linear association studies between ciliary gene variants and laboratory traits were performed, and significant associations (p < 2.5e−7) were studied further by tissue-specific expression, eQTL, and replication meta-analysis. Using this data, we performed a DiCE/pathway analysis to identify ciliary subcompartments associated with specific traits.
Figure 2
Figure 2
Association study and meta-analysis results for lipid-related traits Hudson plot illustrating the results of the multi-ancestry discovery association analysis (top) and replication meta-analysis (bottom) of common variants within 122 ciliary genes with lipid-related traits. Data for cholesterol are in teal, HDL are in red, LDL are in purple, and triglycerides are in orange. The study-wise Bonferroni-adjusted significance threshold for all analyses performed in our manuscript (p < 3.4e−8) is shown as a red dashed line, while the experiment-wise Bonferroni-adjusted significance threshold (p < 2.5e−7 for the discovery analysis, p < 5e−7 for the meta-analysis) is shown as an orange dashed line. Each analyzed gene is given equal space along the horizontal axis, and all tested genetic variants for a given gene are plotted at the midline of the gene block.
Figure 3
Figure 3
Association study and meta-analysis results for kidney-related traits Hudson plot illustrating the results of the multi-ancestry discovery association analysis (top) and replication meta-analysis (bottom) of common variants within 122 ciliary genes with kidney-related traits. Data for creatinine are in teal, and data for urea are in red. The study-wise Bonferroni-adjusted significance threshold for all analyses performed in our manuscript (p < 3.4e−8) is shown as a red dashed line, while the experiment-wise Bonferroni-adjusted significance threshold (p < 2.5e−7 for the discovery analysis, p < 5e−7 for the meta-analysis) is shown as an orange dashed line. Each analyzed gene is given equal space along the horizontal axis, and all tested genetic variants for a given gene are plotted at the midline of the gene block.
Figure 4
Figure 4
Association study and meta-analysis results for liver-related traits Hudson plot illustrating the results of the multi-ancestry discovery association analysis (top) and replication meta-analysis (bottom) of common variants within 122 ciliary genes with liver-related traits. Data for AlkPhos are in teal, ALT are in red, AST are in purple, and GGT are in orange. The study-wise Bonferroni-adjusted significance threshold for all analyses performed in our manuscript (p < 3.4e−8) is shown as a red dashed line, while the experiment-wise Bonferroni-adjusted significance threshold (p < 2.5e−7 for the discovery analysis, p < 3.2e−7 for the meta-analysis) is shown as an orange dashed line. Each analyzed gene is given equal space along the horizontal axis, and all tested genetic variants for a given gene are plotted at the midline of the gene block.
Figure 5
Figure 5
Association study and meta-analysis results for glucose-related traits Hudson plot illustrating the results of the multi-ancestry discovery association analysis (top) and replication meta-analysis (bottom) of common variants within 122 ciliary genes with glucose-related traits. Data for A1c are in teal, and data for glucose are in red. The study-wise Bonferroni-adjusted significance threshold for all analyses performed in our manuscript (p < 3.4e−8) is shown as a red dashed line, while the experiment-wise Bonferroni-adjusted significance threshold (p < 2.5e−7 for the discovery analysis, p < 5e−7 for the meta-analysis) is shown as an orange dashed line. Each analyzed gene is given equal space along the horizontal axis, and all tested genetic variants for a given gene are plotted at the midline of the gene block.
Figure 6
Figure 6
Tissue-specific expression analysis of ciliary genes Heatmap depicting the results of the tissue-specific expression analysis for each of the 42 ciliary genes with significant associations in our discovery analysis. The phenotype domain(s) significantly associated with each gene are indicated by the colored bars at the top of the graph. Tissues are listed to the left of the graph, hierarchically clustered by expression profile across all 42 genes, as displayed by the dendrogram on the right. Blue color scale corresponds to the transcripts per million (TPM) for each gene, per tissue, as obtained from the GTEx v8 database, and any TPM value less than 1.5 is displayed in black. Pink color scale corresponds to the standard deviation in expression for each gene across all tissues.
Figure 7
Figure 7
BBS1 variants significantly associated with LDL levels also serve as eQTLs for the BBS1 gene eQTpLot analysis of the BBS1 locus association with LDL levels. (A) Colocalization between phenotype-significant variants and eQTLs for BBS1 is visualized in chromosomal space. For each variant, significance of association with LDL levels is displayed along the vertical axis, and significance of association with BBS1 expression is indicated by color gradient. Any variant with peQTL for BBS1 <0.05 is displayed in color. The genome-wide p value significance threshold of 2.5e−7 for LDL association is indicated by a red line. Note that the variants most significantly associated with LDL levels are also most significantly associated with BBS1 expression. (B) A depiction of the genomic region surrounding the BBS1 locus. (C) Visualization of enrichment of eQTLs for the BBS1 gene among variants significantly associated with LDL. The p value of enrichment was determined by Fisher’s exact test. (D) P-P plot illustrating correlation between peQTL and ptrait for BBS1. Correlation between the two probabilities is visualized by plotting a best-fit linear regression over the points with the line equation displayed on the plot. The Pearson correlation coefficient and p value of correlation are displayed on the plot as well.
Figure 8
Figure 8
Schematics illustrating the results of DiCE/pathway analysis and a depiction of the primary cilium (A) To integrate the multiple lines of evidence supporting each ciliary gene’s association with a given phenotype domain, we employed a Diverse Convergent Evidence (DiCE) analysis approach estimating the strength of available corroborating data (detailed in Table S16). The DiCE scores for each gene, illustrating the strength of evidence supporting each ciliary gene’s association with a given phenotype domain, are displayed here; the magnitude of the score is indicated by the size of each gene bubble. For each phenotype domain, gene bubbles are displayed at the same location for ease of comparison. Genes are colored by ciliary subcompartment—green for IFT-related genes, pink for the BBSome, orange for the transition zone, and gray for the basal body. A stacked bar graph is also displayed for each phenotype domain, illustrating the summed DiCE scores for all genes, by ciliary subcompartment, as a proportion of the total DiCE score per phenotype domain. (B) A schematic of the primary cilium. The basal body and centrioles are displayed in gray, the ciliary transition zone in orange, the IFT machinery in green, and the BBSome in pink. The core of nine microtubule doublets and the overlying membrane of the organelle are shown, and receptors being trafficked into/along the cilium are shown in blue.

Similar articles

  • Characterizing the morbid genome of ciliopathies.
    Shaheen R, Szymanska K, Basu B, Patel N, Ewida N, Faqeih E, Al Hashem A, Derar N, Alsharif H, Aldahmesh MA, Alazami AM, Hashem M, Ibrahim N, Abdulwahab FM, Sonbul R, Alkuraya H, Alnemer M, Al Tala S, Al-Husain M, Morsy H, Seidahmed MZ, Meriki N, Al-Owain M, AlShahwan S, Tabarki B, Salih MA; Ciliopathy WorkingGroup; Faquih T, El-Kalioby M, Ueffing M, Boldt K, Logan CV, Parry DA, Al Tassan N, Monies D, Megarbane A, Abouelhoda M, Halees A, Johnson CA, Alkuraya FS. Shaheen R, et al. Genome Biol. 2016 Nov 28;17(1):242. doi: 10.1186/s13059-016-1099-5. Genome Biol. 2016. PMID: 27894351 Free PMC article.
  • Molecular genetics of renal ciliopathies.
    Barroso-Gil M, Olinger E, Sayer JA. Barroso-Gil M, et al. Biochem Soc Trans. 2021 Jun 30;49(3):1205-1220. doi: 10.1042/BST20200791. Biochem Soc Trans. 2021. PMID: 33960378 Review.
  • Insights into Ciliary Genes and Evolution from Multi-Level Phylogenetic Profiling.
    Nevers Y, Prasad MK, Poidevin L, Chennen K, Allot A, Kress A, Ripp R, Thompson JD, Dollfus H, Poch O, Lecompte O. Nevers Y, et al. Mol Biol Evol. 2017 Aug 1;34(8):2016-2034. doi: 10.1093/molbev/msx146. Mol Biol Evol. 2017. PMID: 28460059 Free PMC article.
  • The Joubert-Meckel-Nephronophthisis Spectrum of Ciliopathies.
    Van De Weghe JC, Gomez A, Doherty D. Van De Weghe JC, et al. Annu Rev Genomics Hum Genet. 2022 Aug 31;23:301-329. doi: 10.1146/annurev-genom-121321-093528. Epub 2022 Jun 2. Annu Rev Genomics Hum Genet. 2022. PMID: 35655331 Free PMC article. Review.
  • Mutations in ARMC9, which Encodes a Basal Body Protein, Cause Joubert Syndrome in Humans and Ciliopathy Phenotypes in Zebrafish.
    Van De Weghe JC, Rusterholz TDS, Latour B, Grout ME, Aldinger KA, Shaheen R, Dempsey JC, Maddirevula S, Cheng YH, Phelps IG, Gesemann M, Goel H, Birk OS, Alanzi T, Rawashdeh R, Khan AO; University of Washington Center for Mendelian Genomics; Bamshad MJ, Nickerson DA, Neuhauss SCF, Dobyns WB, Alkuraya FS, Roepman R, Bachmann-Gagescu R, Doherty D. Van De Weghe JC, et al. Am J Hum Genet. 2017 Jul 6;101(1):23-36. doi: 10.1016/j.ajhg.2017.05.010. Epub 2017 Jun 15. Am J Hum Genet. 2017. PMID: 28625504 Free PMC article.

Cited by

References

    1. Satir P., Pedersen L.B., Christensen S.T. The primary cilium at a glance. J. Cell Sci. 2010;123:499–503. - PMC - PubMed
    1. Anvarian Z., Mykytyn K., Mukhopadhyay S., Pedersen L.B., Christensen S.T. Cellular signalling by primary cilia in development, organ function and disease. Nat. Rev. Nephrol. 2019;15:199–219. - PMC - PubMed
    1. Liu B., Chen S., Cheng D., Jing W., Helms J.A. Primary cilia integrate hedgehog and Wnt signaling during tooth development. J. Dent. Res. 2014;93:475–482. - PMC - PubMed
    1. Wei Q., Zhang Y., Li Y., Zhang Q., Ling K., Hu J. The BBSome controls IFT assembly and turnaround in cilia. Nat. Cell Biol. 2012;14:950–957. - PMC - PubMed
    1. Wingfield J.L., Lechtreck K.-F., Lorentzen E. Trafficking of ciliary membrane proteins by the intraflagellar transport/BBSome machinery. Essays Biochem. 2018;62:753–763. - PMC - PubMed

Publication types