

Trends in the incidence of diagnosed diabetes: a multicountry analysis of aggregate data from 22 million diagnoses in high-income and middle-income settings
- PMID: 33636102
- PMCID: PMC10984526
- DOI: 10.1016/S2213-8587(20)30402-2
Trends in the incidence of diagnosed diabetes: a multicountry analysis of aggregate data from 22 million diagnoses in high-income and middle-income settings
Abstract
Background: Diabetes prevalence is increasing in most places in the world, but prevalence is affected by both risk of developing diabetes and survival of those with diabetes. Diabetes incidence is a better metric to understand the trends in population risk of diabetes. Using a multicountry analysis, we aimed to ascertain whether the incidence of clinically diagnosed diabetes has changed over time.
Methods: In this multicountry data analysis, we assembled aggregated data describing trends in diagnosed total or type 2 diabetes incidence from 24 population-based data sources in 21 countries or jurisdictions. Data were from administrative sources, health insurance records, registries, and a health survey. We modelled incidence rates with Poisson regression, using age and calendar time (1995-2018) as variables, describing the effects with restricted cubic splines with six knots for age and calendar time.
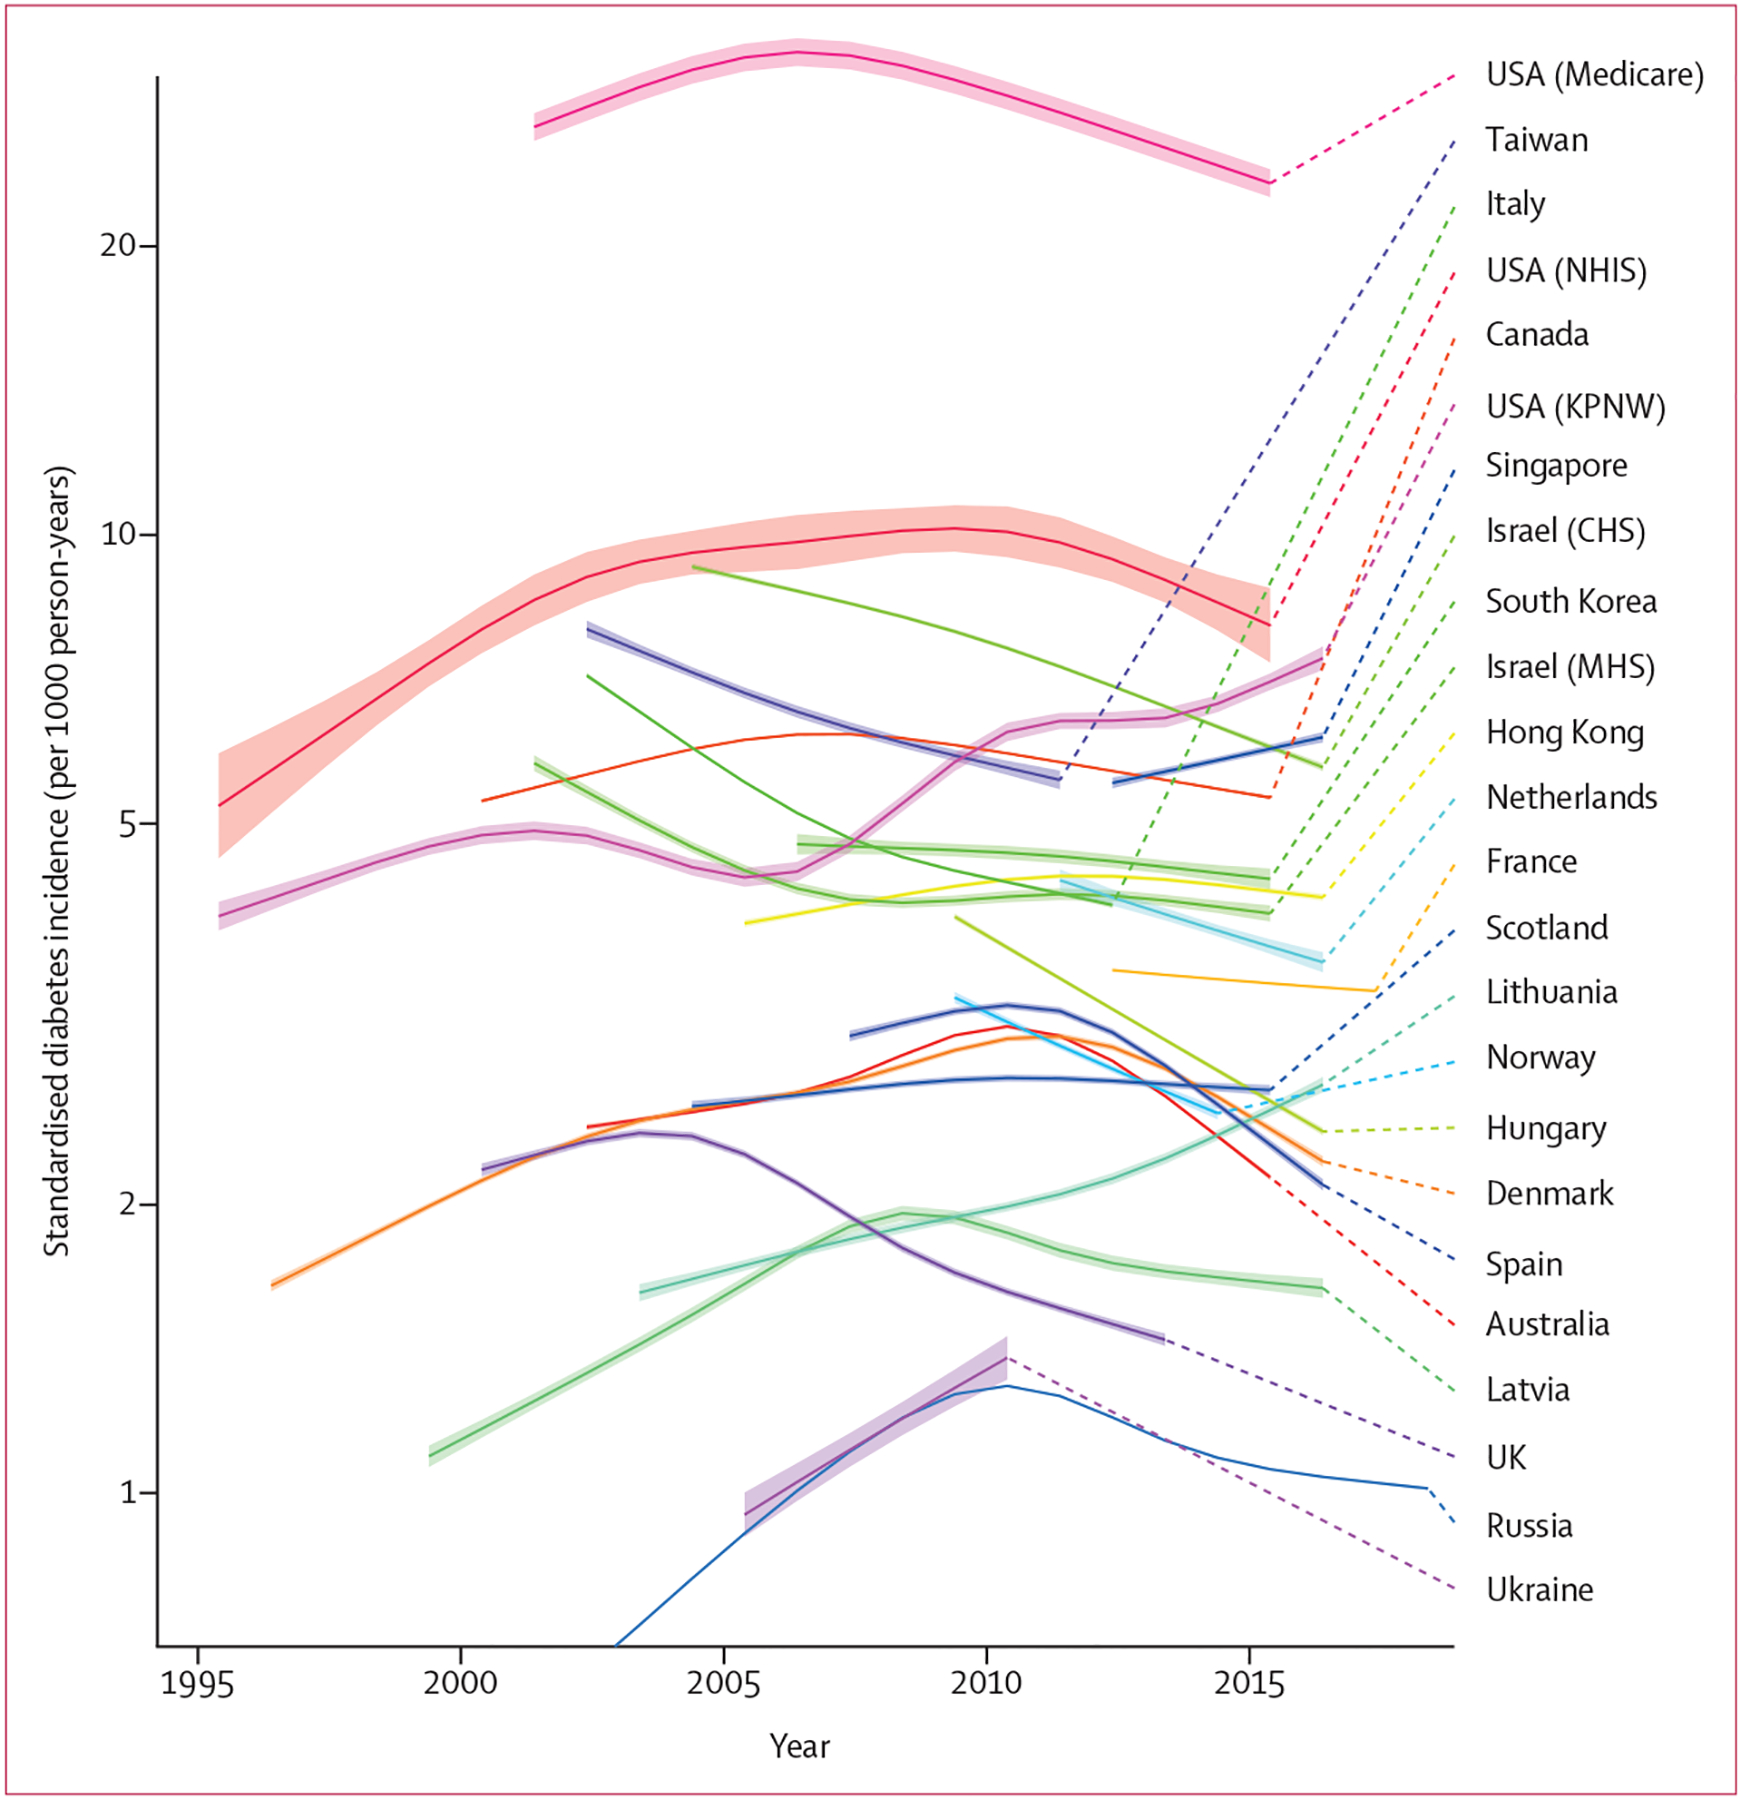
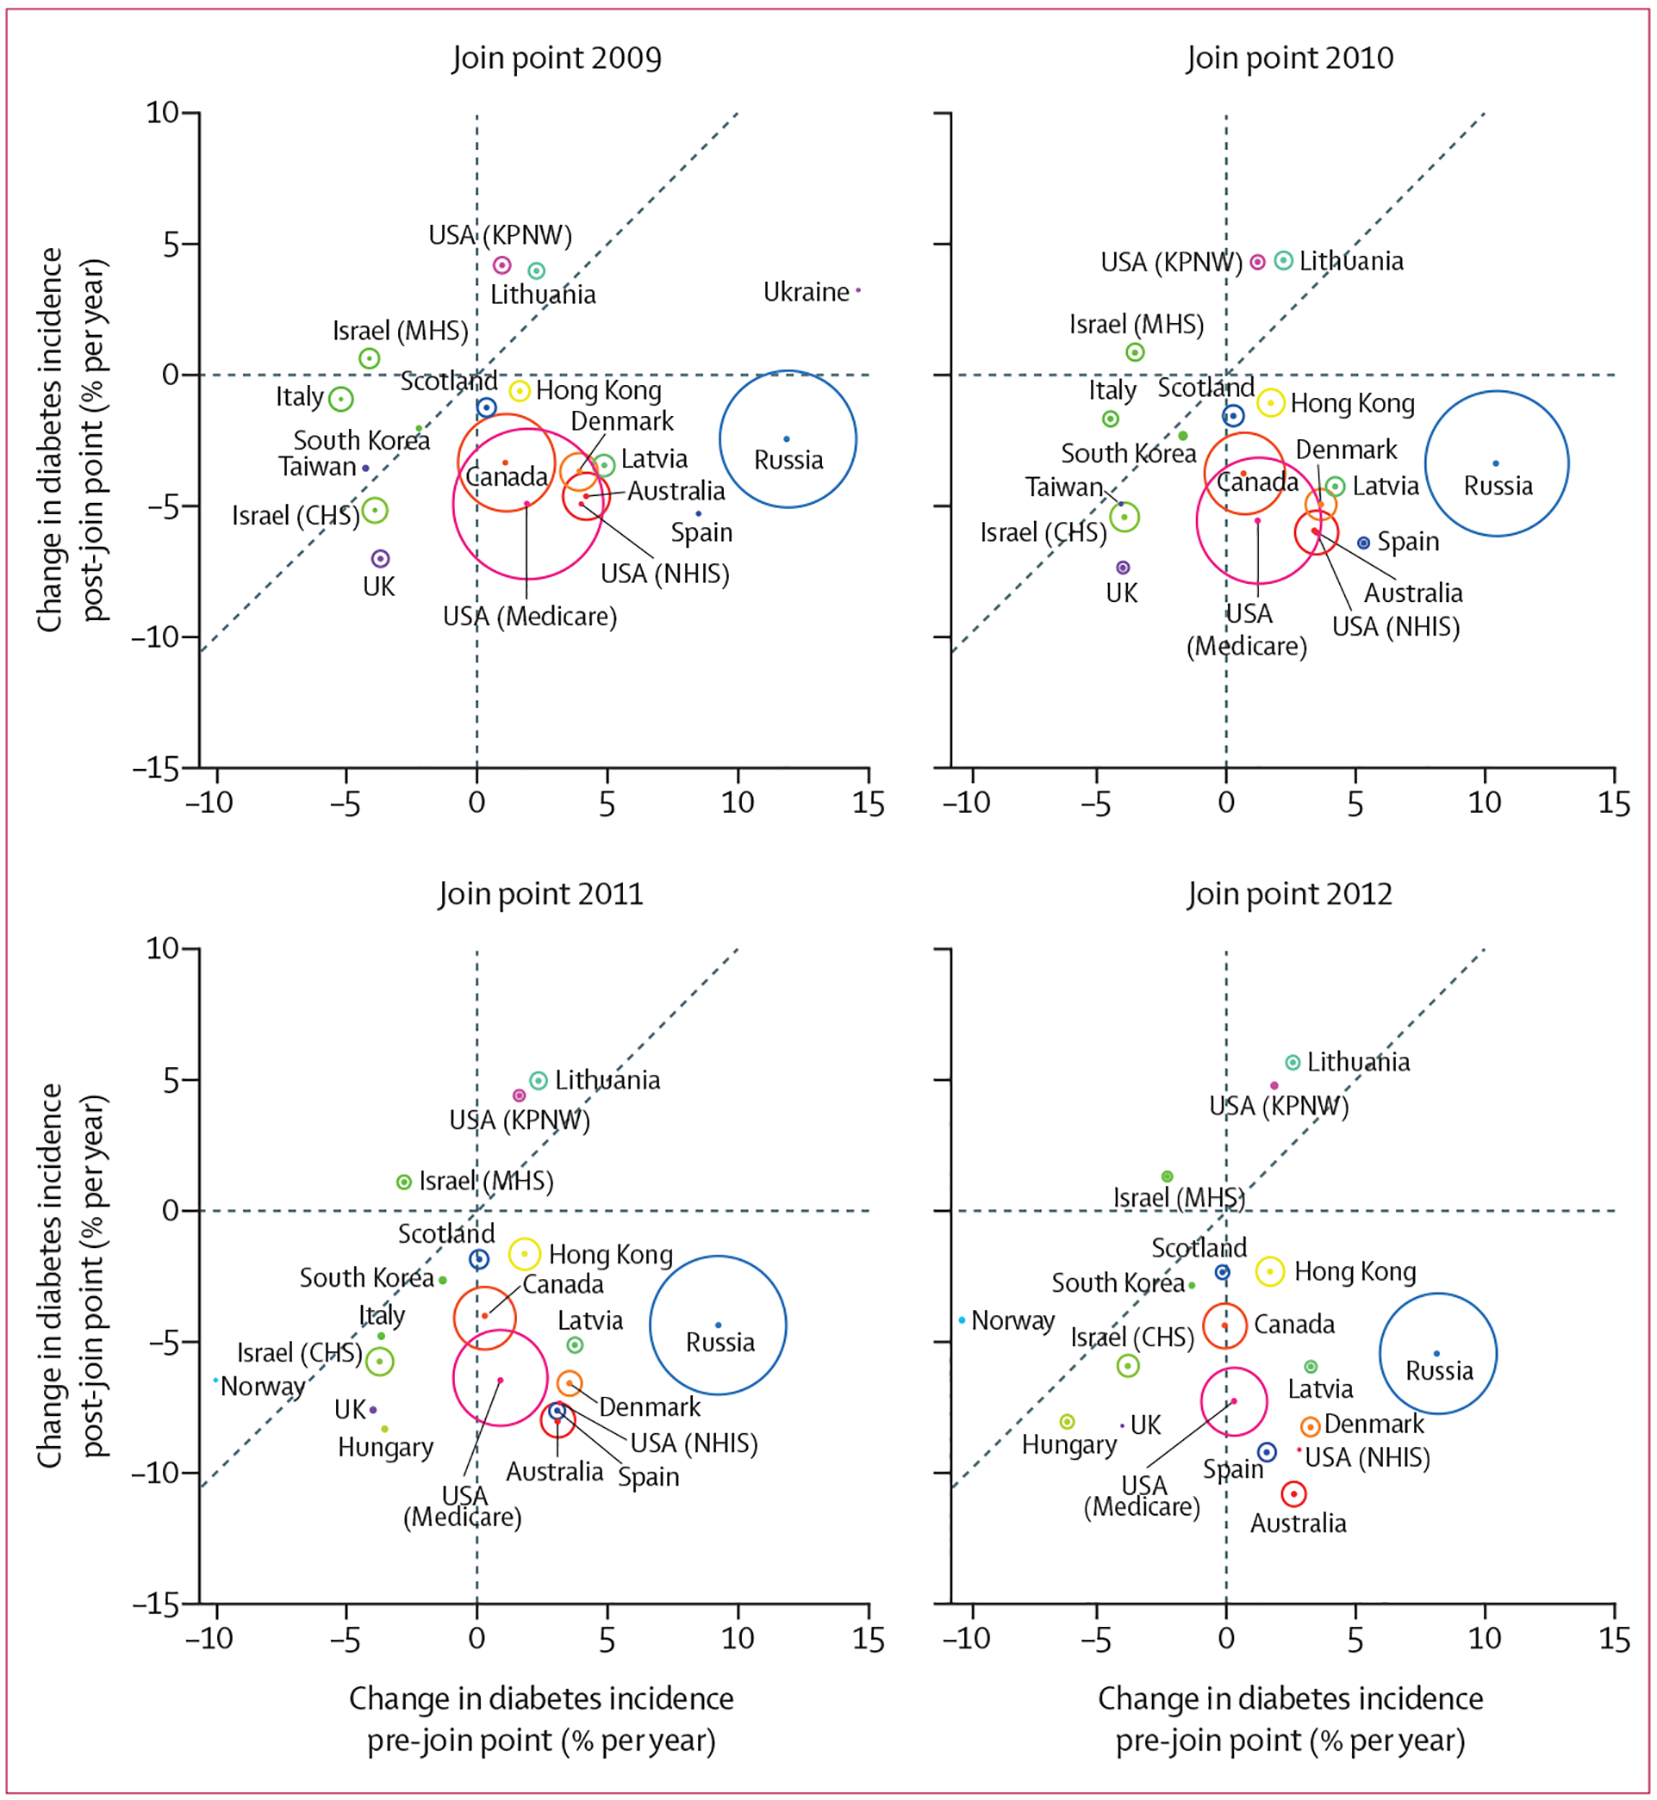
Findings: Our data included about 22 million diabetes diagnoses from 5 billion person-years of follow-up. Data were from 19 high-income and two middle-income countries or jurisdictions. 23 data sources had data from 2010 onwards, among which 19 had a downward or stable trend, with an annual estimated change in incidence ranging from -1·1% to -10·8%. Among the four data sources with an increasing trend from 2010 onwards, the annual estimated change ranged from 0·9% to 5·6%. The findings were robust to sensitivity analyses excluding data sources in which the data quality was lower and were consistent in analyses stratified by different diabetes definitions.
Interpretation: The incidence of diagnosed diabetes is stabilising or declining in many high-income countries. The reasons for the declines in the incidence of diagnosed diabetes warrant further investigation with appropriate data sources.
Funding: US Centers for Disease Control and Prevention, Diabetes Australia Research Program, and Victoria State Government Operational Infrastructure Support Program.
Copyright © 2021 Elsevier Ltd. All rights reserved.
Conflict of interest statement
Declaration of interests
We declare no competing interests.
Figures
Comment in
-
Progress in diabetes prevention or epidemiology-or both, or neither?Lancet Diabetes Endocrinol. 2021 Apr;9(4):190-191. doi: 10.1016/S2213-8587(20)30433-2. Epub 2021 Feb 23. Lancet Diabetes Endocrinol. 2021. PMID: 33636103 Free PMC article. No abstract available.
References
-
- Cho NH, Shaw JE, Karuranga S, et al. IDF Diabetes Atlas: global estimates of diabetes prevalence for 2017 and projections for 2045. Diabetes Res Clin Pract 2018; 138: 271–81. - PubMed
-
- Ogurtsova K, da Rocha Fernandes JD, Huang Y, et al. IDF Diabetes Atlas: global estimates for the prevalence of diabetes for 2015 and 2040. Diabetes Res Clin Pract 2017; 128: 40–50. - PubMed
-
- International Diabetes Federation. IDF Diabetes Atlas, 9th edn. Brussels: International Diabetes Federation, 2019.
-
- Geiss LS, Wang J, Cheng YJ, et al. Prevalence and incidence trends for diagnosed diabetes among adults aged 20 to 79 years, United States, 1980–2012. JAMA 2014; 312: 1218–26. - PubMed
Publication types
MeSH terms
Grants and funding
LinkOut - more resources
Full Text Sources
Other Literature Sources
Medical
