. 2021 Mar 4;184(5):1348-1361.e22.
doi: 10.1016/j.cell.2021.01.049. Epub 2021 Feb 25.

Increased stem cell proliferation in atherosclerosis accelerates clonal hematopoiesis

Affiliations

Increased stem cell proliferation in atherosclerosis accelerates clonal hematopoiesis

Alexander Heyde et al. Cell. .

Abstract

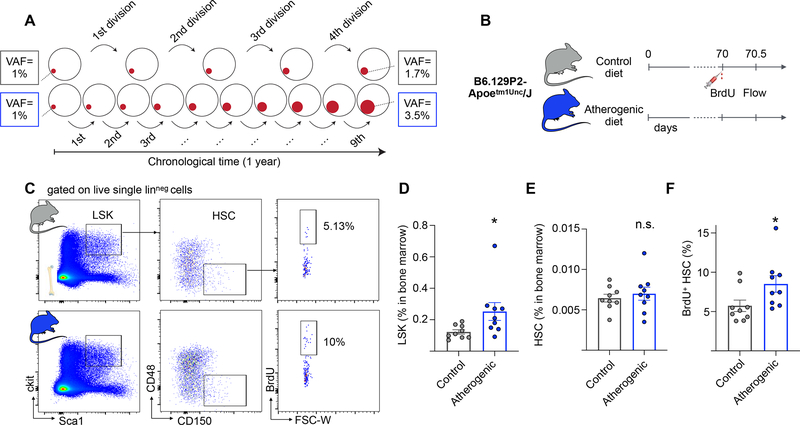
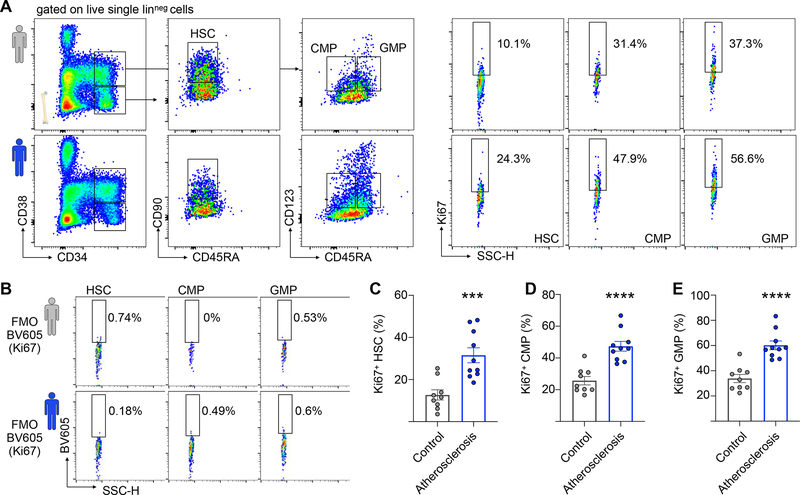
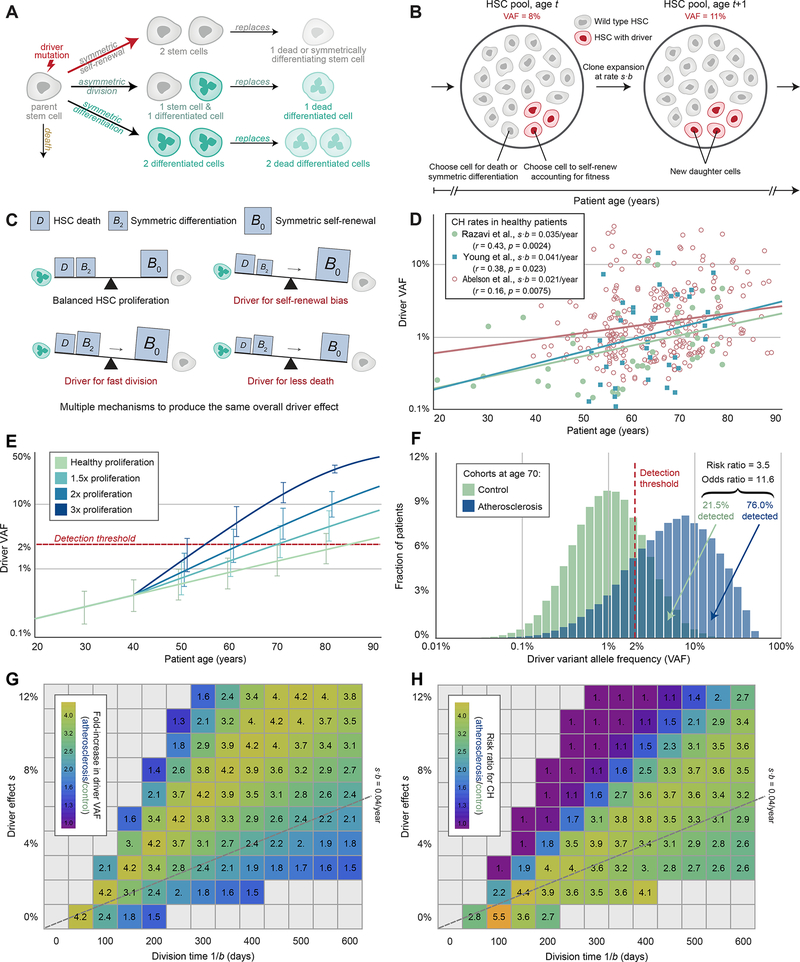
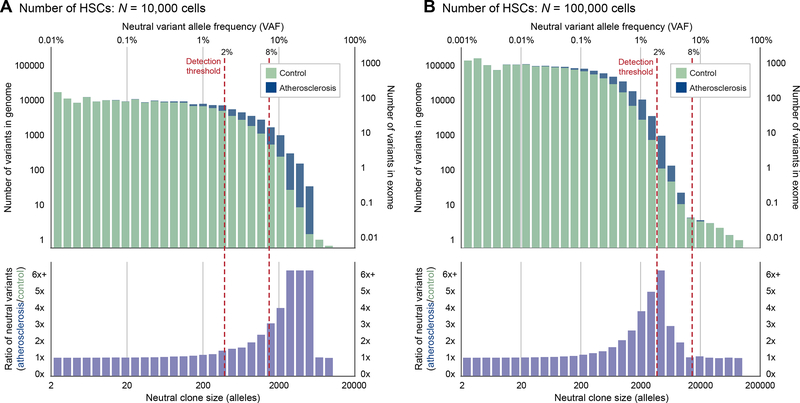
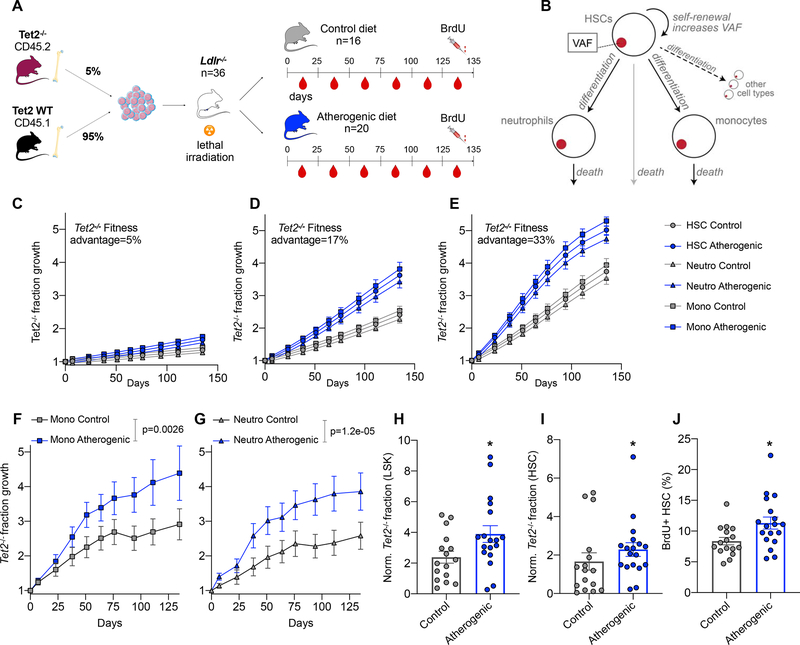
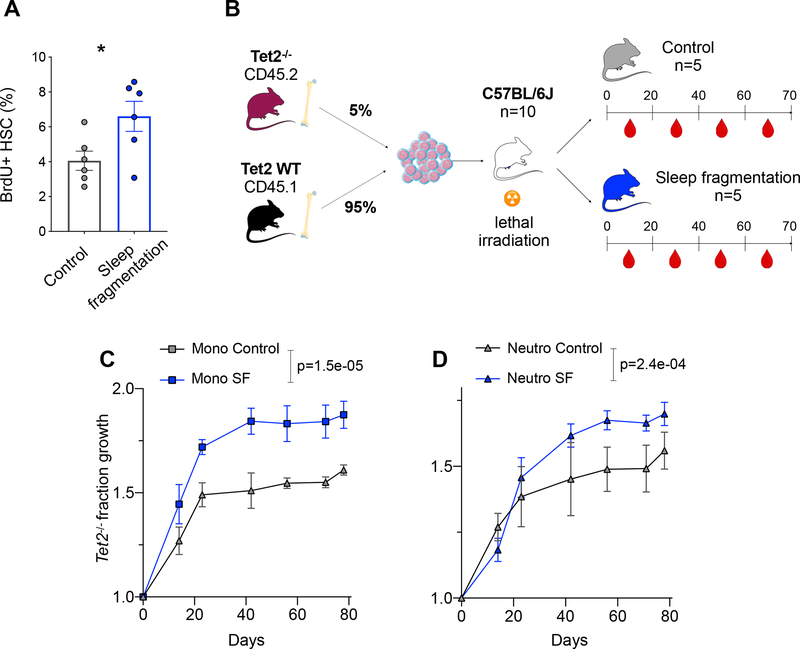
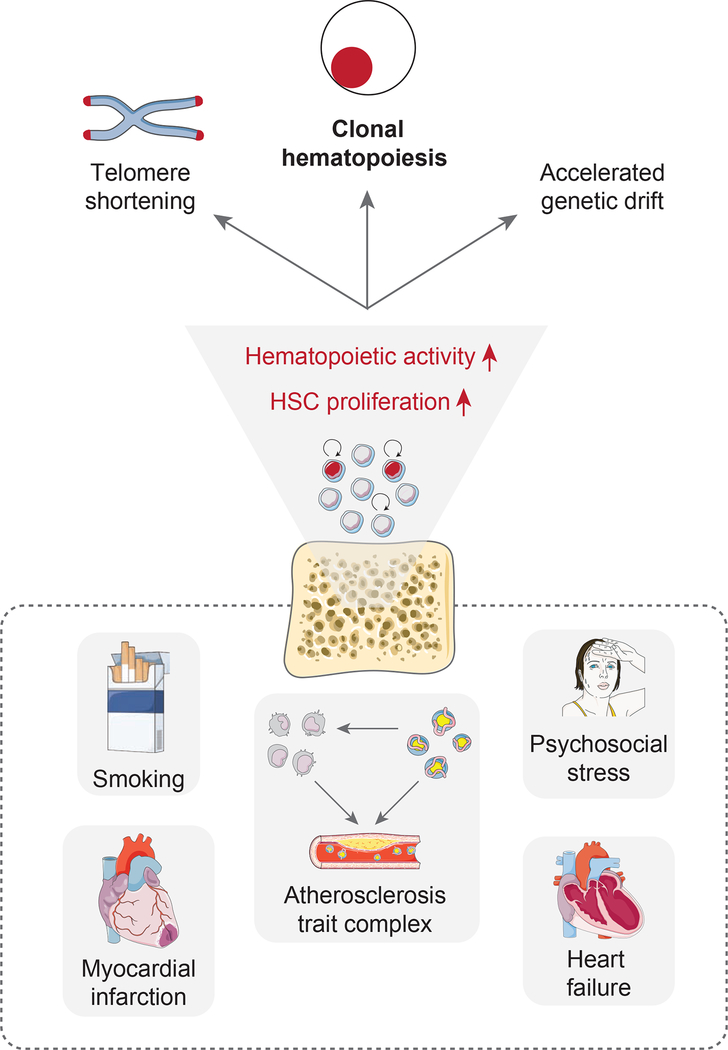
Clonal hematopoiesis, a condition in which individual hematopoietic stem cell clones generate a disproportionate fraction of blood leukocytes, correlates with higher risk for cardiovascular disease. The mechanisms behind this association are incompletely understood. Here, we show that hematopoietic stem cell division rates are increased in mice and humans with atherosclerosis. Mathematical analysis demonstrates that increased stem cell proliferation expedites somatic evolution and expansion of clones with driver mutations. The experimentally determined division rate elevation in atherosclerosis patients is sufficient to produce a 3.5-fold increased risk of clonal hematopoiesis by age 70. We confirm the accuracy of our theoretical framework in mouse models of atherosclerosis and sleep fragmentation by showing that expansion of competitively transplanted Tet2-/- cells is accelerated under conditions of chronically elevated hematopoietic activity. Hence, increased hematopoietic stem cell proliferation is an important factor contributing to the association between cardiovascular disease and clonal hematopoiesis.

Keywords: atherosclerosis; clonal hematopoiesis; hematopoietic stem cell; somatic evolution.


Conflict of interest statement

Declaration of interests The authors declare no competing interests.

Figures

Figure 1.
Figure 1.. Apoe−/− mice on an atherogenic diet exhibit increased HSC proliferation.
(A) Schematic illustrating hypothetical examples of driver clone growth. HSCs in one person (top row, grey boxes) undergo e.g. 4 symmetric self-renewal divisions per year. A driver that confers a fitness advantage s of 15% will on average expand from a VAF of 1% to 1.7%. HSCs in an person with a 2.25-fold elevated proliferation rate (bottom row, blue boxes) will undergo 9 self-renewal division in the same time, resulting in a driver VAF of 3.5%. (B) Experimental outline. Apoe−/− mice are fed with atherogenic or control (chow) diets for 10 weeks. A BrdU pulse is administered and bone marrow cells are analyzed 12 hours later. (C) Representative flow cytometry plots and gating strategy for bone marrow HSCs. (D-F) Quantification of LSK percentage (D) HSC percentage (E) and BrdU+ HSCs (F) in bone marrow of Apoe−/− mice on atherogenic (n=9) and control (n=9) diets. Data are represented as mean ± SEM. Mann-Whitney tests were used for statistical analysis in D-F. All tests were two-sided. * indicates p<0.05, n.s., not significant. See also Figure S1.
Figure 2.
Figure 2.. Atherosclerosis associates with increased HSC proliferation in human patients.
(A) Representative flow cytometry plots and gating strategy for human bone marrow HSCs, CMPs and GMPs. The top row (grey human symbol) represents a healthy 72-year-old female (patient #9); the bottom row (blue human symbol) represents a 72-year-old male atherosclerosis patient (patient #18). (B) Fluorescence-minus-one (FMO) controls for patients #9 and #18. (C-E) Quantification of BrdU+ HSC (C) CMP (D) and GMPs (E) in controls (n=9) and patients with atherosclerosis (n=10). Data are represented as mean ± SEM. Unpaired t-tests with Welch’s correction were used for statistical analysis in (C-E). All tests were two-sided. *** indicates p=0.0005, **** indicates p<0.0001. See also Figure S1 and Table S1.
Figure 3.
Figure 3.. Elevated HSC proliferation expedites driver clone expansion.
(A) Schematic of stochastic HSC dynamics. Some genetic variants (“driver mutations”) result in an imbalance in cell fates in favor of self-renewal. (B) Moran model of driver VAF expansion. Each time an HSC is lost to death or symmetric differentiation and needs replacement via self-renewal, an HSC with a driver mutation (red) is more likely to self-renew than a baseline HSC (gray), resulting in expected growth of the driver clone size over time. (C), Imbalance in cell fates. Baseline HSCs (gray) balance their self-renewal rates (B0) with the sum of their symmetric differentiation rates (B2) and death rates (D), while any of three different driver mechanisms (self-renewal bias, fast division, or less death) all result in an imbalance towards self-renewal. (D) Observed driver clone sizes (VAFs) across patient ages from 3 published data sets. (E) Expected driver VAF expansion over time. The driver clone expands more rapidly in atherosclerosis patients with a higher proliferation rate at an onset of age 40 (blue curves with ±1 SD bars), such that these patients surpass a 2% detection threshold (red dotted line) at an earlier age. (F) Predicted driver VAF distributions at age 70 across two patient cohorts. Relative to the healthy cohort (green), patients in the atherosclerosis cohort (blue) have an elevated proliferation rate, corresponding to the Ki67+ HSC distributions measured in the two human cohorts as shown in Figure 2C scaled with a baseline rate of 1/(28 days). (G) Fold-increase in driver VAF at age 70. Across a wide range of potential division times 1/b and driver effect sizes s near our estimate from panel (D) (gray dotted line), our model predicts a consistently noticeable increase in driver clone size in atherosclerosis patients with a two-fold increase in proliferation. (H) Predicted risk ratios for CH associated with the atherosclerosis cohort relative to the healthy cohort in (F). Across a wide range of potential division times 1/b and driver effect sizes s near our estimate from panel (D), the model predicts a consistently greater risk of a detectable driver clone at age 70 in atherosclerosis patients. See also Figures S1–S4 and Table S2.
Figure 4.
Figure 4.. Elevated HSC proliferation leads to excess neutral mutations.
(A-B), Distribution of variant allele frequency (VAF, top axis) and neutral clone size (total number of variant alleles out of 2N, bottom axis) of neutral somatic variants for an HSC pool size of either (A) N = 10,000 cells, or (B) N = 100,000 cells, averaged across patients with initial mutation burdens determined by simulated prenatal cell divisions. Patients in the atherosclerosis cohort (blue) have elevated proliferation rates consistent with Figures 2C and 3F that lead to more neutral variants at intermediate VAFs relative to patients in the healthy cohort (green). For N = 100,000 cells, the peak of this enrichment curve (purple) can be captured by sequencing with a 2% detection threshold but not an 8% threshold. For N = 10,000 cells, either a 2% or an 8% threshold are sufficient to detect enrichment. See also Figure S5.
Figure 5.
Figure 5.. Accelerated Tet2−/− fraction growth in the Ldlr−/− mouse model of atherosclerosis.
(A) Schematic overview of an experiment designed to track the evolution of Tet2−/− cells in atherosclerotic mice. (B) A slightly modified version of the driver clone model (Figure 3) which explicitly incorporates monocytes and neutrophils (STAR methods) is used to predict the expected outcome of the experiment shown in (A). (C-E) Predictions of the model in (B) for s=5% (C), s=17% (D) and s=33% (E). We model a proliferation rate b = 1/(17.5 days) in the control group and a 75% elevation of b associated with the atherosclerosis trait complex. HSCs, neutrophils, monocytes are shown as circles, triangles and squares, respectively. The y-axis denotes fold change of the Tet2−/− fraction with respect to the starting time point. Error bars indicate the SEM. (F-G), Results of the experiment shown in (A). The Tet2−/− (CD45.2) fraction of monocytes (F) and neutrophils (G) is shown across all peripheral blood measurements in Ldlr−/− mice receiving control or atherogenic diets. Error bars indicate the SEM, p-values are derived from linear regression of the logit-transformed baseline-normalized data. Y-axes as in (C-E). (H) Fraction of Tet2−/− LSKs at the end of the experiment shown in (A), day 135. Since engraftment varies stochastically and every mouse has a different fraction of mutant cells at the outset of the experiment, the percentage of Tet2−/− LSKs is normalized to baseline (divided by the CD45.2+ neutrophil percentage at day 0). P-values are calculated with a two-sided Mann-Whitney test. (I) as in (H) for HSCs. (J) Quantification of BrdU+ HSCs on day 135. P-values are calculated with a two-sided Mann-Whitney test. n=16 in the control group and n=18 in the atherosclerosis group in panels H-J (two mice died during the experiment in the atherosclerosis group). * indicates p<0.05. See also Figure S6–S7 and Table S3.
Figure 6.
Figure 6.. Accelerated Tet2−/− fraction growth in a sleep fragmentation mouse model.
(A) BrdU incorporation (after a 2-hour pulse) in HSCs of C57BL/6J mice exposed to sleep fragmentation (n=6) vs. control mice on a normal sleep schedule (n=6). Two-sided t-test with Welch’s correction. (B) Schematic of an experiment to track the evolution of Tet2−/− cells in sleep-deprived mice, as in Figure 5A. (C-D) Tet2−/− (CD45.2) fraction growth in monocytes (C) and neutrophils (D) is shown across all peripheral blood measurements in control mice or mice exposed to sleep fragmentation (SF). Error bars indicate the SEM; p-values are derived from linear regression of the logit-transformed baseline-normalized data. Axes as in Figure 5F–G. * indicates p<0.05. See also Figure S7.
Figure 7.
Figure 7.. Schematic summarizing the relationship between HSC proliferation and clonal hematopoiesis.
Factors that instigate HSC proliferation - for example the atherosclerosis trait complex, smoking, chronic psychosocial stress, heart failure or myocardial infarction - promote accelerated somatic evolution and CH emergence.

Comment in

References

    1. Abelson S, Collord G, Ng SWK, Weissbrod O, Mendelson Cohen N, Niemeyer E, Barda N, Zuzarte PC, Heisler L, Sundaravadanam Y, et al. (2018). Prediction of acute myeloid leukaemia risk in healthy individuals. Nature 559, 400–404. - PMC - PubMed
    1. Abkowitz JL, Golinelli D, Harrison DE, and Guttorp P (2000). In vivo kinetics of murine hemopoietic stem cells. Blood 96, 3399–3405. - PubMed
    1. Abkowitz JL, Catlin SN, McCallie MT, and Guttorp P (2002). Evidence that the number of hematopoietic stem cells per animal is conserved in mammals. Blood 100, 2665–2667. - PubMed
    1. Altrock PM, Liu LL, and Michor F (2015). The mathematics of cancer: integrating quantitative models. Nat. Rev. Cancer 15, 730–745. - PubMed
    1. Ashcroft P, Manz MG, and Bonhoeffer S (2017). Clonal dominance and transplantation dynamics in hematopoietic stem cell compartments. PLoS Comput. Biol. 13, e1005803. - PMC - PubMed

Publication types