. 2021 Mar 4;184(5):1245-1261.e21.
doi: 10.1016/j.cell.2021.02.021. Epub 2021 Feb 25.

In vivo CRISPR screening reveals nutrient signaling processes underpinning CD8+ T cell fate decisions

Affiliations

In vivo CRISPR screening reveals nutrient signaling processes underpinning CD8+ T cell fate decisions

Hongling Huang et al. Cell. .

Abstract

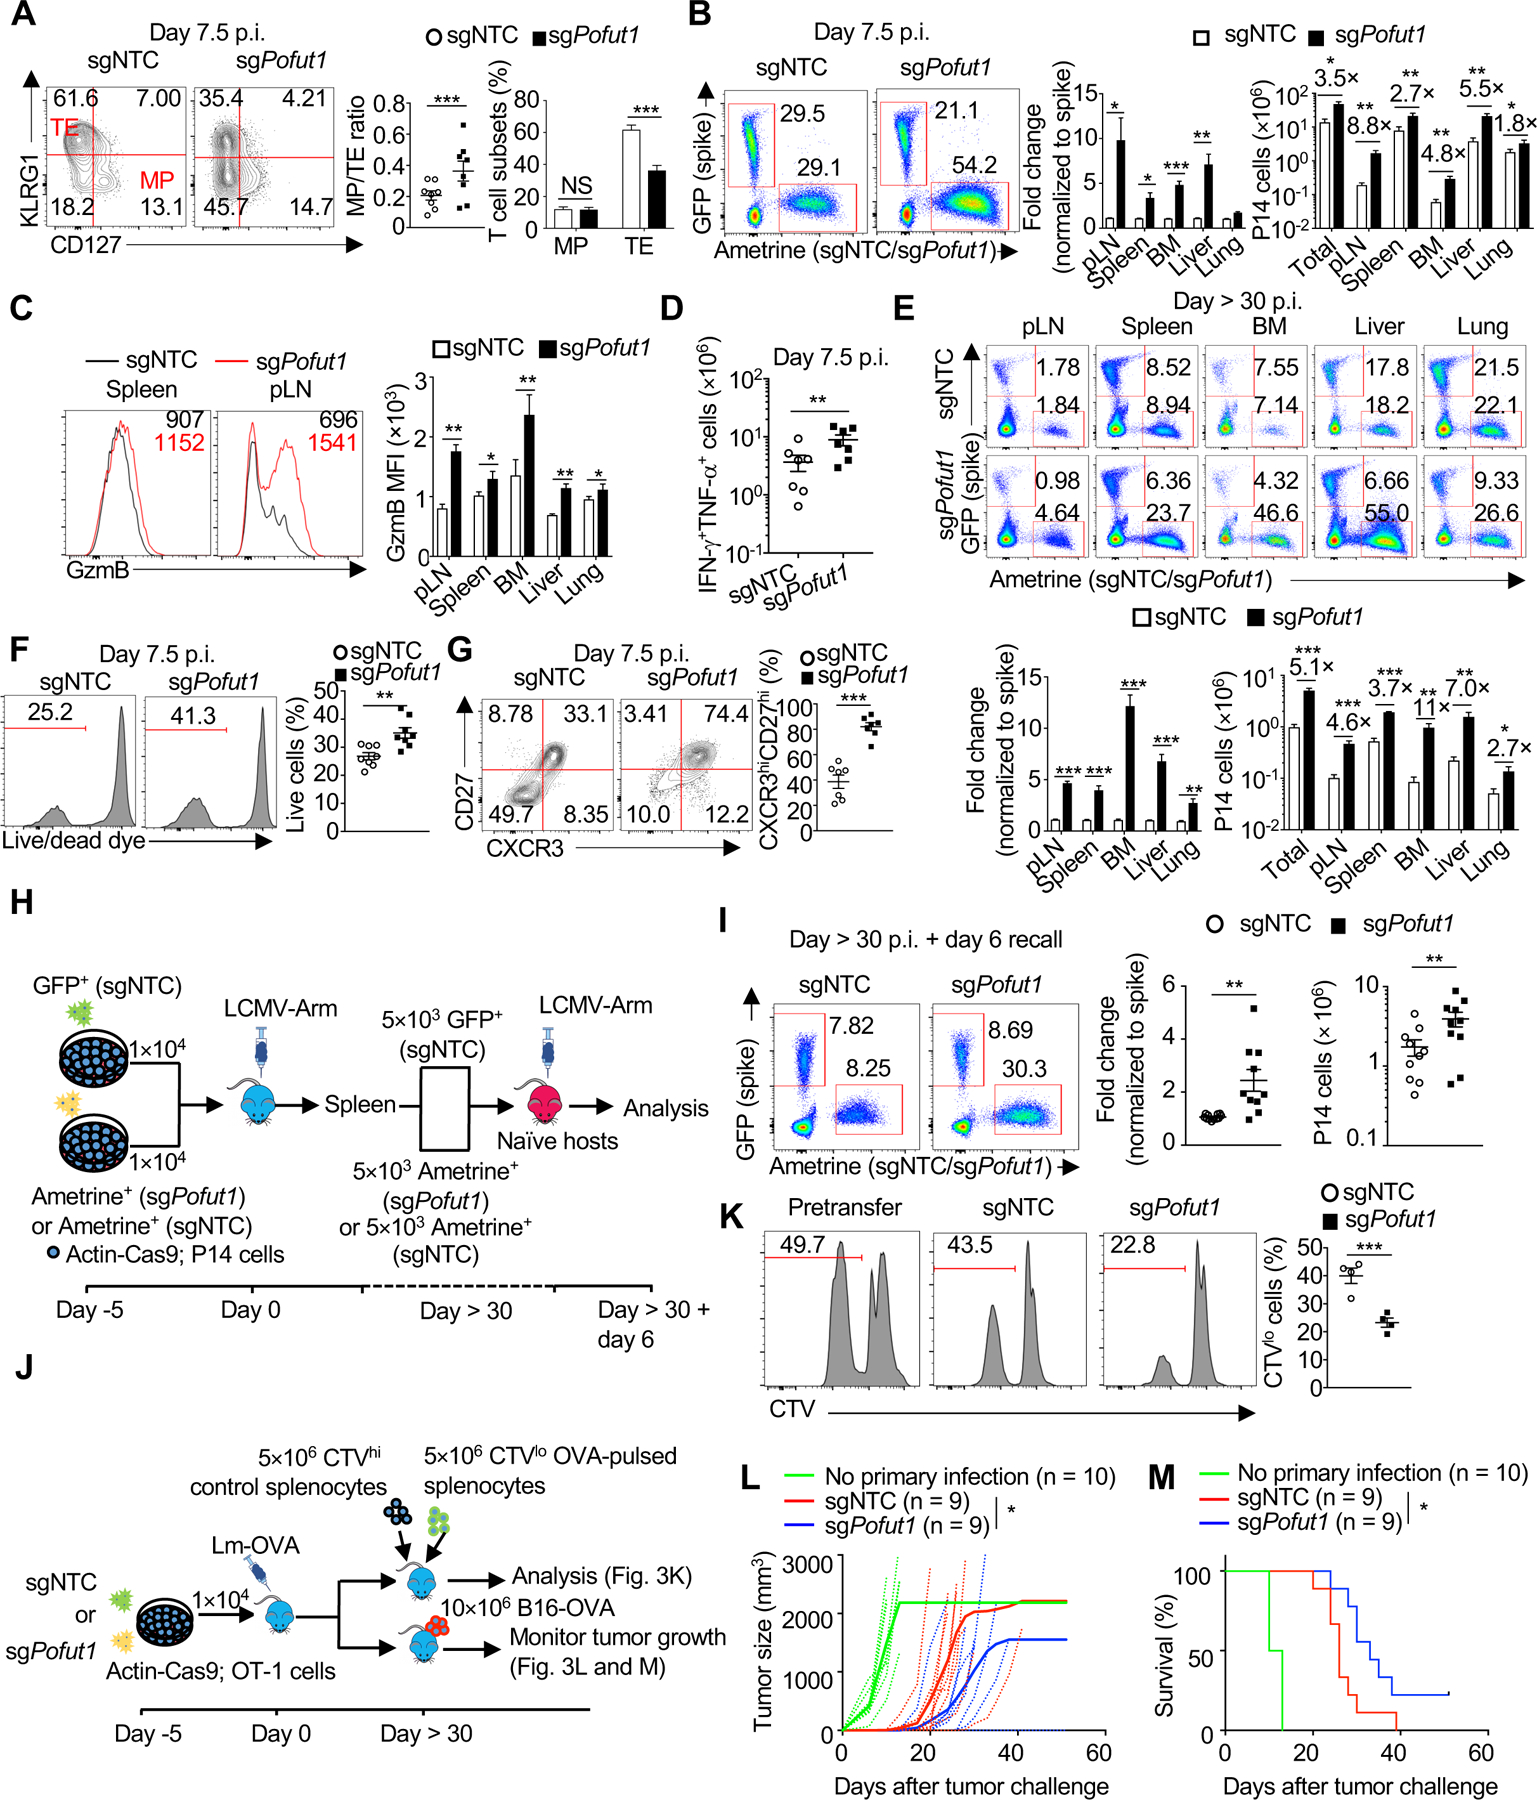
How early events in effector T cell (TEFF) subsets tune memory T cell (TMEM) responses remains incompletely understood. Here, we systematically investigated metabolic factors in fate determination of TEFF and TMEM cells using in vivo pooled CRISPR screening, focusing on negative regulators of TMEM responses. We found that amino acid transporters Slc7a1 and Slc38a2 dampened the magnitude of TMEM differentiation, in part through modulating mTORC1 signaling. By integrating genetic and systems approaches, we identified cellular and metabolic heterogeneity among TEFF cells, with terminal effector differentiation associated with establishment of metabolic quiescence and exit from the cell cycle. Importantly, Pofut1 (protein-O-fucosyltransferase-1) linked GDP-fucose availability to downstream Notch-Rbpj signaling, and perturbation of this nutrient signaling axis blocked terminal effector differentiation but drove context-dependent TEFF proliferation and TMEM development. Our study establishes that nutrient uptake and signaling are key determinants of T cell fate and shape the quantity and quality of TMEM responses.

Keywords: GDP-fucose; Notch; T cell memory; cell cycle exit; immunometabolism; in vivo pooled CRISPR screening; metabolic heterogeneity; nutrient signaling; systems immunology; terminal effector cell.


Conflict of interest statement

Declaration of interests H.C. is a consultant for Kumquat Biosciences, Inc.

Figures

Figure 1.
Figure 1.. Amino acid transporters restrict memory precursor differentiation.
(A) Diagram of the screening system. MP, memory precursor cells; TE, terminal effector cells. (B) Scatter plot of gene enrichment representing log2 FC (MP/input) versus log2 FC (TE/input). The significantly enriched (light red) and depleted (light blue) genes between MP and TE cells are highlighted. sgNTC (generated by averaging 1,000 non-targeting control gRNAs) is indicated in green. Selective known negative and positive genes are highlighted. FC, fold change. (C) Scatterplot of ratio of MP versus TE cells from the initial screening (x-axis) and validation experiments (y-axis) at day 7.5 post-infection (p.i.). The linear regression and R-squared (R2) analyses are shown. (D–H) Flow cytometry (left) and quantification (right) of the proportions of splenic MP and TE (D), CXCR3hiCD27hi (E), CD62L+ (F), or active caspase-3+ cells (G) and the expression of Bcl2 in sgNTC- and the indicated sgRNA-transduced P14 cells from dual-color transfer system. (I) Quantification of TEFF cell survival after in vitro culture with IL-2 for overnight. Data are from one (B), or compiled from at least two (C–I) independent experiments, with ≥ 8 (D–F and H) or 3 (G) biological replicates per group. *P < 0.05, **P < 0.01, and ***P < 0.001; two-tailed unpaired Student’s t-test (I) or two-tailed paired Student’s t-test (D–H). Data are presented as mean ± s.e.m. See also Figure S1 and Tables S1 and S2.
Figure 2.
Figure 2.. Amino acid transporters tune TMEM responses by promoting mTORC1 activation.
(A) Longitudinal analysis of P14 cell numbers in the blood (single-color transfer system). Red or green asterisks indicate statistical significance between sgNTC- and sgSlc7a1- or sgNTC- and sgSlc38a2-transduced cells, respectively. PBMCs, peripheral blood mononuclear cells. (B) Flow cytometry (left) and quantification of the number (right) of P14 cells from single-color transfer system. Fold changes between the groups in different organs are shown above the bar graphs. pLN, peripheral lymph nodes; BM, bone marrow. Total, the sum of donor-derived cells in pLN, spleen, BM, liver and lung. (C) Diagrams of the recall and in vivo killing assays. (D) Flow cytometry (left) and quantification of the frequency (middle) and number (right) of donor-derived P14 cells after the secondary challenge. (E) Flow cytometry (left) and quantification (right) of the frequency of gp33-pulsed splenocytes (CTVlo) post in vivo killing assay. CTV, CellTrace Violet. (F and G) Flow cytometry (F; left) and quantification (F; right and G) of mean fluorescence intensity (MFI) of S6 phosphorylation (pS6). (H) Flow cytometry (left) and quantification of the ratio of MP versus TE cells (right). (I and J) Longitudinal analysis of relative fold change (normalized to ‘spike’ cells) of P14 cells in the blood (I). Quantification of the relative fold change (normalized to ‘spike’ cel ls) in indicated sgRNA-transduced P14 cells (J). Data are representative of two (A), or compiled from at least two (B and D–J) independent experiments, with ≥ 4 (A, B, H, and I), 7 (D), 9 (E), or ≥ 8 (F, G, and J) biological replicates per group. *P < 0.05, **P < 0.01, and ***P < 0.001; NS, not significant; two-tailed unpaired Student’s t-test (A, B, D, E, and H–J) or two-tailed paired Student’s t-test (F and G). Data are presented as mean ± s.e.m. See also Figure S2 and Tables S1 and S2.
Figure 3.
Figure 3.. Pofut1 deficiency simultaneously promotes TEFF and TMEM responses.
(A) Flow cytometry (left) and quantification of the MP/TE ratio (middle) and proportions (right) of MP and TE cells. (B) Flow cytometry (from spleen; left) and quantification of the relative fold change (normalized to ‘spike’ cells; middle) and nu mber (right) of indicated P14 cells. pLN, peripheral lymph nodes; BM, bone marrow. (C) Flow cytometry (left) and quantification (right) of mean fluorescence intensity (MFI) of GzmB. (D) Quantification of IFN-γ+TNF-α+ CD8+ T cell number after gp33 peptide stimulation. (E) Flow cytometry (upper) and quantification of the relative fold change (normalized to ‘spike’ cells; lower left) and number (lower right) of P14 cells at day > 30 p.i. Total, the sum of donor-derived cells in pLN, spleen, BM, liver and lung. (F) Flow cytometry (left) and quantification (right) of the frequency of live TEFF cells after overnight culture with IL-2. (G) Flow cytometry (left) and quantification of CXCR3hiCD27hi cell frequency (right). (H) Diagram of the recall assay used in (I). (I) Flow cytometry (left) and quantification of the relative fold change (normalized to ‘spike’ cel ls; middle) and number (right) of the indicated P14 cells in the spleen after LCMV re-challenge. (J) Diagram of the in vivo killing and tumor re-challenge assays used in (K–M). (K) Flow cytometry (left) and quantification (right) of the frequency of OVA-pulsed splenocytes (CTVlo) after in vivo killing assay. CTV, CellTrace Violet. (L and M) Tumor size (L) and percent survival of tumor-bearing mice (M). Data are from one (L and M), representative of two (K), or compiled from at least two (A–G and I) independent experiments, with 8 (A and F), 7 (B, C, and G), 6 (D), 5 (E), ≥ 10 (I), 4 (K), or ≥ 9 (L and M) biological replicates per group. *P < 0.05, **P < 0.01, and ***P < 0.001; two-tailed paired Student’s t-test (A–G), two-tailed unpaired Student’s t-test (I and K), two-way analysis of variance (ANOVA) (L), or log-rank (Mantel–Cox) test (M). Data are presented as mean ± s.e.m. See also Figure S3.
Figure 4.
Figure 4.. Terminal differentiation of TEFF cells is dependent upon Pofut1 and associated with cell cycle exit.
(A) Differentially expressed genes in sgPofut1- compared to sgNTC-transduced P14 cells at day 7.5 post-infection (p.i.). Upregulated (orange) or downregulated (blue) transcripts [false discovery rate (FDR) < 0.05] are highlighted. Selective MP- and TE-associated genes are labelled. (B) Enrichment plots of cell cycle-related signatures. NES, normalized enrichment score. (C) Flow cytometry (left) and quantification (right) of BrdU incorporation. (D) UMAP plot of published scRNA-seq dataset of P14 cells at day 8 p.i. (Chen et al., 2019). Each dot corresponds to an individual cell. The number and frequency of cells in each of the color-coded clusters (clusters 1–3) are indi cated. (E) Violin plots of Klrg1, Cxcr3 or Il7r expression in clusters 1–3 from (D). (F) Gating str ategy (left) and quantification (right) of the proportions of TE′ (KLRG1hiCXCR3loCD127lo), MP (KLRG1loCXCR3hiCD127hi) and TINT (CXCR3hiCD127lo) cells among WT P14 cells. (G) PCA plot of TE′, MP and TINT cells [gating strategy in (F)] at day 7.5 p.i., with the percentage of variance shown. (H) Quantification of the relative frequency of BrdU+ cells in MP and TINT cells compared to TE′ cells. (I) Diagram of the in vivo differentiation assay (left), flow cytometry of KLRG1 versus CXCR3 expression (middle), and quantification of TINT, TE′ and CXCR3hiCD127hi cells (right). Only representative plots of KLRG1 versus CXCR3 are shown (TE′ population is largely defined by KLRG1hiCXCR3lo cells, which constitute ~ 95% of TE′ cells). (J) Quantification of TE′, MP and TINT cells in the indicated P14 cells. (K) UMAP plot of Pofut1-dependent signature [downregulated genes as identified in (A)] in published scRNA-seq dataset from (D) (Chen et al., 2019). (L) UMAP plot of scRNA-seq data from sgNTC- (in black, left) and sgPofut1- (in red, right) transduced P14 cells (from dual-color transfer system) at day 7 p.i. Gray shadow indicates location of all cells; the number of analyzed cells in each group is indicated. (M) UMAP plot of the expression of Klrg1 (left), Cxcr3 (middle) and Il7r (right) in scRNA-seq data described in (L). (N) Flow cytometry of KLRG1 versus CXCR3 expression (left) and quantification (right) of TE′ cells in the in vivo differentiation assay similar as (I), except for the use of both wild-type and Pofut1-null TINT groups as the pretransfer cells. Data are from one (A, B, D, E, G, and K–M), representative of two (C, H, and N), or compiled from at least two (I, J, and N) independent experiments, with ≥ 4 (A, C, G, H, and I), 17 (F), 11 (J), or 3 (L and N) biological replicates per group. *P < 0.05, **P < 0.01, and ***P < 0.001; NS, not significant; two-tailed paired Student’s t-test (C), two-tailed unpaired Student’s t-test (I, J, and N), or one-way analysis of variance (ANOVA) (F and H). Data are presented as mean ± s.e.m. See also Figures S4–S6 and Tables S3–S6.
Figure 5.
Figure 5.. Pofut1 coordinates the chromatin state and metabolic regulation.
(A) Motif enrichment analysis of ATAC-seq data in sgPofut1- versus sgNTC-transduced cells at day 5 post-infection (p.i.). Top upregulated and downregulated motifs are indicated. (B) Footprinting analysis of selective AP1 family transcription factors in ATAC-seq data from (A). (C) Top-enriched Hallmark gene sets in sgPofut1- compared to sgNTC-transduced P14 cells. (D) Flow cytometry (upper) and quantification (lower) of relative mean fluorescence intensity (MFI) of mTORC1-associated markers [S6 phosphorylation (pS6), cell size (FSC-A), CD71 or CD98] in the indicated P14 cells. (E) Flow cytometry (upper) and quantification (lower) of relative MFI of Mitotracker, TMRM and CellROX in the indicated P14 cells. (F and G) Seahorse metabolic flux analysis of oxygen consumption rate (OCR) (F, left) and quantification of basal OCR (F, right) and extracellular acidification rate (ECAR; G) in the indicated P14 cells. Oligo, oligomycin; FCCP, carbonyl cyanide-p-trifluoromethoxyphenylhydrazon; Rot, rotenone. (H and I) Flow cytometry (upper) and quantification (lower) of relative MFI of mTORC1-associated markers (H) and metabolic parameters (I). (J and K) Seahorse metabolic flux analysis of OCR (J, left) and quantification of basal OCR (J, right) and ECAR (K) in splenic TE′ and TINT cells. Data are from one (A–C), or compiled from at least two (D–K) independent experiments, with ≥ 4 (A–D, J, and K), ≥ 6 (E), ≥ 3 (F and G), 8 (H), or 10 (I) biological replicates per group. *P < 0.05, and ***P < 0.001; two-tailed paired Student’s t-test (D, E, H, and I) or two-tailed unpaired Student’s t-test (F, G, J, and K). Data are presented as mean ± s.e.m. See also Figure S6.
Figure 6.
Figure 6.. Pofut1 links GDP-fucose biosynthesis and Notch signaling to promote TINT to TE′ transition.
(A and B) Representative plots of KLRG1 versus CXCR3 (left) and the quantification of TE′ cell frequency (right) in the indicated P14 cells. Pofut1 (R245A) mutant, fucosyltransferase inactive form of Pofut1. (C) Quantification of the relative fold change (normalized to ‘spike’ cells) of P14 cells transduc ed with the indicated sgRNAs. (D) Enrichment plot of Hallmark Notch signaling in sgPofut1- compared to sgNTC-transduced cells in the transcriptome profiling described in Figure 4A. (E) Volcano plot of differentially expressed transcripts in sgPofut1- compared to sgNTC-transduced P14 cells. (F and G) Real-time PCR analysis of Dtx1 expression (F) and immunoblot analysis of NICD expression (G) in the indicated P14 cells. (H-K) Quantification of the relative fold change (normalized to ‘spike’ cells) (H and J), flow cytometry of KLRG1 versus CXCR3 expression (I and K; left panels), and quantification of the frequencies of TINT, MP and TE′ cells (I and K; right panels) of P14 cells transduced with the indicated sgRNAs. Data are from one (D and E), or compiled from at least two (A–C, F, G, and H–K) independent experiments, with 6 (A and B), 9 (C), ≥ 4 (D–F and H– K), or 3 (G) biological replicates per group. **P < 0.01, and ***P < 0.001; NS, not significant; two-tailed unpaired Student’s t-test (A–C, F, H, and J) or two-tailed paired Student’s t-test (I and K). Data are presented as mean ± s.e.m. See also Figure S7.
Figure 7.
Figure 7.. Overexpression of NICD promotes TE′ program.
(A–H) P14 cells were transduced with empty (‘spike’, Ametrine+) or NICD-expression vector (pMIGII-NICD, GFP+). (A) UMAP plot of scRNA-seq data showing the distribution of individual cells. (B) Left, unsupervised clustering analysis identified 7 clusters. Right, quantification of the relative proportions of cells in each cluster. (C) UMAP plot of Klrg1 (left), Cxcr3 (middle) or Il7r (right) expression in scRNA-seq data. Cluster 1 region containing TE′ cells is indicated. (D) Flow cytometry of KLRG1 versus CXCR3 expression (left) and quantification of the frequencies of TINT, MP and TE′ cells (right). (E–G) Transcriptome analysis of the indicated splenic P14 cells from the dual-color transfer system at day 7.5 p.i. (E and F) Enrichment plots of the indicated signatures. (G) GSEA of top 10 downregulated Hallmark signatures. (H) Quantification of relative mean fluorescence intensity (MFI) of Ki-67, Mitotracker, TMRM and CellROX. (I–K) P14 cells from Cd4CrePofut1wt or Cd4CrePofut1fl/fl mice were transduced with pMIGII or pMIGII-NICD and mixed with non-transduced Cd4CrePofut1wt P14 cells (‘spike’) at a 1:1 ratio and transferred to naïve mice that were subsequently infected with LCMV and analyzed at day 7.5 p.i. (I) Flow cytometry of KLRG1 versus CXCR3 expression (left) and quantification of TE′ cell frequency (right). (J) Quantification of the relative fold change (normalized to ‘spike’ cells). (K) Heatmap of differentially expressed genes among Cd4CrePofut1wt and Cd4CrePofut1fl/fl P14 cells with or without NICD-overexpression. Data are from one (A–C , E–G, and K), or compiled from at least two (D and H–J) independent experiments, with 4 (D– G) or 5 (I and J) biological replicates per group. **P < 0.01, and ***P < 0.001; NS, not significant; two-tailed unpaired Student’s t-test (I and J) or two-tailed paired Student’s t-test (D and H). Data are presented as mean ± s.e.m. See also Figure S7.

Comment in

References

    1. Aibar S, Gonzalez-Blas CB, Moerman T, Huynh-Thu VA, Imrichova H, Hulselmans G, Rambow F, Marine JC, Geurts P, Aerts J, et al. (2017). SCENIC: single-cell regulatory network inference and clustering. Nat Methods 14, 1083–1086. - PMC - PubMed
    1. Amsen D, Helbig C, and Backer RA (2015). Notch in T Cell Differentiation: All Things Considered. Trends Immunol 36, 802–814. - PubMed
    1. Araki K, Turner AP, Shaffer VO, Gangappa S, Keller SA, Bachmann MF, Larsen CP, and Ahmed R (2009). mTOR regulates memory CD8 T-cell differentiation. Nature 460, 108–112. - PMC - PubMed
    1. Bailey TL, Boden M, Buske FA, Frith M, Grant CE, Clementi L, Ren J, Li WW, and Noble WS (2009). MEME SUITE: tools for motif discovery and searching. Nucleic Acids Res 37, W202–208. - PMC - PubMed
    1. Birsoy K, Wang T, Chen WW, Freinkman E, Abu-Remaileh M, and Sabatini DM (2015). An Essential Role of the Mitochondrial Electron Transport Chain in Cell Proliferation Is to Enable Aspartate Synthesis. Cell 162, 540–551. - PMC - PubMed

Publication types