Identification and validation of clinical phenotypes with prognostic implications in patients admitted to hospital with COVID-19: a multicentre cohort study
- PMID: 33636145
- PMCID: PMC7906623
- DOI: 10.1016/S1473-3099(21)00019-0
Identification and validation of clinical phenotypes with prognostic implications in patients admitted to hospital with COVID-19: a multicentre cohort study
Erratum in
-
Correction to Lancet Infect Dis 2021; 21: 783-92.Lancet Infect Dis. 2023 Jun;23(6):e198. doi: 10.1016/S1473-3099(23)00218-9. Epub 2023 Apr 4. Lancet Infect Dis. 2023. PMID: 37028442 Free PMC article. No abstract available.
Abstract
Background: The clinical presentation of COVID-19 in patients admitted to hospital is heterogeneous. We aimed to determine whether clinical phenotypes of patients with COVID-19 can be derived from clinical data, to assess the reproducibility of these phenotypes and correlation with prognosis, and to derive and validate a simplified probabilistic model for phenotype assignment. Phenotype identification was not primarily intended as a predictive tool for mortality.
Methods: In this study, we used data from two cohorts: the COVID-19@Spain cohort, a retrospective cohort including 4035 consecutive adult patients admitted to 127 hospitals in Spain with COVID-19 between Feb 2 and March 17, 2020, and the COVID-19@HULP cohort, including 2226 consecutive adult patients admitted to a teaching hospital in Madrid between Feb 25 and April 19, 2020. The COVID-19@Spain cohort was divided into a derivation cohort, comprising 2667 randomly selected patients, and an internal validation cohort, comprising the remaining 1368 patients. The COVID-19@HULP cohort was used as an external validation cohort. A probabilistic model for phenotype assignment was derived in the derivation cohort using multinomial logistic regression and validated in the internal validation cohort. The model was also applied to the external validation cohort. 30-day mortality and other prognostic variables were assessed in the derived phenotypes and in the phenotypes assigned by the probabilistic model.
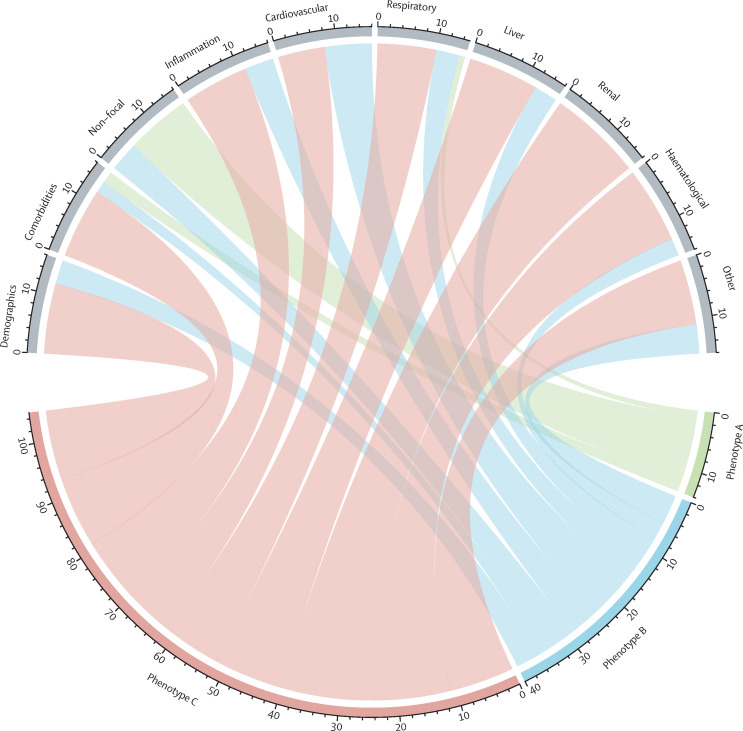
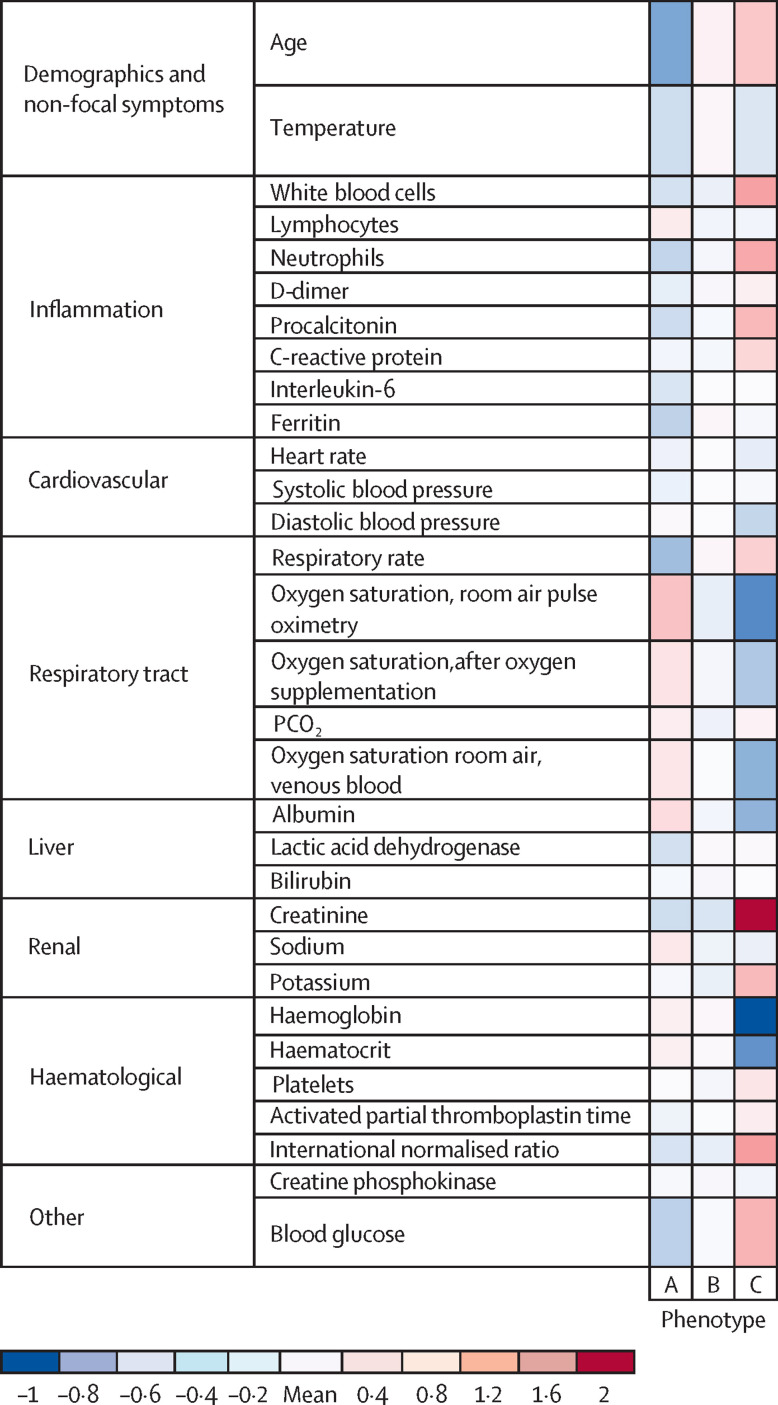
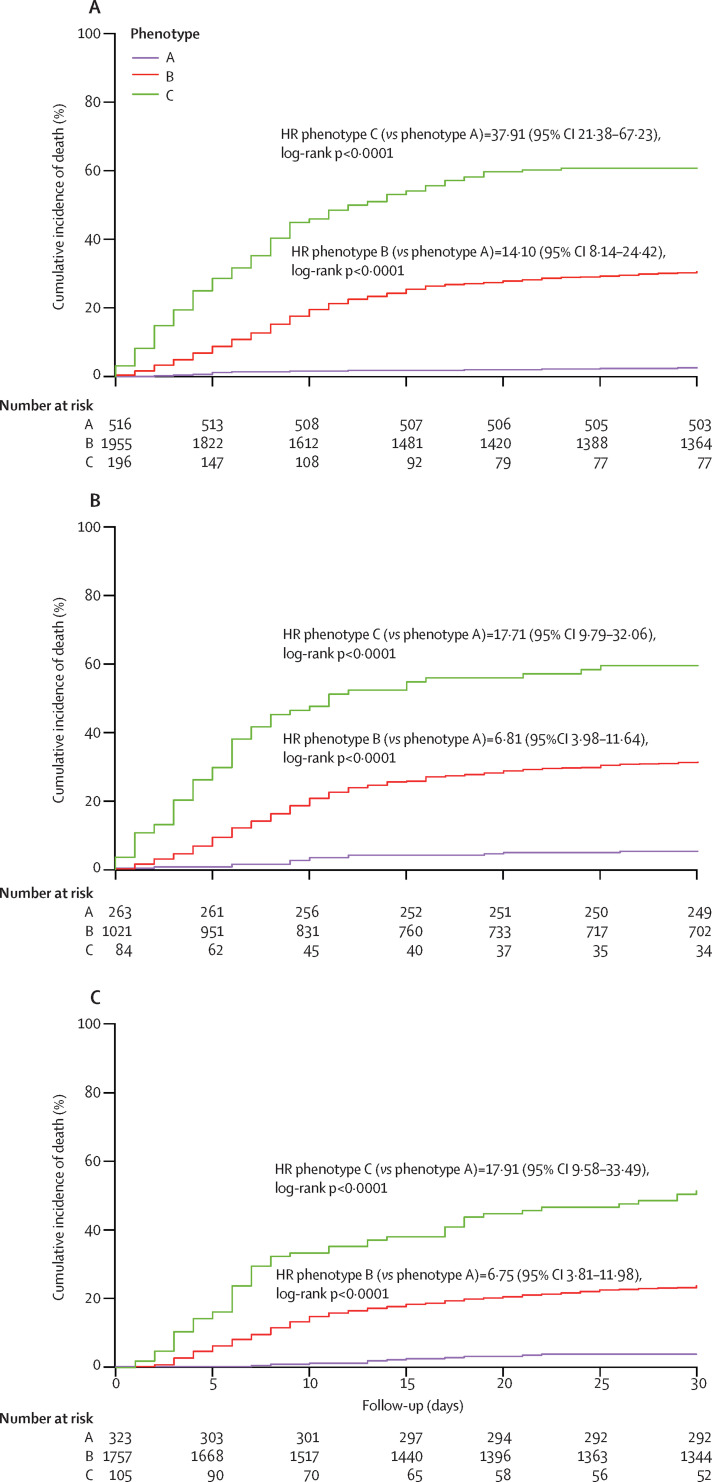
Findings: Three distinct phenotypes were derived in the derivation cohort (n=2667)-phenotype A (516 [19%] patients), phenotype B (1955 [73%]) and phenotype C (196 [7%])-and reproduced in the internal validation cohort (n=1368)-phenotype A (233 [17%] patients), phenotype B (1019 [74%]), and phenotype C (116 [8%]). Patients with phenotype A were younger, were less frequently male, had mild viral symptoms, and had normal inflammatory parameters. Patients with phenotype B included more patients with obesity, lymphocytopenia, and moderately elevated inflammatory parameters. Patients with phenotype C included older patients with more comorbidities and even higher inflammatory parameters than phenotype B. We developed a simplified probabilistic model (validated in the internal validation cohort) for phenotype assignment, including 16 variables. In the derivation cohort, 30-day mortality rates were 2·5% (95% CI 1·4-4·3) for patients with phenotype A, 30·5% (28·5-32·6) for patients with phenotype B, and 60·7% (53·7-67·2) for patients with phenotype C (log-rank test p<0·0001). The predicted phenotypes in the internal validation cohort and external validation cohort showed similar mortality rates to the assigned phenotypes (internal validation cohort: 5·3% [95% CI 3·4-8·1] for phenotype A, 31·3% [28·5-34·2] for phenotype B, and 59·5% [48·8-69·3] for phenotype C; external validation cohort: 3·7% [2·0-6·4] for phenotype A, 23·7% [21·8-25·7] for phenotype B, and 51·4% [41·9-60·7] for phenotype C).
Interpretation: Patients admitted to hospital with COVID-19 can be classified into three phenotypes that correlate with mortality. We developed and validated a simplified tool for the probabilistic assignment of patients into phenotypes. These results might help to better classify patients for clinical management, but the pathophysiological mechanisms of the phenotypes must be investigated.
Funding: Instituto de Salud Carlos III, Spanish Ministry of Science and Innovation, and Fundación SEIMC/GeSIDA.
Copyright © 2021 Elsevier Ltd. All rights reserved.
Figures
Comment in
-
Anticipating outcomes for patients with COVID-19 and identifying prognosis patterns.Lancet Infect Dis. 2021 Jun;21(6):744-745. doi: 10.1016/S1473-3099(21)00073-6. Epub 2021 Feb 23. Lancet Infect Dis. 2021. PMID: 33636149 Free PMC article. No abstract available.
References
Publication types
MeSH terms
LinkOut - more resources
Full Text Sources
Other Literature Sources
Medical
Miscellaneous