. 2021 Jun 1;89(11):1096-1105.
doi: 10.1016/j.biopsych.2020.12.022. Epub 2021 Jan 8.

Ketamine Rapidly Enhances Glutamate-Evoked Dendritic Spinogenesis in Medial Prefrontal Cortex Through Dopaminergic Mechanisms

Affiliations

Ketamine Rapidly Enhances Glutamate-Evoked Dendritic Spinogenesis in Medial Prefrontal Cortex Through Dopaminergic Mechanisms

Mingzheng Wu et al. Biol Psychiatry. .

Abstract

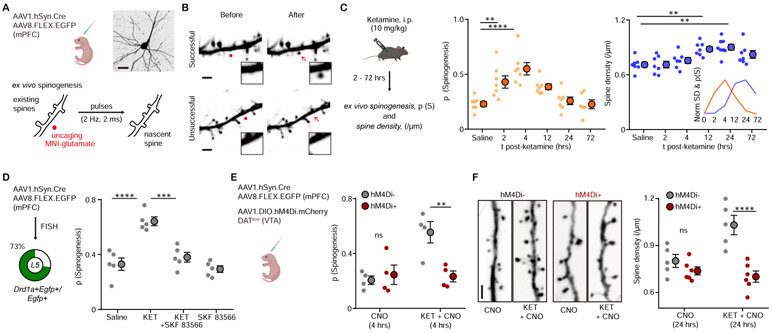
Background: Ketamine elicits rapid onset antidepressant effects in patients with clinical depression through mechanisms hypothesized to involve the genesis of neocortical dendritic spines and synapses. Yet, the observed changes in dendritic spine morphology usually emerge well after ketamine clearance, raising questions about the link between rapid behavioral effects of ketamine and plasticity.

Methods: Here, we used two-photon glutamate uncaging/imaging to focally induce spinogenesis in the medial prefrontal cortex, directly interrogating baseline and ketamine-associated plasticity of deep layer pyramidal neurons in C57BL/6 mice. We combined pharmacological, genetic, optogenetic, and chemogenetic manipulations to interrogate dopaminergic mechanisms underlying ketamine-induced rapid enhancement in evoked plasticity and associated behavioral changes.

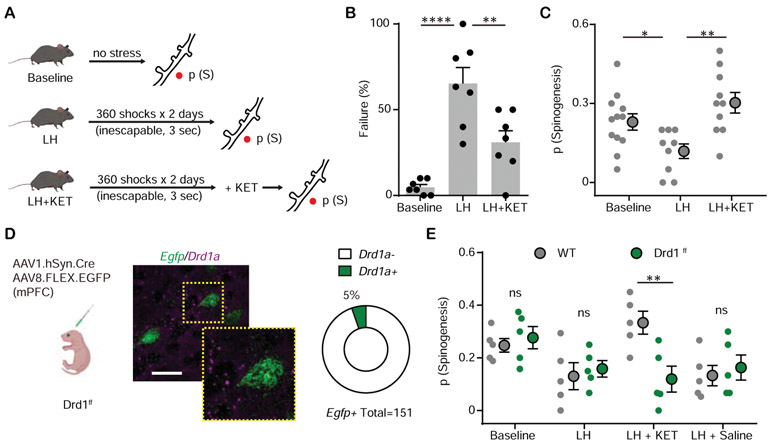
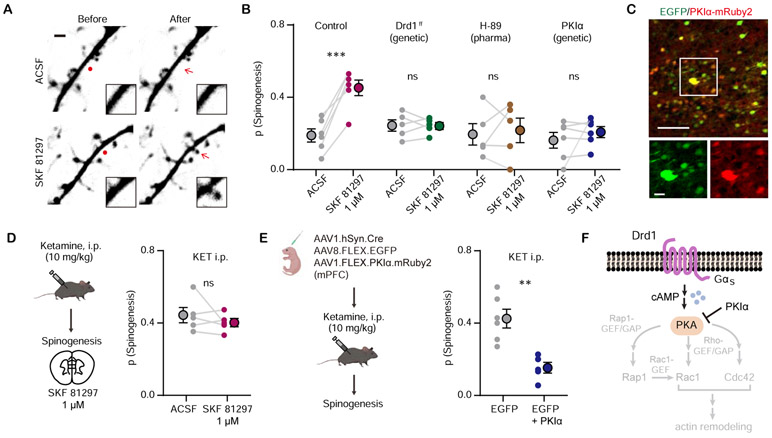
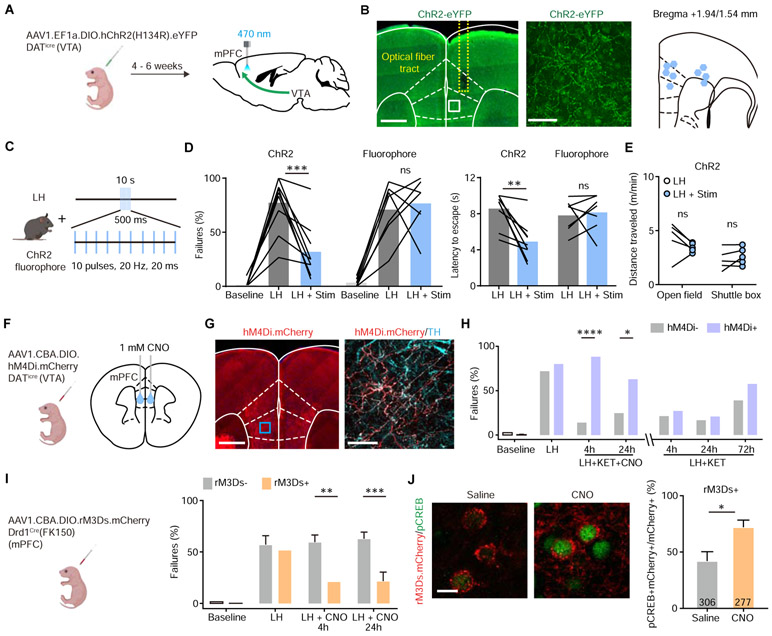
Results: We found that ketamine rapidly enhances glutamate-evoked spinogenesis in the medial prefrontal cortex, with timing that matches the onset of its behavioral efficacy and precedes changes in dendritic spine density. Ketamine increases evoked cortical spinogenesis through dopamine Drd1 receptor (Drd1) activation that requires dopamine release, compensating blunted plasticity in a learned helplessness paradigm. The enhancement in evoked spinogenesis after Drd1 activation or ketamine treatment depends on postsynaptic protein kinase A activity. Furthermore, ketamine's behavioral effects are blocked by chemogenetic inhibition of dopamine release and mimicked by activating presynaptic dopaminergic terminals or postsynaptic Gαs-coupled cascades in the medial prefrontal cortex.

Conclusions: Our findings highlight dopaminergic mediation of rapid enhancement in activity-dependent dendritic spinogenesis and behavioral effects induced by ketamine.

Keywords: 2-Photon glutamate uncaging; Dendritic spine; Dopamine; Ketamine; Medial prefrontal cortex; Spinogenesis.


Conflict of interest statement

The authors declare no biomedical financial interests or potential conflicts of interest. A part of this study, along with additional data, has been posted on bioRxiv: https://www.biorxiv.org/content/10.1101/2020.03.11.987818v2.full.

Figures

Figure 1.
Figure 1.. Ketamine regulates mPFC plasticity through a DA-dependent mechanism
(A). Schematic illustrating glutamate-evoked de novo spinogenesis platform. Top, viral transduction and an example EGFP+ pyramidal neuron in mPFC. Bottom, MNI-glutamate uncaging parameters for the induction of new dendritic spines. Scale bar, 50 μm. (B). Example 2PLSM images of successful and unsuccessful induction trials of de novo spinogenesis. Red circles, uncaging sites. Black rectangle, close up images of local dendritic segments before and after glutamate uncaging. Scale bar, 2 μm. (C). Left, schematic illustrating timecourse of ketamine treatments and experiments. Middle, timecourse of evoked spinogenesis probability on deep layer mPFC neurons in mice treated with either saline or ketamine (i.p. 10 mg/kg, acute slice preparation 2-72 hrs after treatment). Each small circle, aggregate probability of evoked spinogenesis from a single animal. Large circle, group data. n = 6 - 7 animals/time point, 15 - 25 trials/animal, one-way ANOVA, F (5, 35) = 9.895, p < 0.0001, Sidak’s multiple comparison test vs Saline, 2 hrs p = 0.076, 4 hrs, p < 0.0001, 12 hrs, p = 0.0532, 24/72 hrs, p > 0.9. Right, same as left but for dendritic spine density. n = 7 - 8 animals/time point, one-way ANOVA, F (5, 37) = 6.319, p = 0.0002, Sidak’s multiple comparison test vs Saline, 2/4 hrs p > 0.8, 12 hrs, p = 0.0056, 24 hrs, p = 0.0011, 72 hrs, p = 0.1271. Inset, normalized time course of changes in evoked spinogenesis (orange) and dendritic spine density (blue). (D). Left, viral transduction and percentage of Drd1a+Egfp+/Egfp+ cells in layer 5 mPFC. Right, probability of glutamate-evoked spinogenesis on deep layer mPFC neurons in mice treated with Saline, KET (10 mg/kg), KET + SKF 83566 (10 mg/kg), or SKF 83566 alone. Each small circle, aggregate probability of evoked spinogenesis from a single animal. Large circle, group data. One-way ANOVA, p < 0.0001, F (3, 16) = 20.29, Sidak’s multiple comparison test, Saline vs KET, p < 0.0001, KET vs KET + SKF83566, p = 0.0002, Saline vs SKF83566, p = 0.8574. (E). Left, schematic illustrating triple viral transduction strategy for evoked spinogenesis with DA neuron inhibition. Right, probability of spinogenesis on deep layer mPFC neurons in DATiCre+ and DATiCreG− animals treated with CNO (3 mg/kg) across conditions (baseline, KET). n = 4 animals/condition as shown in plots, two-way ANOVA, Sidak’s multiple comparison test, Cre− vs Cre+, CNO, p = 0.8686, CNO + KET, p = 0.0042. (F). Left, example confocal images of EGFP expression in dendrites of deep layer mPFC pyramidal neurons, in response to CNO and ketamine treatment, as noted. Scale, 2 μm. Right, same as (E) but for dendritic spine density. n = 5 - 6 animals/condition as shown in plots, two-way ANOVA, Sidak’s multiple comparison test, Cre− vs Cre+, CNO, p = 0.5005, CNO + KET, p < 0.0001. Scale bar, 2 μm. ** p < 0.01, *** p < 0.001 **** p < 0.0001. Error bars reflect SEM.
Figure 2.
Figure 2.. Ketamine rescues mPFC plasticity after stressful experience through Drd1 receptor
(A). Left, schematic illustrating glutamate-evoked spinogenesis assay in Baseline, LH, and LH + KET conditions. (B). Summary data showing the percentage of failures to escape an escapable aversive shock, one-way ANOVA, F (2, 18) = 20.26, p < 0.0001, Sidak’s multiple comparison test, Baseline vs LH, p < 0.0001, LH vs LH + KET, p = 0.0041. (C). Probability of glutamate-evoked spinogenesis on deep layer mPFC neurons in distinct stages of aversive learning (baseline, LH, LH + KET). n = 9 - 12 animals/condition as shown in plots, one-way ANOVA, F (2, 28) = 7.146, p = 0.0031, Sidak’s multiple comparison test, Baseline vs LH, p = 0.0496, LH vs LH + KET, p = 0.0016. (D). Left, schematic illustrating dual viral transduction strategy with sparse genetic manipulation of Drd1 receptor expression in Drd1ff mice. Middle, Fluorescence in situ hybridization (FISH) image confirming the absence of Drd1a mRNA expression (purple) in Egfp mRNA expressing mPFC cells (green) in Drd1ff mice. Inset, close up of a single neuron. Scale bar, 50 μm. Right, quantification of the percentage of Drd1a+ cells among Egfp+ cells in mPFC. 5% Drd1a+ and 95% Drd1a− among 151 Egfp+ cells from 2 animals. (E). Probability of glutamate-evoked spinogenesis on deep layer mPFC neurons in distinct stages of aversive learning (baseline, LH, LH + KET, LH + saline) in wild type and Drd1ff mice. Two-way ANOVA, Sidak’s multiple comparison test, WT vs Drd1ff, LH + KET, p = 0.0043, Baseline, LH and LH + Saline, p > 0.9, n = 5 animals. *p < 0.05, ** p < 0.01, *** p < 0.001 **** p < 0.0001. Error bars reflect SEM.
Figure 3.
Figure 3.. Drd1 activation promotes glutamate-induced spinogenesis in mPFC pyramidal neurons through PKA signaling
(A). Example 2PLSM images of de novo spinogenesis trials with ACSF or 1 μM SKF 81297. Red circles, uncaging sites. Black rectangle, close up images of local dendritic segments before and after glutamate uncaging. Scale bar, 2 μm. (B). Probability of glutamate-evoked spinogenesis on deep layer mPFC neurons in brain slices with or without bath application of 1 μM SKF 81297. Slices were treated with 10 μM H-89 or collected from mice with genetic manipulation of GFP expressing pyramidal neurons (Drd1ff or PKIα). Each small circle, aggregate probability of evoked spinogenesis from a single experiment. Large circles, group data. Paired two-tailed t test, ACSF vs SKF 81297, Control, p = 0.0007; Drd1ff, p = 0.9249; H-89, p = 0.7351; PKIα, p = 0.4; n = 5 – 6 experiments/group. (C). Top, colocalization of PKIα-mRuby2 in EGFP-expressing mPFC neurons. Bottom, close up images of EGFP and mRuby2 signals. Scale bar, 100 μm and 20 μm. (D). Left, schematic illustrating glutamate-evoked spinogenesis assay in slices from mice pre-treated with ketamine (10 mg/kg, i.p.). Bottom, probability of glutamate-evoked spinogenesis on deep layer mPFC neurons in brain slices with or without bath application of 1 μM SKF 81297. Paired two-tailed t test, ACSF vs SKF 81297, p = 0.3745. (E). Left, schematic illustrating triple viral transduction strategy for PKIα expression. Right, probability of glutamate-evoked spinogenesis in deep layer mPFC neurons in mice with or without PKIα expression, injected with ketamine (10 mg/kg, i.p.). Unpaired two-tailed t test, GFP vs GFP + PKIα, p = 0.0020. (F). Schematic of simplified signaling pathways downstream of Drd1-PKA involved in actin remodeling in dendritic spines. ** p < 0.01, *** p < 0.001. Error bars reflect SEM.
Figure 4.
Figure 4.. Activity of local DA terminals and Drd1+ neurons in mPFC mediates ketamine effects on behavior after stress
(A). Schematic for viral transduction with Cre-dependent ChR2 AAV in the VTA and subsequent optogenetic fiber implant in mPFC. (B). Left, fiber placement illustration on a coronal section through mPFC, with a close up image of ChR2.eYFP terminals (white dashed lines, Paxinos atlas overlay; yellow dashed lines, fiber track). Green, immunoenhanced ChR2.eYFP; blue, Hoechst nucleic stain. Scale bars: 500 μm and 50 μm. Right, atlas location of fiber placement for each subject. (C). Schematic illustrating open loop optogenetic stimulation parameters (Stim, optogenetic stimulation). (D). Left, summary data showing the percentage of failures to escape an escapable aversive shock in ChR2-expressing mice (n = 9) and fluorophore-expressing controls (n = 7) across phases of learning, Baseline, LH, and LH + Stim. Right, summary data for latency to escape in LH compared with LH + Stim conditions. Repeated measures two-way ANOVA, Sidak’s multiple comparison test, LH vs LH + Stim, ChR2, p = 0.0002, Fluorophore, p = 0.9358. Latency to escape, LH vs LH + Stim, ChR2, p = 0.0014, Fluorophore, p = 0.9248. (E). Left, locomotion in the open field and shuttle box (m/min) after learning with and without optogenetic stimulation. Repeated measures two-way ANOVA, Sidak’s multiple comparison test, open field, p = 0.1742, shuttle box, p = 0.7503, n = 5 mice. (F). Left, schematic illustrating viral transduction strategy. Right, local CNO infusion in mPFC (1 mM, 1 μl). (G). Left, immunoenhanced image of hM4Di.mCherry+ DAT+ terminals in mPFC. Right, mCherry+ terminals colocalize with a subset of tyrosine hydroxylase (TH) expressing axons. Scale bars, 500 μm and 50 μm. (H). Summary data showing the percentage of failures to escape an escapable aversive shock across learning and treatment conditions for hM4Di-expressing DATiCre positive and negative littermates. n = 5 animals for Cre−, 8 animals for Cre+, two-way ANOVA, Sidak’s multiple comparison test. KET + CNO 4 hrs, p < 0.0001, KET + CNO 24 hrs, p = 0.0476, KET + only 4, 24, and 72 hrs, p > 0.7. (I). Left, schematic illustrating viral transduction strategy. Right, Summary data showing the percentage of failures to escape an escapable aversive shock in Drd1-Cre+ and Drd1-Cre− mice expressing rM3Ds across phases of learning and after CNO treatment (Baseline, LH, LH + CNO 4 hrs, and LH + CNO 24 hrs). n = 8 - 10 animals/condition, two-way ANOVA, Sidak’s multiple comparison test, Cre+ vs Cre−, LH + CNO 4 hrs, p = 0.0018, LH + CNO 24 hrs, p = 0.0007, Baseline/LH, p > 0.9. (J). Left, colocalization of pCREB immunolabeling and rM3Ds.mCherry expression in mPFC after Saline/CNO treatment in Drd1 Cre+ mice. Right, the quantification of percentage of pCREB+ cells among mCherry+ cells. Scale bar, 20 μm. n = 3 animals/condition cell number as noted in each bar, two-tailed unpaired t-test, p = 0.0455. *p < 0.05, ** p < 0.01, *** p < 0.001, **** p < 0.0001. Error bars reflect SEM.

Comment in

Similar articles

Cited by

References

    1. Daly EJ, Singh JB, Fedgchin M, Cooper K, Lim P, Shelton RC, et al. (2018): Efficacy and safety of intranasal esketamine adjunctive to oral antidepressant therapy in treatment-resistant depression: A randomized clinical trial. JAMA Psychiatry 75: 139–148. - PMC - PubMed
    1. Berman RM, Cappiello A, Anand A, Oren DA, Heninger GR, Charney DS, Krystal JH (2000): Antidepressant effects of ketamine in depressed patients. Biol Psychiatry 47: 351–354. - PubMed
    1. Kim J, Farchione T, Potter A, Chen Q, Temple R (2019): Esketamine for Treatment-Resistant Depression — First FDA-Approved Antidepressant in a New Class. N Engl J Med 381: 1–4. - PubMed
    1. Duman RS (2018): Ketamine and rapid-acting antidepressants: a new era in the battle against depression and suicide. F1000Research 7: 659. - PMC - PubMed
    1. Zanos P, Gould TD (2018): Mechanisms of ketamine action as an antidepressant. Mol Psychiatry 23: 801–811. - PMC - PubMed

Publication types

LinkOut - more resources