. 2021 Feb 26;7(9):eabe3348.
doi: 10.1126/sciadv.abe3348. Print 2021 Feb.

Tumor-specific cytolytic CD4 T cells mediate immunity against human cancer

Affiliations

Tumor-specific cytolytic CD4 T cells mediate immunity against human cancer

Amélie Cachot et al. Sci Adv. .

Abstract

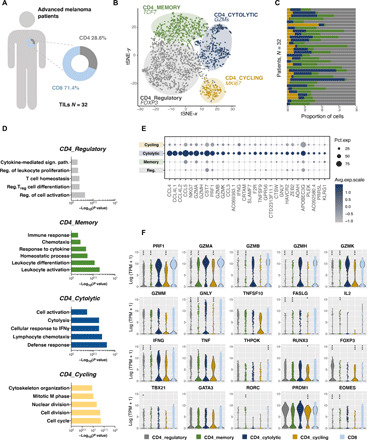
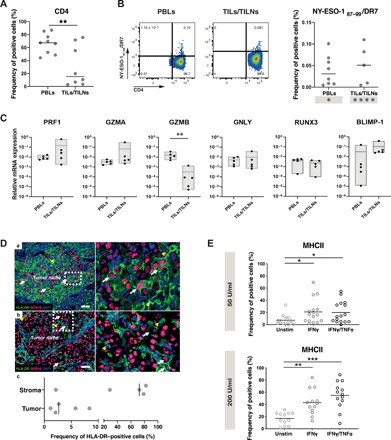
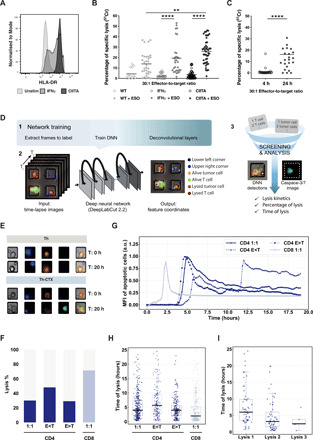
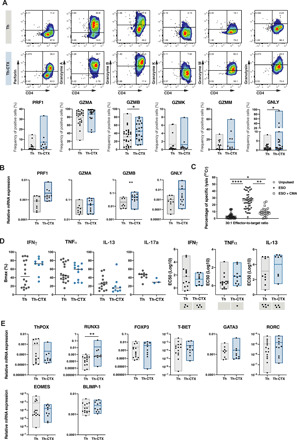
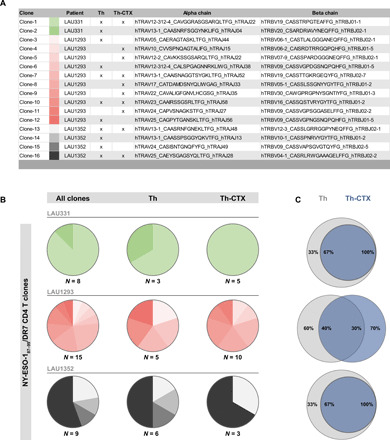
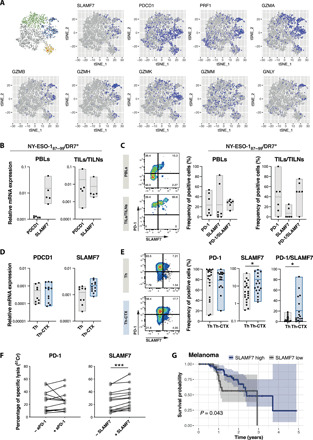
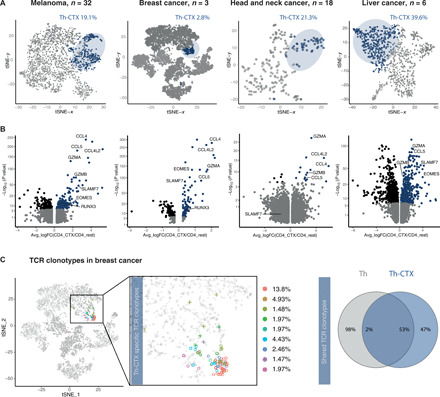
CD4 T cells have been implicated in cancer immunity for their helper functions. Moreover, their direct cytotoxic potential has been shown in some patients with cancer. Here, by mining single-cell RNA-seq datasets, we identified CD4 T cell clusters displaying cytotoxic phenotypes in different human cancers, resembling CD8 T cell profiles. Using the peptide-MHCII-multimer technology, we confirmed ex vivo the presence of cytolytic tumor-specific CD4 T cells. We performed an integrated phenotypic and functional characterization of these cells, down to the single-cell level, through a high-throughput nanobiochip consisting of massive arrays of picowells and machine learning. We demonstrated a direct, contact-, and granzyme-dependent cytotoxic activity against tumors, with delayed kinetics compared to classical cytotoxic lymphocytes. Last, we found that this cytotoxic activity was in part dependent on SLAMF7. Agonistic engagement of SLAMF7 enhanced cytotoxicity of tumor-specific CD4 T cells, suggesting that targeting these cells might prove synergistic with other cancer immunotherapies.


Figures

Fig. 1
Fig. 1. The transcriptomic signature of tumor-infiltrating cytolytic CD4 T cell from patients with melanoma.
(A) Frequency of CD4 and CD8 TIL among all CD3+ T cells collected from 32 patients with melanoma. (B) t-distributed stochastic neighbor embedding (tSNE) two-dimensional (2D) plot of scRNA-seq data representing all CD3+CD4+CD8 T cells. Colors correspond to the four clusters discriminating the cytolytic (blue, n = 445), memory (green, n = 599), cycling (yellow, n = 180), and regulatory (gray, n = 1109) subsets. (C) The relative CD4 cluster abundance within the CD3+CD4+CD8 T cells in each patient. (D) GO-based analysis illustrating enrichment of pathways observed in each of the four distinct CD4 clusters. (E) Bubble plot of the top 30 up-regulated genes in the CD4_Cytolytic cluster. (F) Violin plots showing the distribution of gene expression levels for selected cytolysis related and master transcription factor genes across the four CD4 T cell clusters (regulatory in gray, memory in green, cytolytic in blue, and cycling in yellow) as compared to tumor-infiltrating CD8 T cells (in light blue). Statistical power was assessed using Wilcoxon test for violin plot graphs.
Fig. 2
Fig. 2. Direct ex vivo detection of tumor-specific cytolytic CD4 T cells in patients with melanoma.
(A) Ex vivo frequency of CD4 T cells among PBLs and TILs/TILNs in patients with melanoma. (B) Representative examples (left) and summarizing graphs (right) of ex vivo pMHCII multimer staining of CD4 T cells specific for NY-ESO-187–99/DR7 obtained in PBL and TIL/TILN of HLA-DR7+ patient samples. (C) Quantitative reverse transcription PCR (RT-PCR) analysis of the indicated transcripts in ex vivo sorted NY-ESO-187–99/DR7 CD4 T cells isolated either from spell peripheral blood (PB) or TILs/TILNs. (D) Multispectral imaging assessment of MHCII expression directly in situ on 18 metastatic melanoma tissues. Representative examples of two cases (a) with expression of HLA-DR quantified to 5.8% of tumor cells within the SOX-10+ tumor niche (white arrows) and (b) lower expression of HLA-DR in 2.07% of the SOX-10+ tumor cells (white arrows). Stromal cells expressed HLA-DR, pointed by yellow arrowheads. The insets illustrate high-power images. The MSI were acquired using a 20× objective of the Vectra 3.0 imaging system. Scale bar, 50 μm. (c) Graph of frequency of HLA-DR–positive cells expressed in percentages, in the tumor SOX-10+ classified tissue category versus the stroma. DAPI, 4′,6-diamidino-2-phenylindole. (E) In vitro MHC II expression by 16 tumor cell lines after IFNγ and TNFα treatment. Statistical power was assessed using unpaired t test (A) and Kruskal-Wallis test (E).
Fig. 3
Fig. 3. Delayed but direct cytolytic capacity of NY-ESO-187–99/DR7 CD4 T cells against melanoma lines.
(A) Representative histogram of MHCII expression of a WT (light gray), IFN𝛾-treated (dark gray), and CIITA-transduced (black) tumor cell lines. FMO is shown as dashed line. (B) Cumulative analysis of 51Chromium release assays conducted with tumor cell lines transduced with CIITA, IFN𝛾 treated, or unmanipulated, pulsed or not with a specific peptide, and coincubated with PB (peripheral blood)–derived CD4 T cell clones. (C) Summary of the specific lysis obtained using a tumor cell line endogenously expressing NY-ESO-1 cocultured with PB-derived NY-ESO-187–99/DR7–specific CD4 T cell clones. Statistics were performed using nonparametric unpaired Kruskal-Wallis test (B) and matched-pairs signed-rank test (C). P values of <0.05 were considered statistically significant. (D) Single-cell tumor recognition assay using time-lapse imaging microscopy in picowell grids: Schematic illustration of the data analysis with deep learning approaches including the network training (1), video analysis for features extraction (2), and data screening and MFI analysis. DNN, deep neural network. (E to H) Fluorescently labeled CIITA–transduced tumor cell line pulsed with a specific peptide was cocultured with PB-derived NY-ESO-187–99/DR7 CD4 T cells in a PDMS picowell array. (E) Representative time series data at 0 and 20 hours of an enlarged view of two picowells showing CD4 T cells (blue), tumor cells (red), and the caspase-3/7 pathway reagent identifying cells undergoing apoptosis (green). (F) Cumulative analysis of average percentage of specific lysis, (G) real-time dynamic MFI of the tumor apoptosis, (H) the time of the lysis defined at a single cell level, and (I) time of the consecutive lytic events in wells with target cells outnumbering T cells. PB-derived NY-ESO-1157–165 /A2 CD8 T cells were used as positive control. a.u., arbitrary units.
Fig. 4
Fig. 4. The release of cytolytic molecules is mainly responsible for the cytolytic potential of tumor-specific CD4 T cells.
PB-derived NY-ESO-187–99/DR7–specific CD4 T cell clones were discriminated as Th or Th-CTX based on results obtained with a standard 4-hour 51Chromium release assay. (A) Representative example (top) and cumulative analysis (bottom) of the production of perforin (PRF1), granzymes (GZMA, GZMB, GZMK, and GZMM), and granulysin (GNLY) by NY-ESO-187–99/DR7–specific CD4 T cell clones. (B) Quantitative RT-PCR (qRT-PCR) analysis of the indicated transcripts in PB-derived NY-ESO-187–99/DR7 CD4 T cell clones. (C) Standard 4-hour 51Chromium release assay was conducted with a CIITA-transduced tumor cell line pulsed or not with a specific peptide. Release of perforin was blocked by a 2-hour pretreatment of antigen-specific CD4 T cells with CMA (100 nM). Results are expressed as percentage of specific lysis of the target cells at 30:1 E:T ratio. Statistics were performed using nonparametric unpaired Kruskal-Wallis test. (D) Average dose-response curves and Bmax (maximal response), EC50 values of IFNγ, TNFα, IL-13, and IL-17a induced by titrated concentrations of NY-ESO-187–99 peptide by PB-derived NY-ESO-187–99/DR7–specific CD4 T cell clones. (E) Quantitative RT-PCR analysis of the indicated transcripts in PB-derived NY-ESO-187–99/DR7 CD4 T cell clones. All statistics for RT-PCR data were performed using two-way analysis of variance (ANOVA) with Sidak’s post hoc test.
Fig. 5
Fig. 5. TCR repertoires of Th and Th-CTX CD4 T cells are polyclonal.
PB-derived NY-ESO-187–99/DR7–specific CD4 T cell clones were discriminated as Th or Th-CTX based on results obtained with a standard 4-hour 51Chromium release assay. (A) Table listing the diverse clonotypes found in PB-derived NY-ESO-187–99/DR7 CD4 T cell clones from three patients with melanoma (LAU331, n = 8 clones; LAU1293, n = 15 clones; LAU1352, n = 9 clones). (B) Pies illustrating the relative abundance of each clonotypes as a whole (left), within Th (middle), or Th-CTX (right) clones. (C) Venn diagrams showing the distribution of unique and shared clonotypes frequencies between Th (gray) or Th-CTX (blue) clones.
Fig. 6
Fig. 6. SLAMF7 as potential candidate to increase cytolytic potential of tumor-specific CD4 T cells.
(A) tSNE 2D plot of scRNA-seq data representing the four CD4+ T cell clusters discriminating the cytolytic (blue), memory (green), cycling (yellow), and regulatory (gray) subsets and their expression of selected genes (SLAMF7, PDCD1, PRF1, GZMA, GZMB, GZMH, GZMK, GZMM, and granulysin). (B) Quantitative RT-PCR analysis of the indicated transcripts in ex vivo–sorted NY-ESO-187–99/DR7 CD4 T cells from either PB or TILs/TILNs. (C) Representative examples and cumulative analysis of direct ex vivo NY-ESO-187–99/DR7 CD4 T cell multimer staining combined with the evaluation of SLAMF7 and PD-1 expression of either PB or TILs/TILNs from patients with melanoma. (D) qRT-PCR analysis of the indicated transcripts in PB-derived NY-ESO-187–99/DR7 CD4 T cell clones discriminated as Th or Th-CTX. (E) Representative examples and cumulative analysis of SLAMF7 and PD-1 expression in PB-derived NY-ESO-187–99/DR7 CD4 T cell Th and-Th-CTX clones. (F) Standard 4-hour 51Chromium release assay, conducted with target tumor cell lines transduced with CIITA pulsed with the specific peptide in the presence or absence of Nivolumab (10 μg/ml) (left) or agonistic anti-SLAMF7 antibody (5 μg/ml) (right) and coincubated with antigen-specific CD4 T cell clones. Results are expressed as percentage of specific lysis of the target cells at 30:1 E:T ratios. (G) Kaplan-Meier plot depicting the survival probability and 95% confidence interval over time (years) for melanoma patients with high (blue) and low (black) SLAMF7 expression (data originated from TCGA). The difference between the two survival curves was assessed using a log-rank test. Statistics were performed using two-way ANOVA with Sidak’s post hoc test (B to D), nonparametric Mann-Whitney test (E), and Wilcoxon test (F).
Fig. 7
Fig. 7. Distribution of cytolytic CD4 T cells across cancer types and their relatedness to other T helper clusters.
(A) tSNE 2D plot of scRNA-seq data representing the CD4+ T cell clusters discriminating the cytolytic (dark blue) and noncytolytic (gray) subsets across patients with melanoma, BC, head and neck cancer, and hepatocellular carcinoma. (B) Volcano plot analysis of gene expression changes in melanoma, BC, head and neck cancer, and hepatocellular carcinoma patients from Th-CTX compared to other Th clusters. Statistical power was assessed using Wilcoxon test [gray, P ≥ 0.01; blue, log fold change (logFC) > 0.25 and P < 0.01; black, logFC ≤ 0.25 and P < 0.01]. (C) 2D tSNE of scRNA-seq data representing the most abundant TCR clonotypes identified in the CD4_Cytolytic cluster in patients with BC, their relative abundance (left), and Venn diagram showing the distribution of unique and overlapping TCR sequences and their relative abundance across Th-CTX and non–Th-CTX (right).

Similar articles

Cited by

References

    1. Sallusto F., Lanzavecchia A., Heterogeneity of CD4+ memory T cells: Functional modules for tailored immunity. Eur. J. Immunol. 39, 2076–2082 (2009). - PubMed
    1. Hunder N. N., Wallen H., Cao J., Hendricks D. W., Reilly J. Z., Rodmyre R., Jungbluth A., Gnjatic S., Thompson J. A., Yee C., Treatment of metastatic melanoma with autologous CD4+ T cells against NY-ESO-1. N. Engl. J. Med. 358, 2698–2703 (2008). - PMC - PubMed
    1. Tran E., Turcotte S., Gros A., Robbins P. F., Lu Y. C., Dudley M. E., Wunderlich J. R., Somerville R. P., Hogan K., Hinrichs C. S., Parkhurst M. R., Yang J. C., Rosenberg S. A., Cancer immunotherapy based on mutation-specific CD4+ T cells in a patient with epithelial cancer. Science 344, 641–645 (2014). - PMC - PubMed
    1. Fridman W. H., Pagès F., Sautès-Fridman C., Galon J., The immune contexture in human tumours: Impact on clinical outcome. Nat. Rev. Cancer 12, 298–306 (2012). - PubMed
    1. Tran E., Ahmadzadeh M., Lu Y. C., Gros A., Turcotte S., Robbins P. F., Gartner J. J., Zheng Z., Li Y. F., Ray S., Wunderlich J. R., Somerville R. P., Rosenberg S. A., Immunogenicity of somatic mutations in human gastrointestinal cancers. Science 350, 1387–1390 (2015). - PMC - PubMed

Publication types