Observational Study
. 2021 Feb 26;6(56):eabb7221.
doi: 10.1126/sciimmunol.abb7221.

Human airway mast cells proliferate and acquire distinct inflammation-driven phenotypes during type 2 inflammation

Affiliations
Observational Study

Human airway mast cells proliferate and acquire distinct inflammation-driven phenotypes during type 2 inflammation

Daniel F Dwyer et al. Sci Immunol. .

Abstract

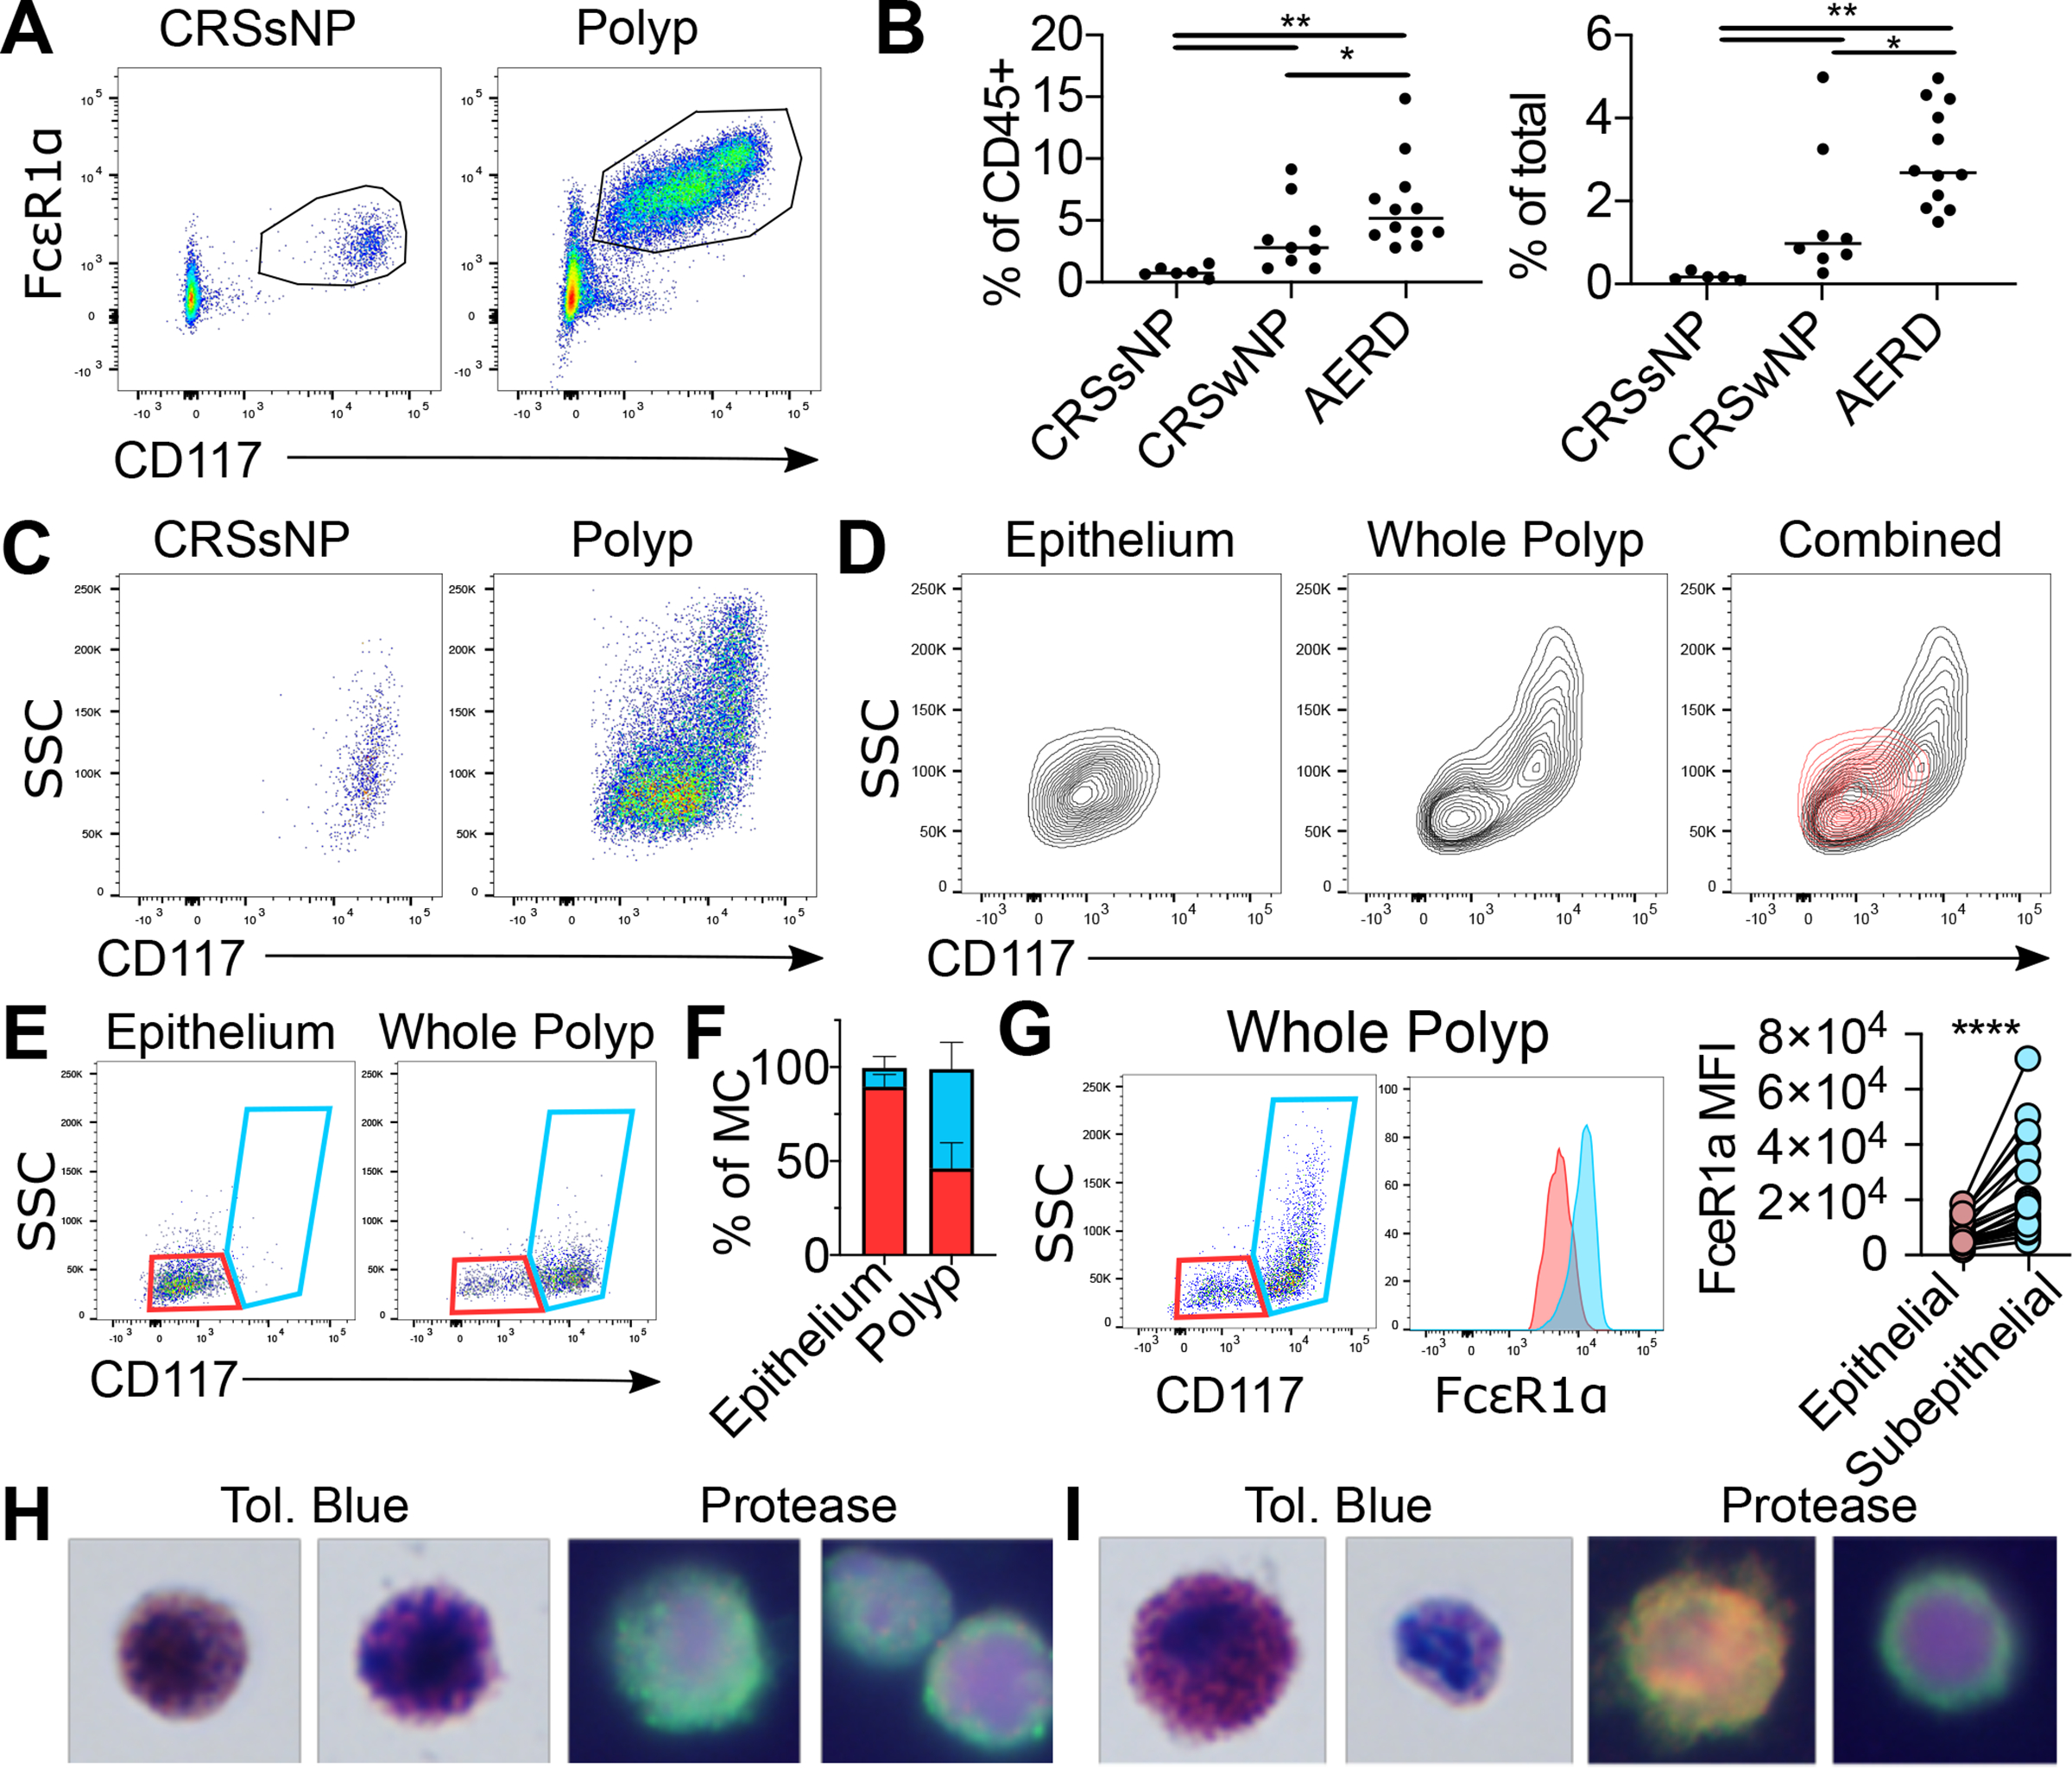
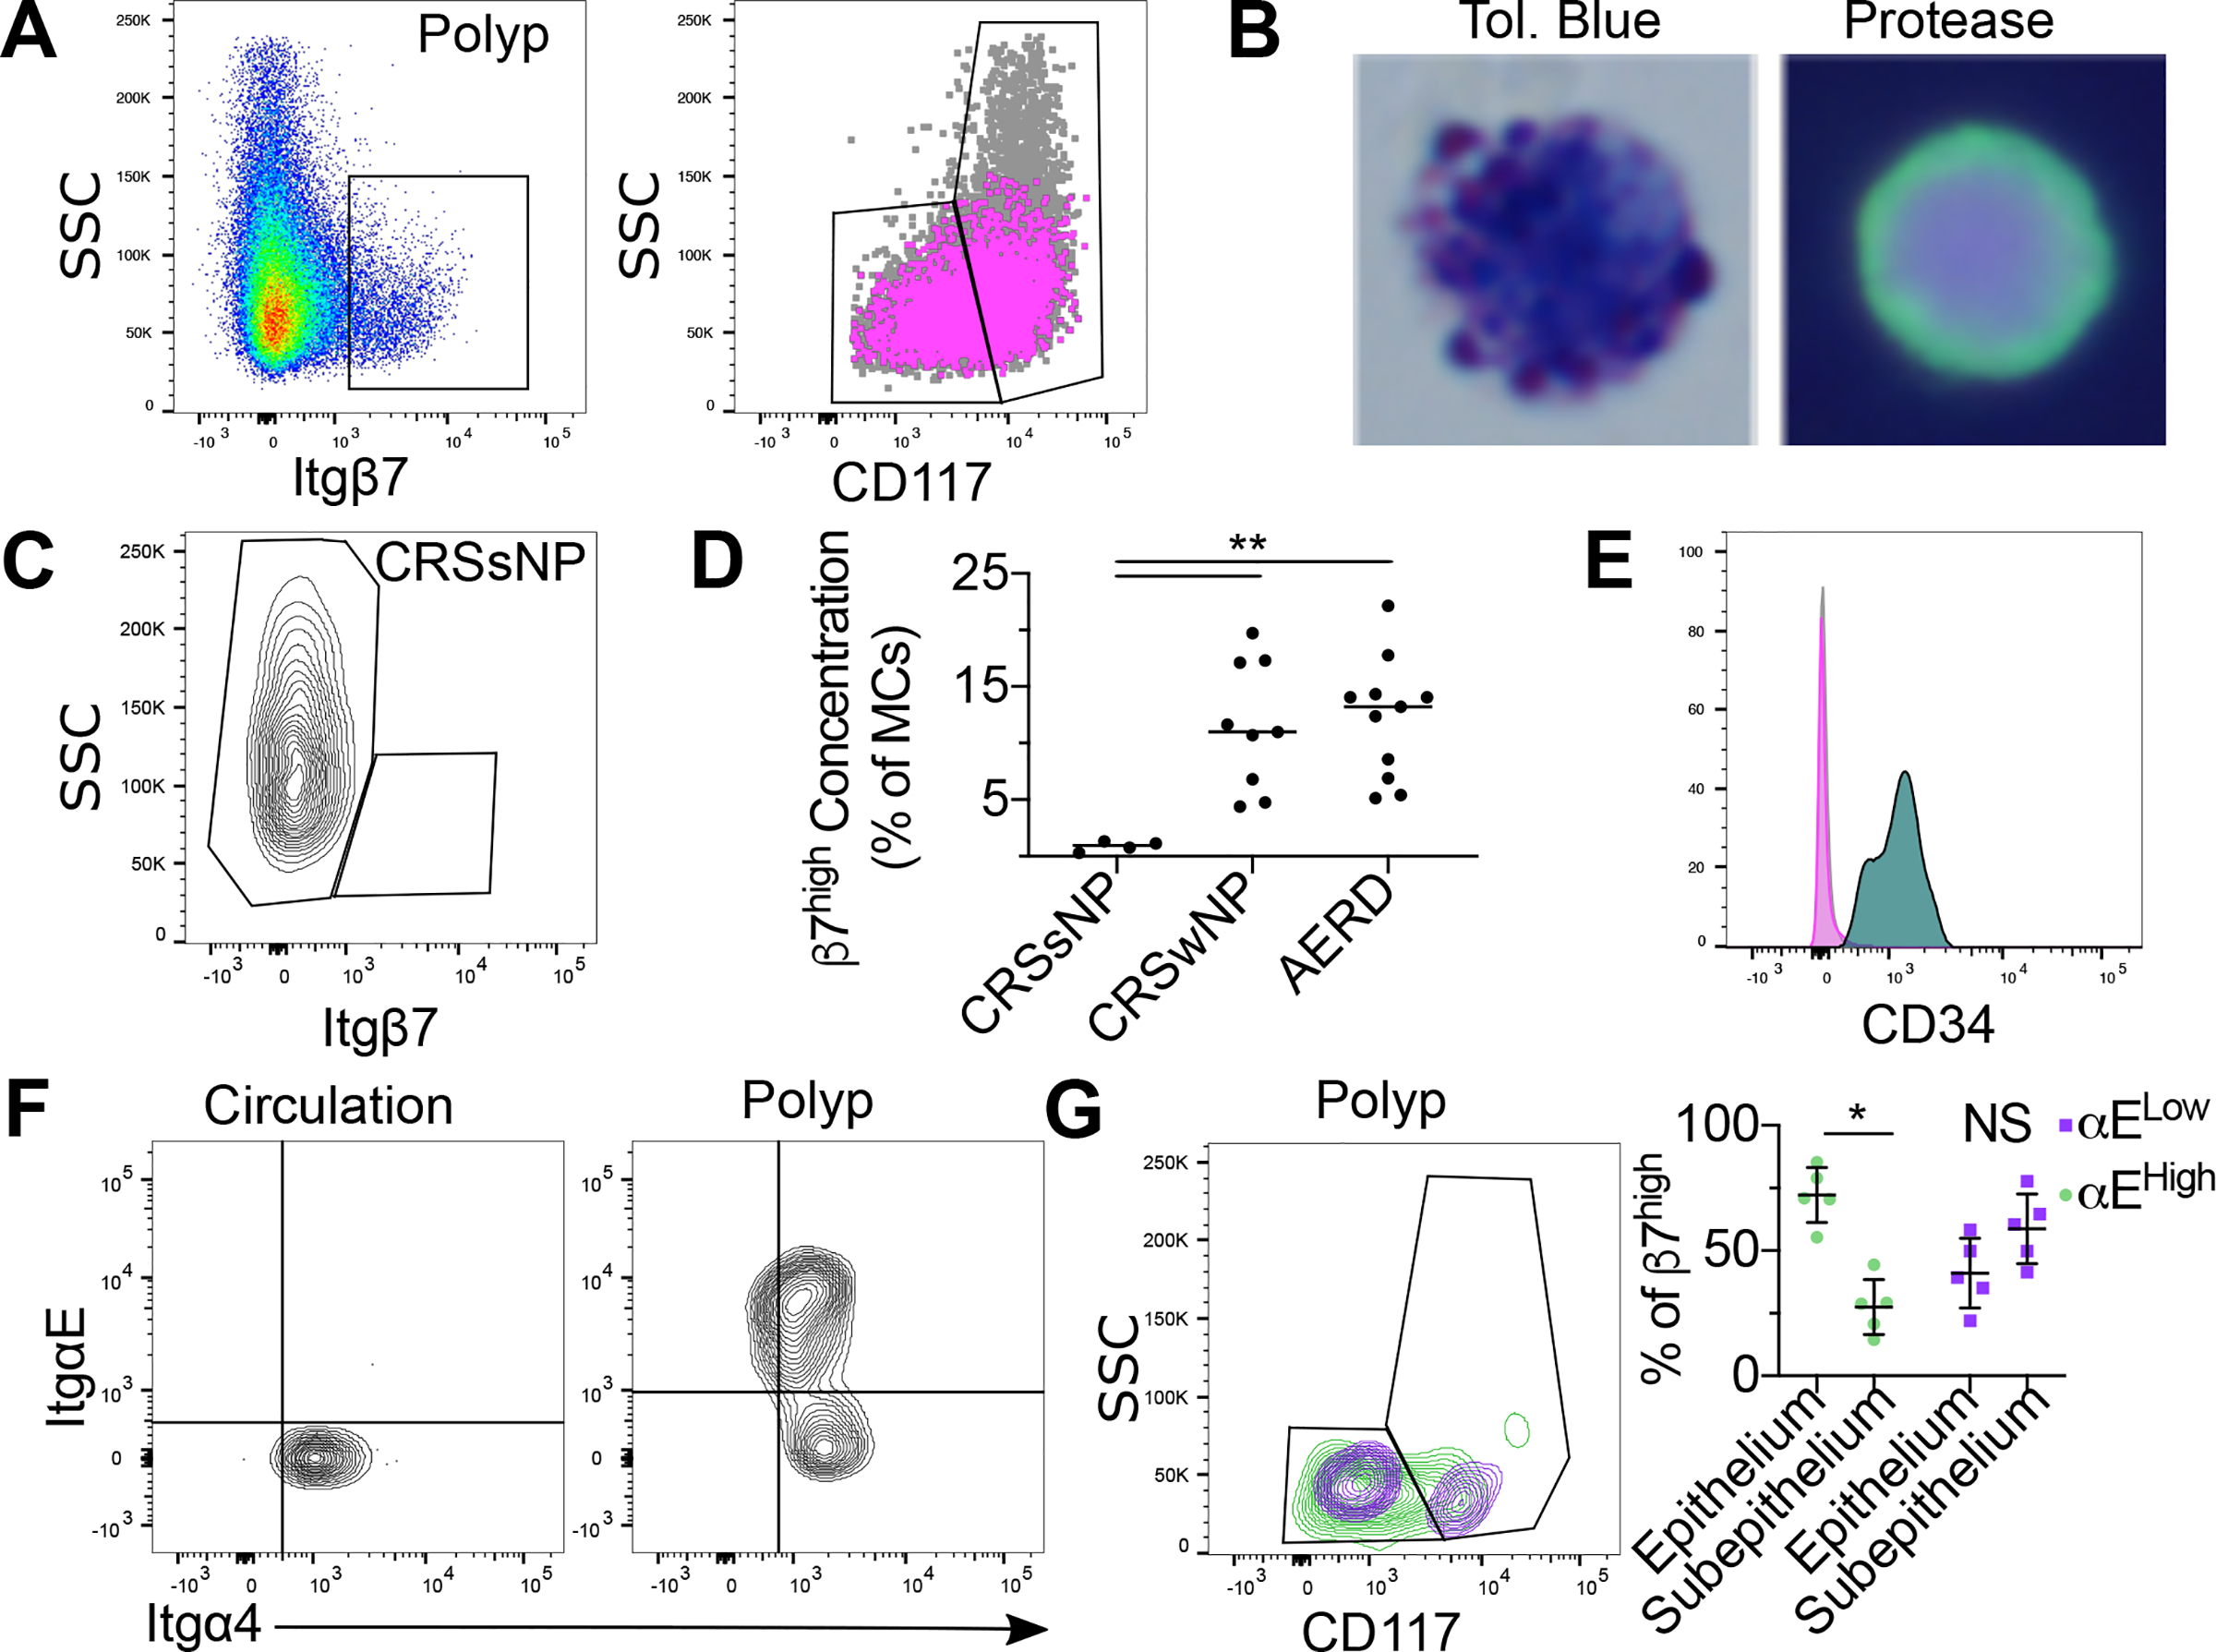
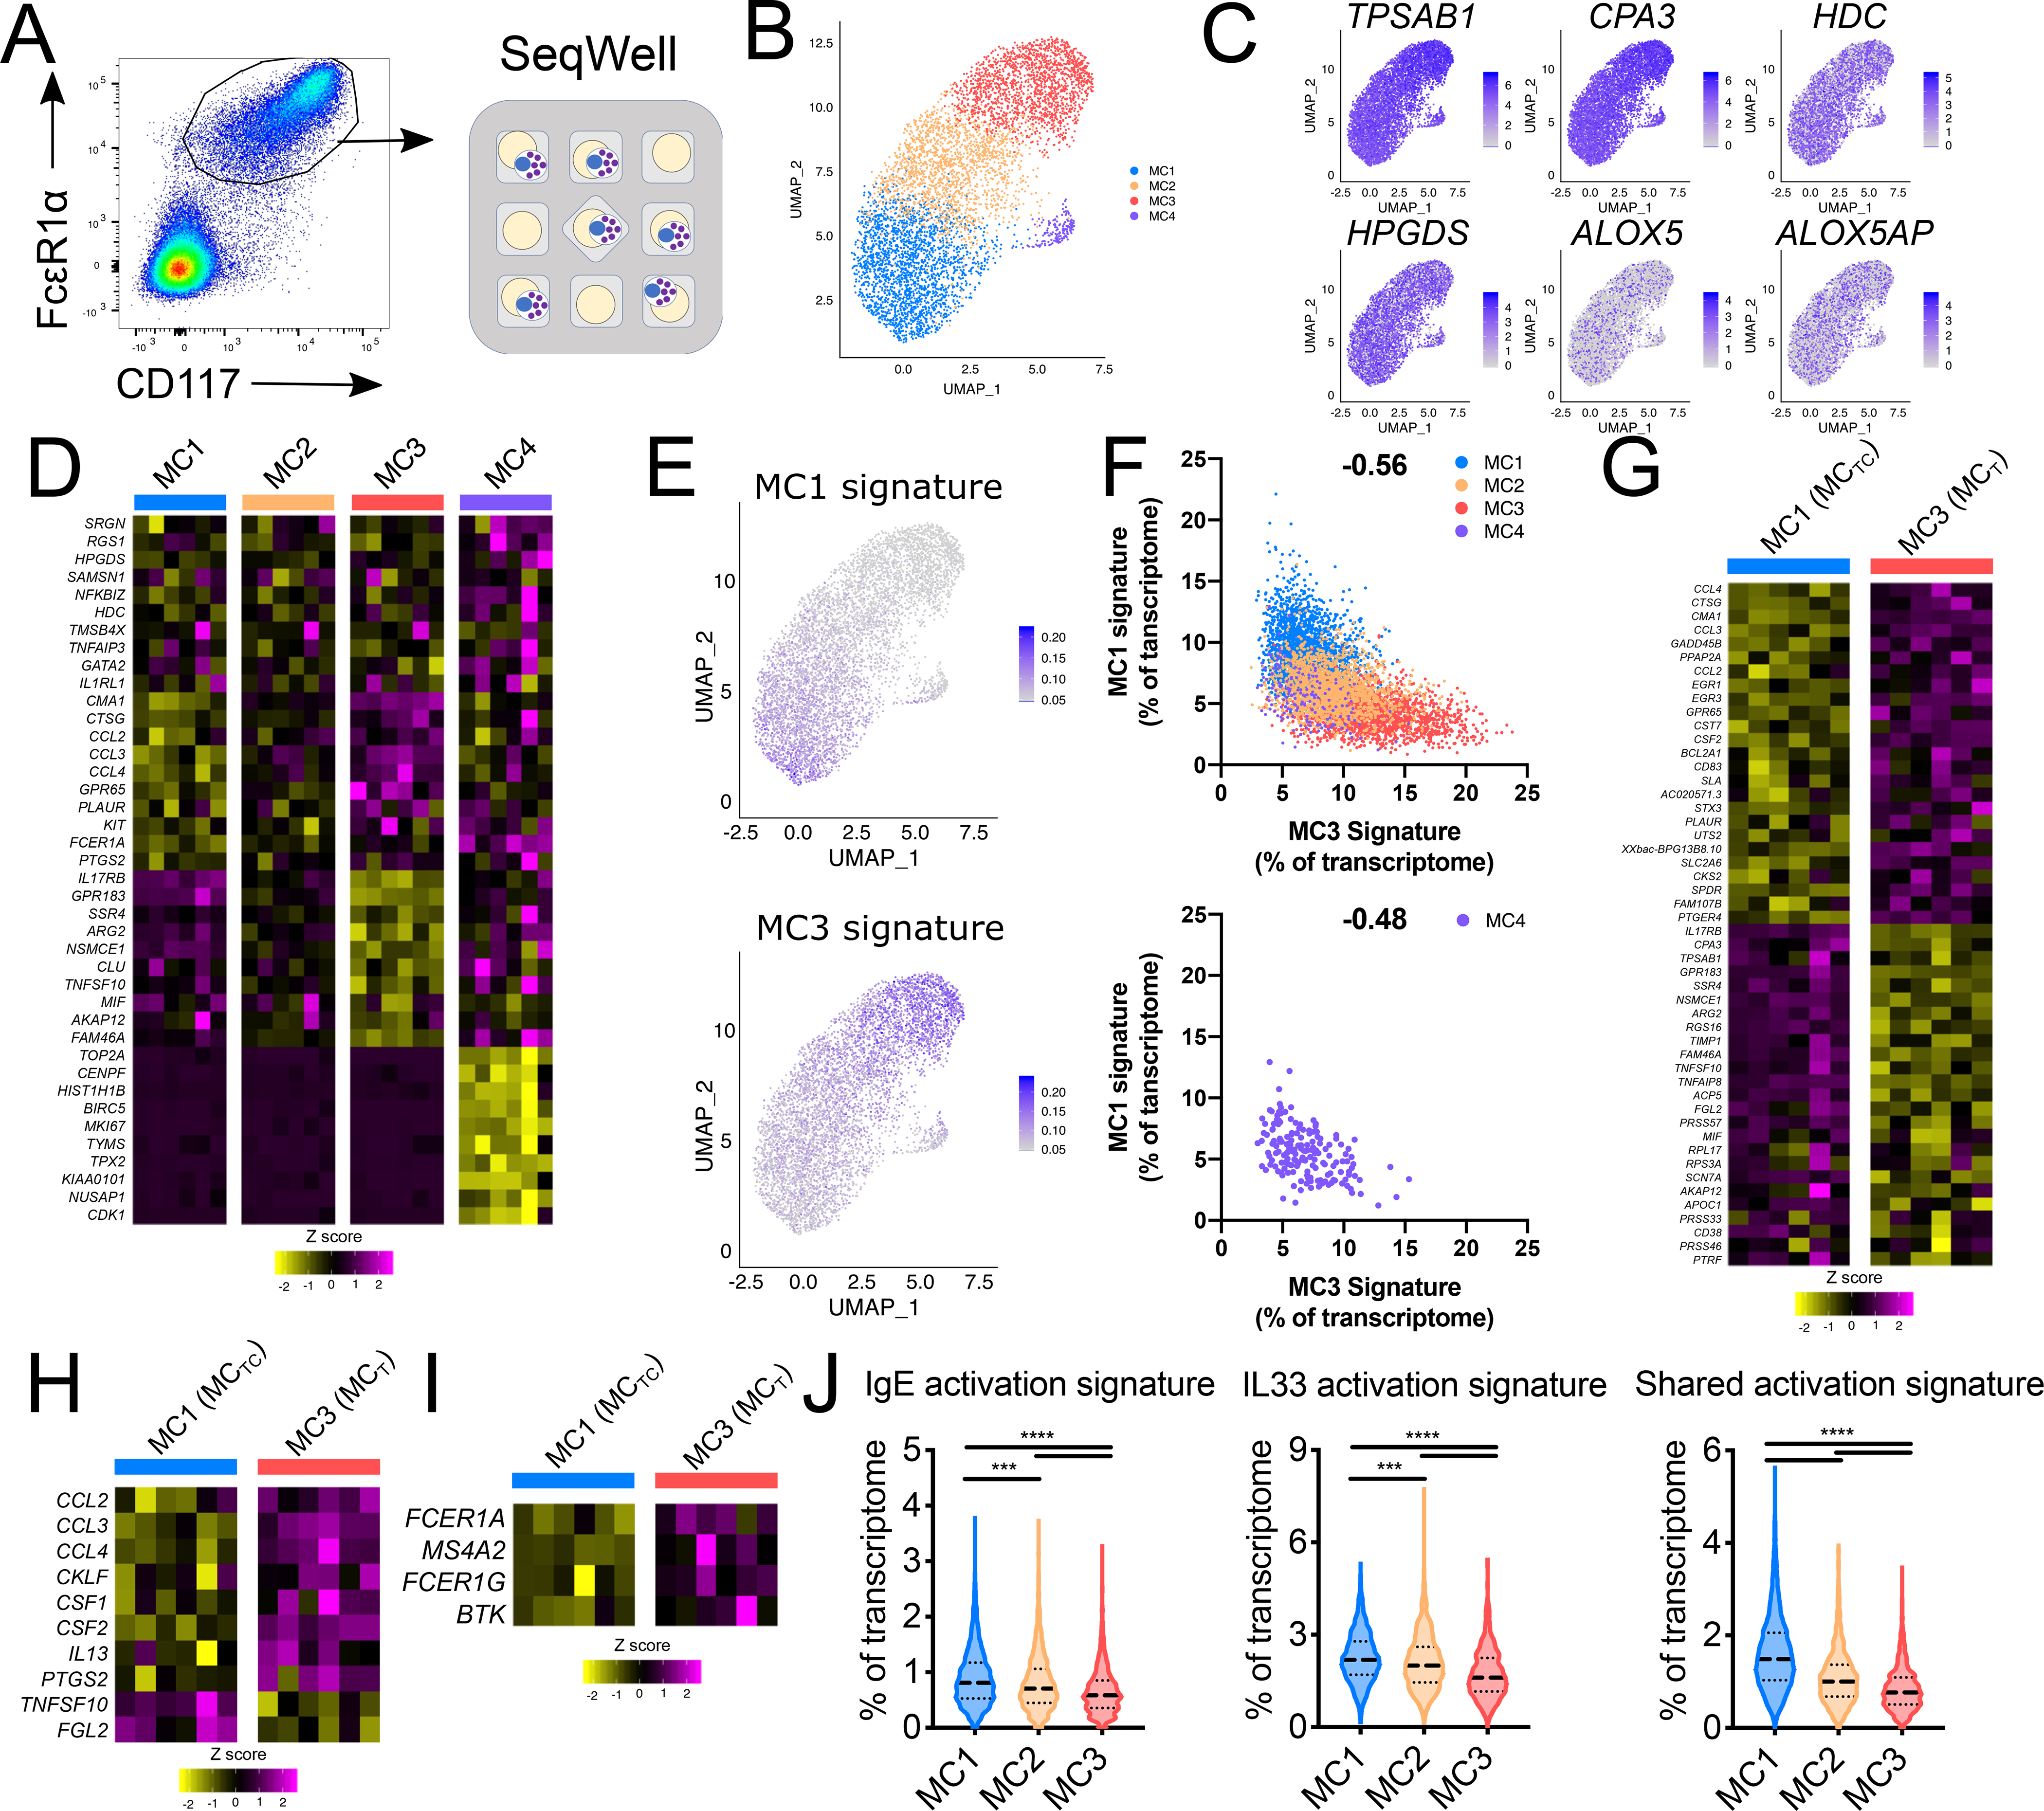
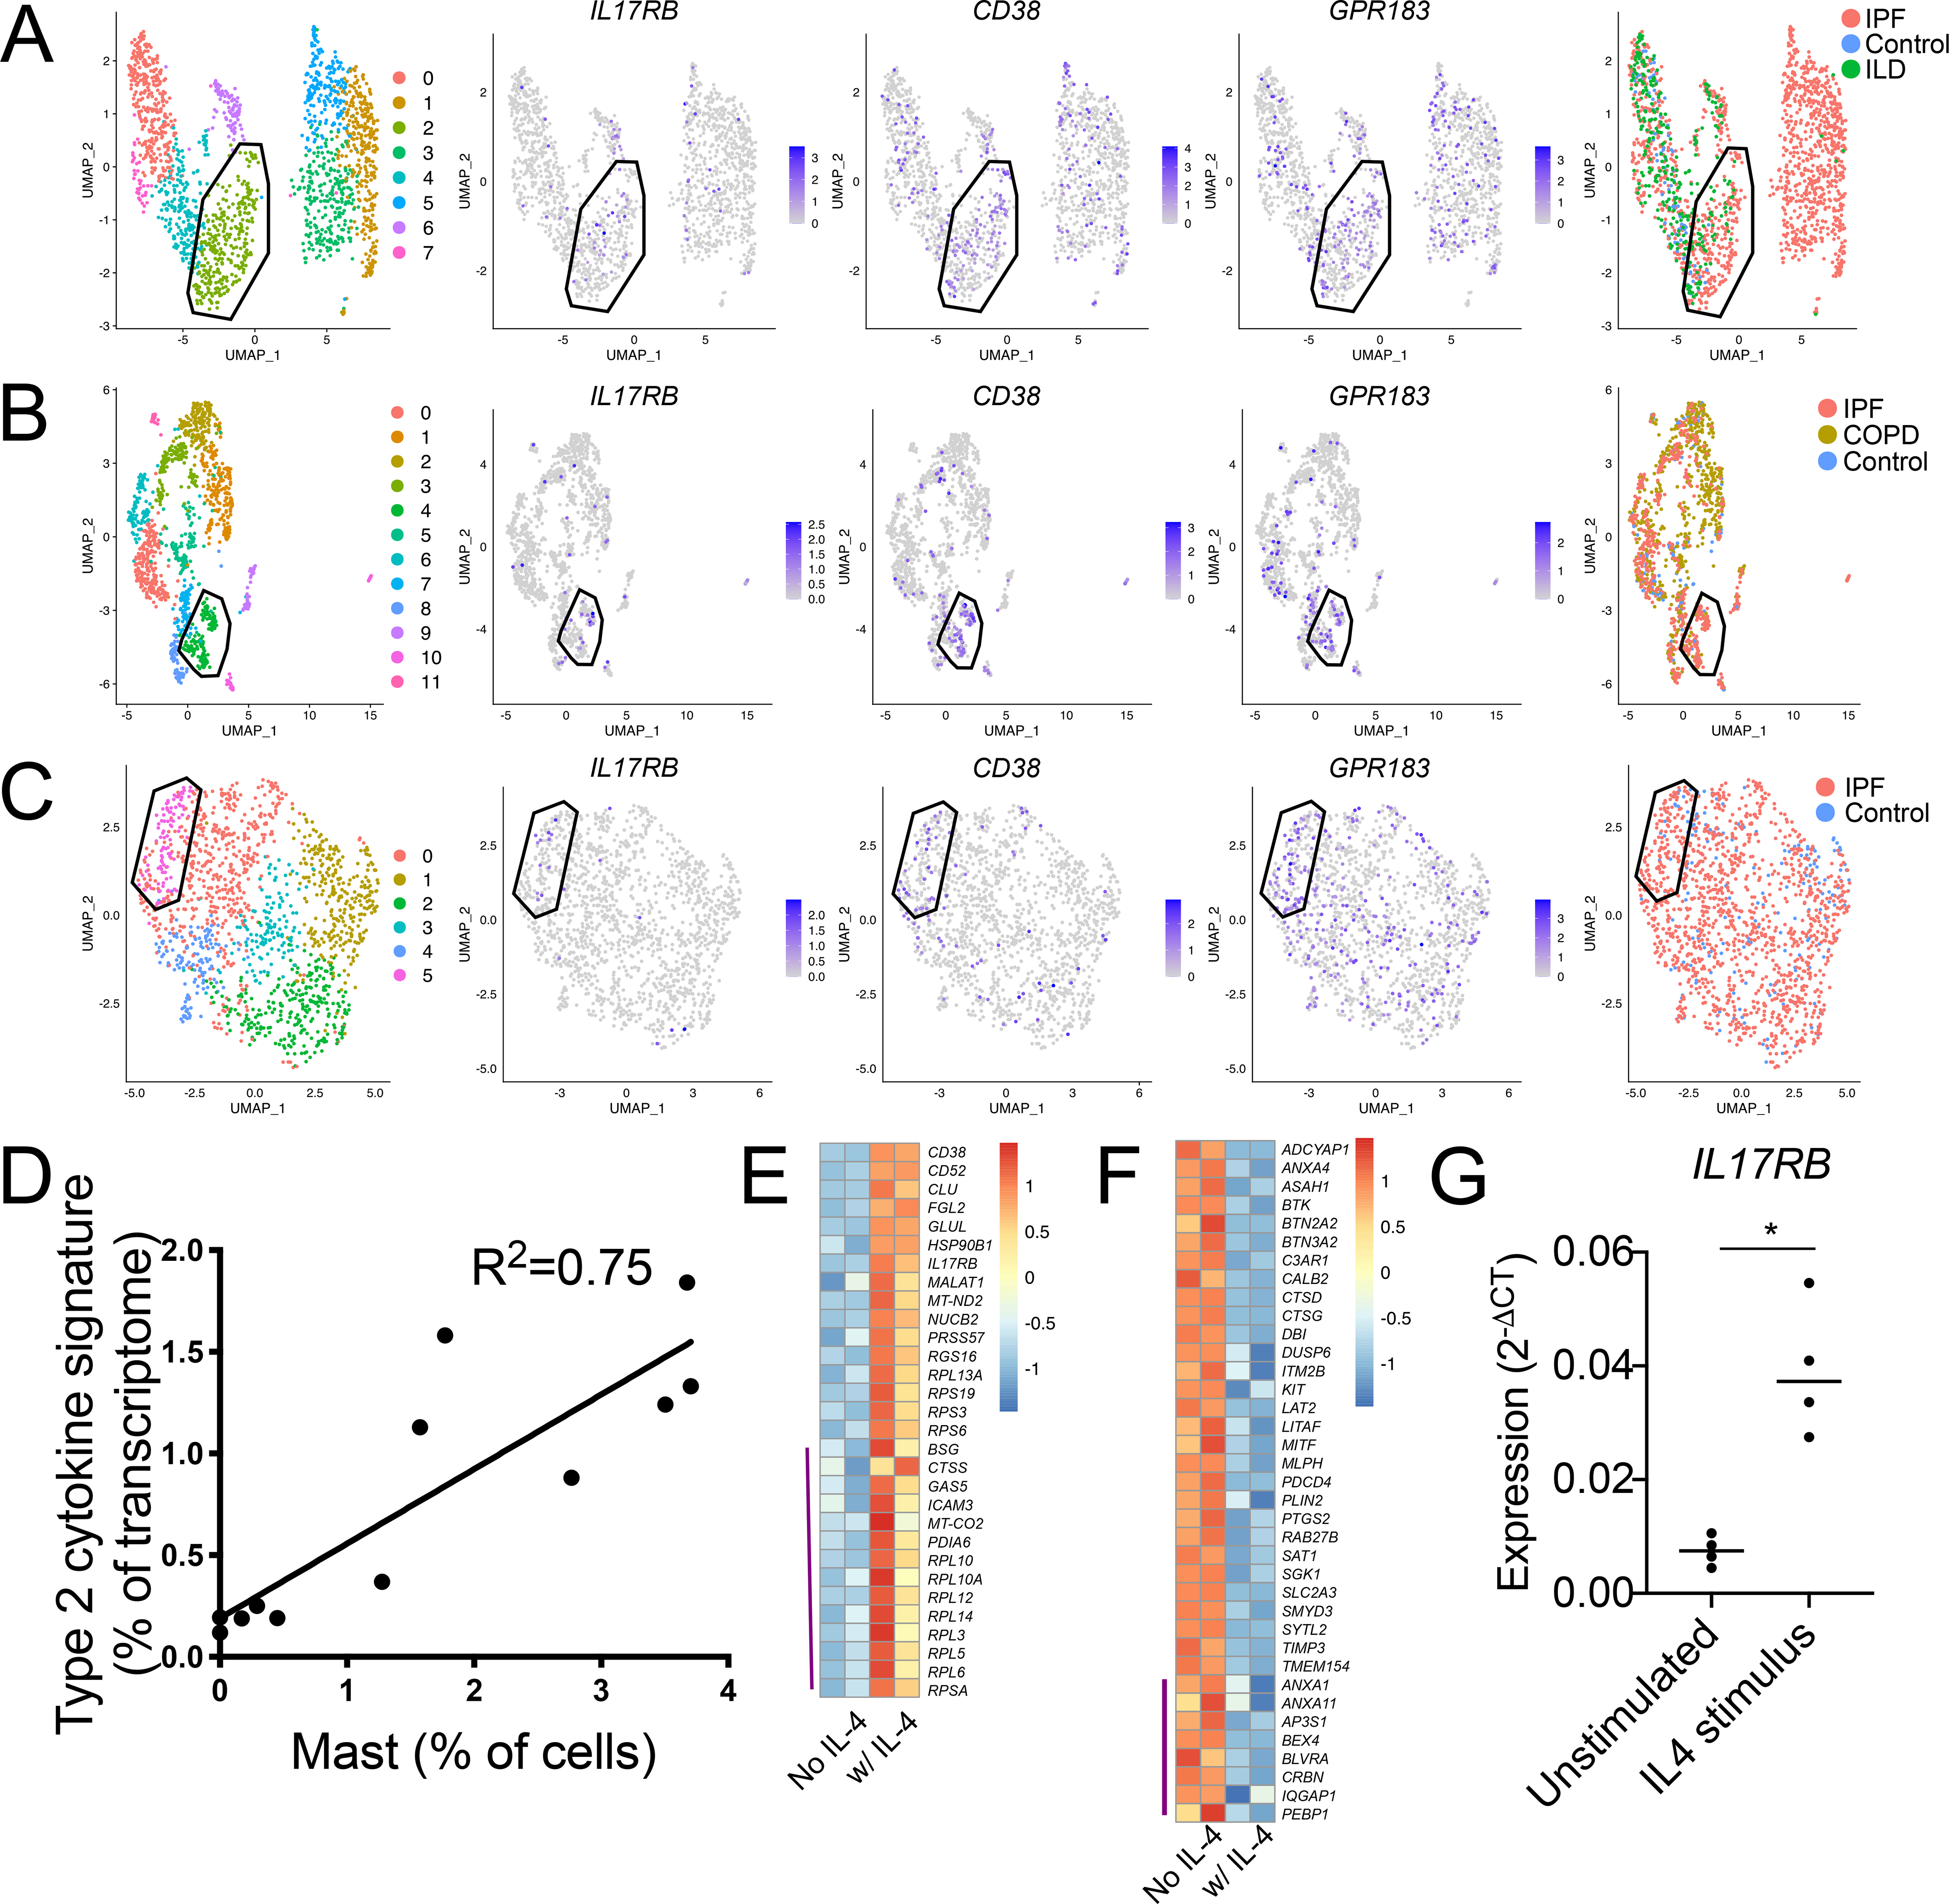
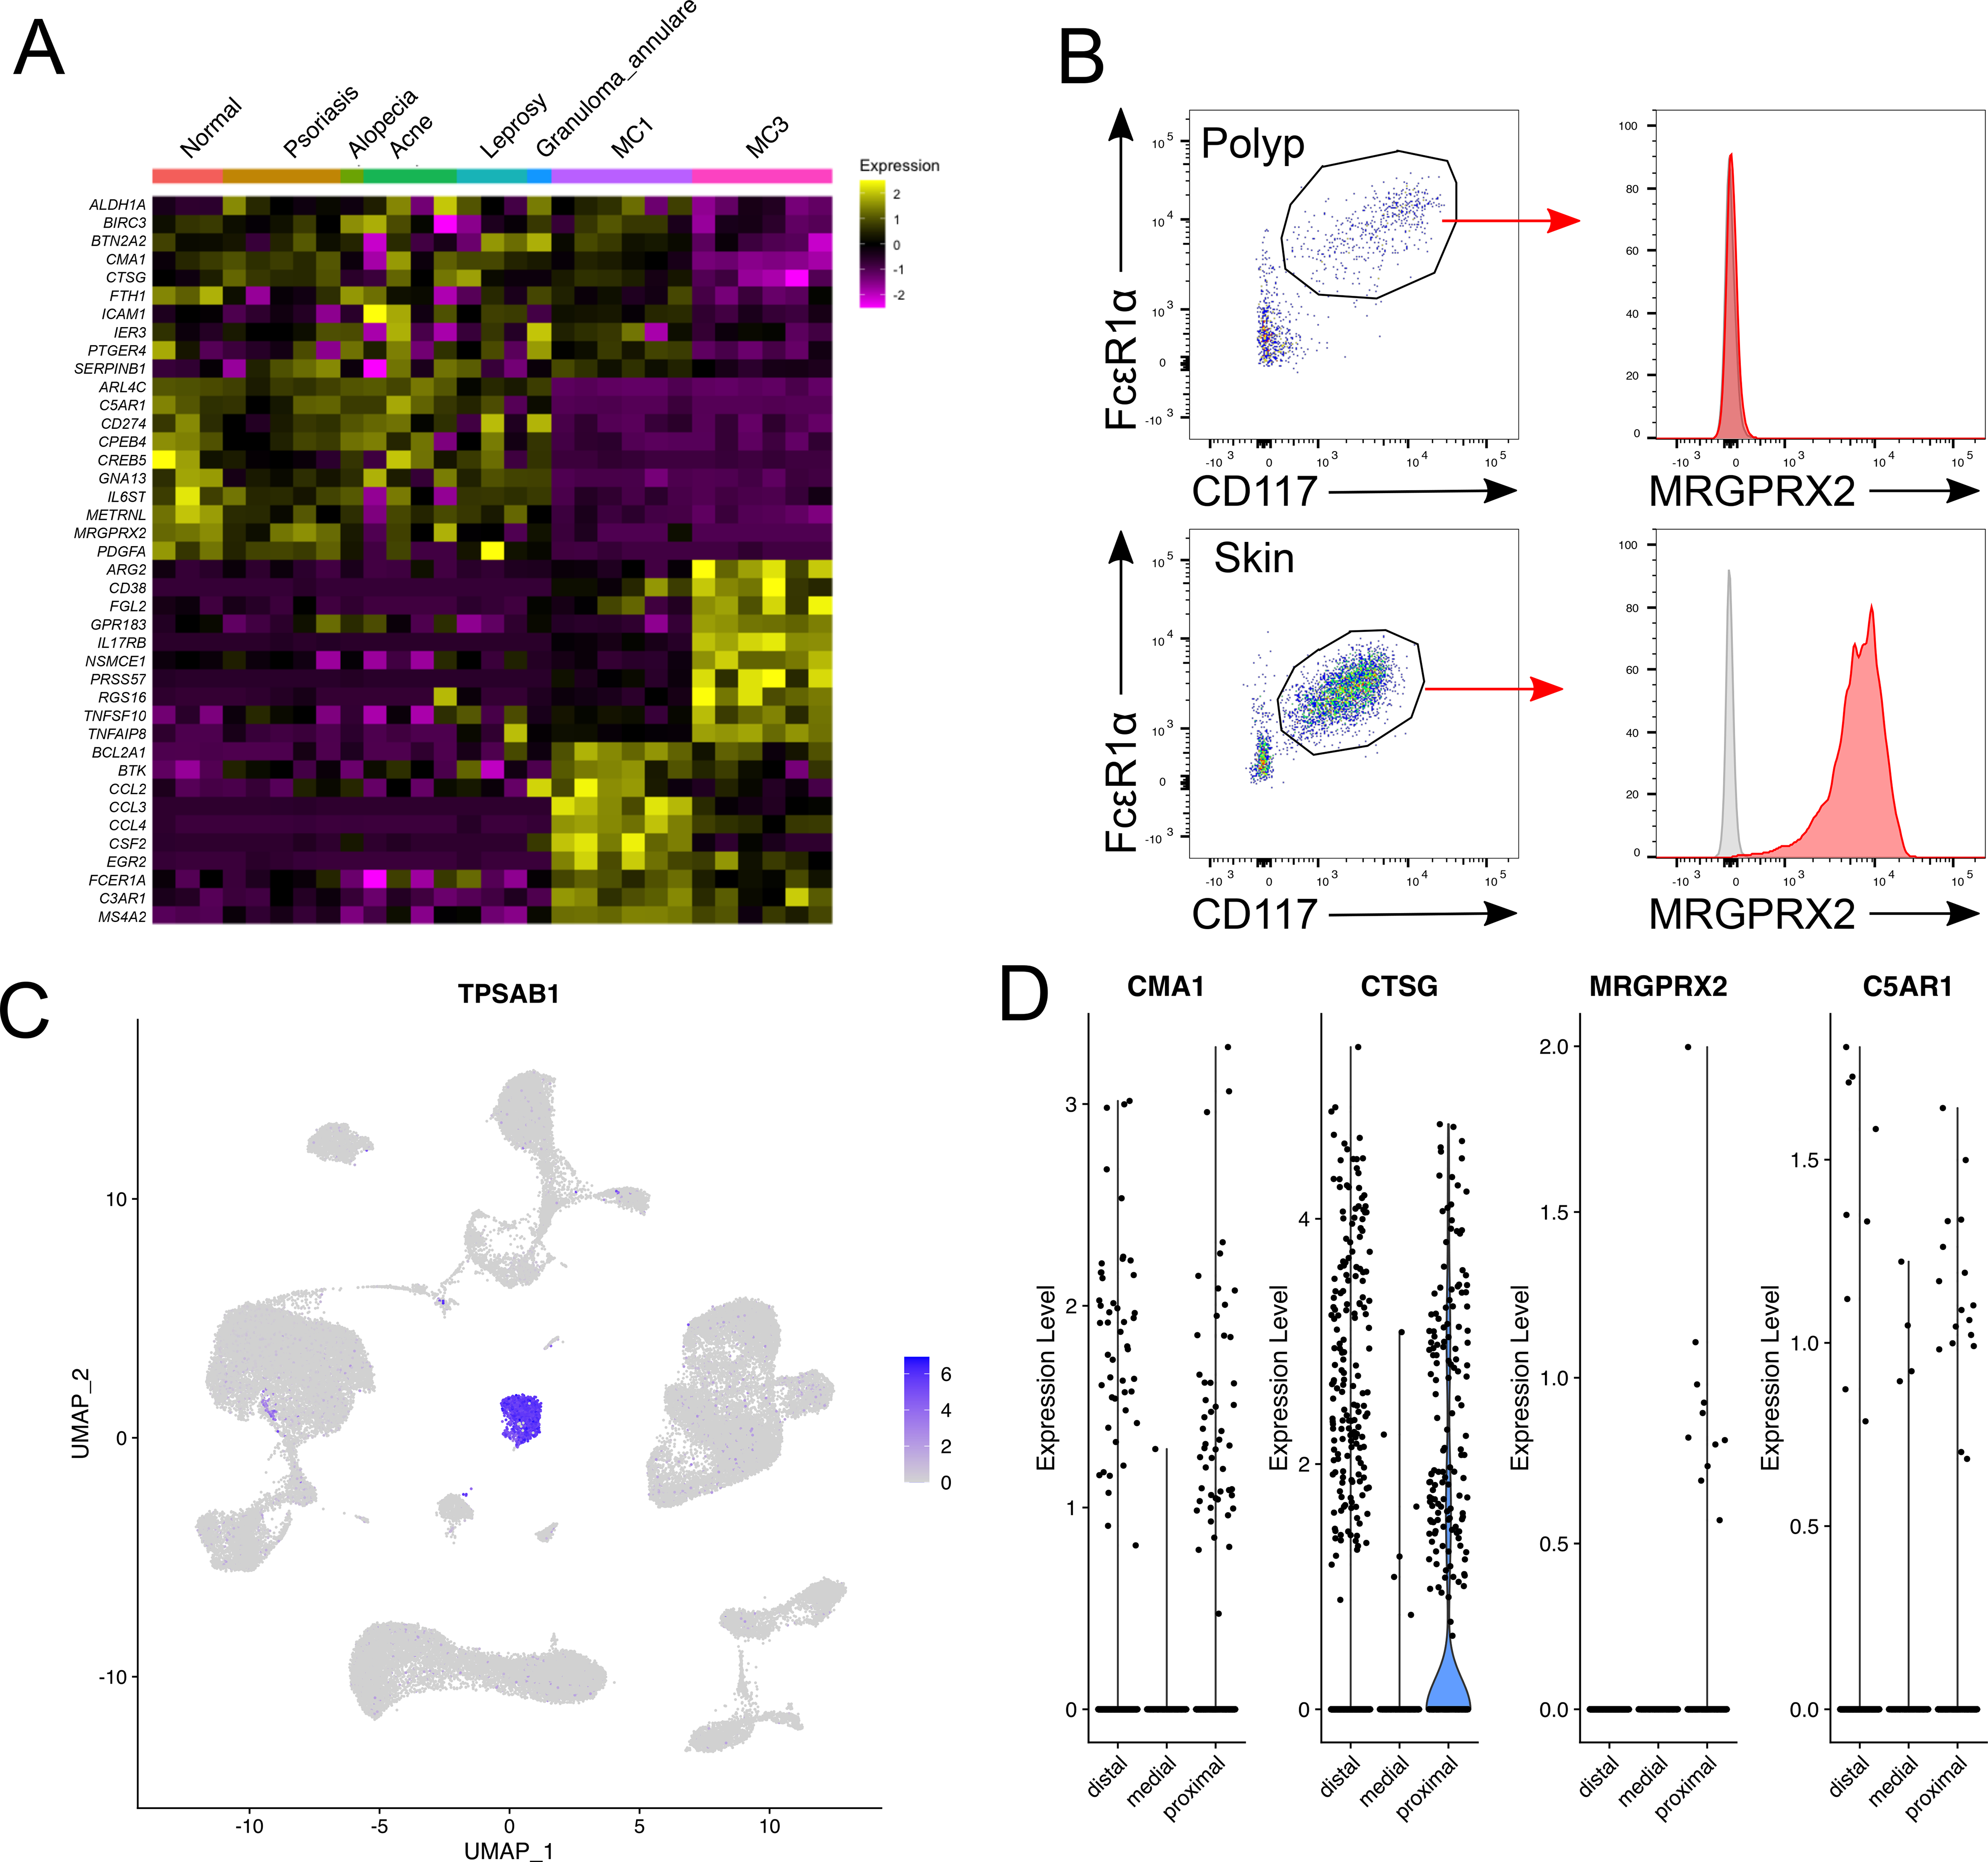
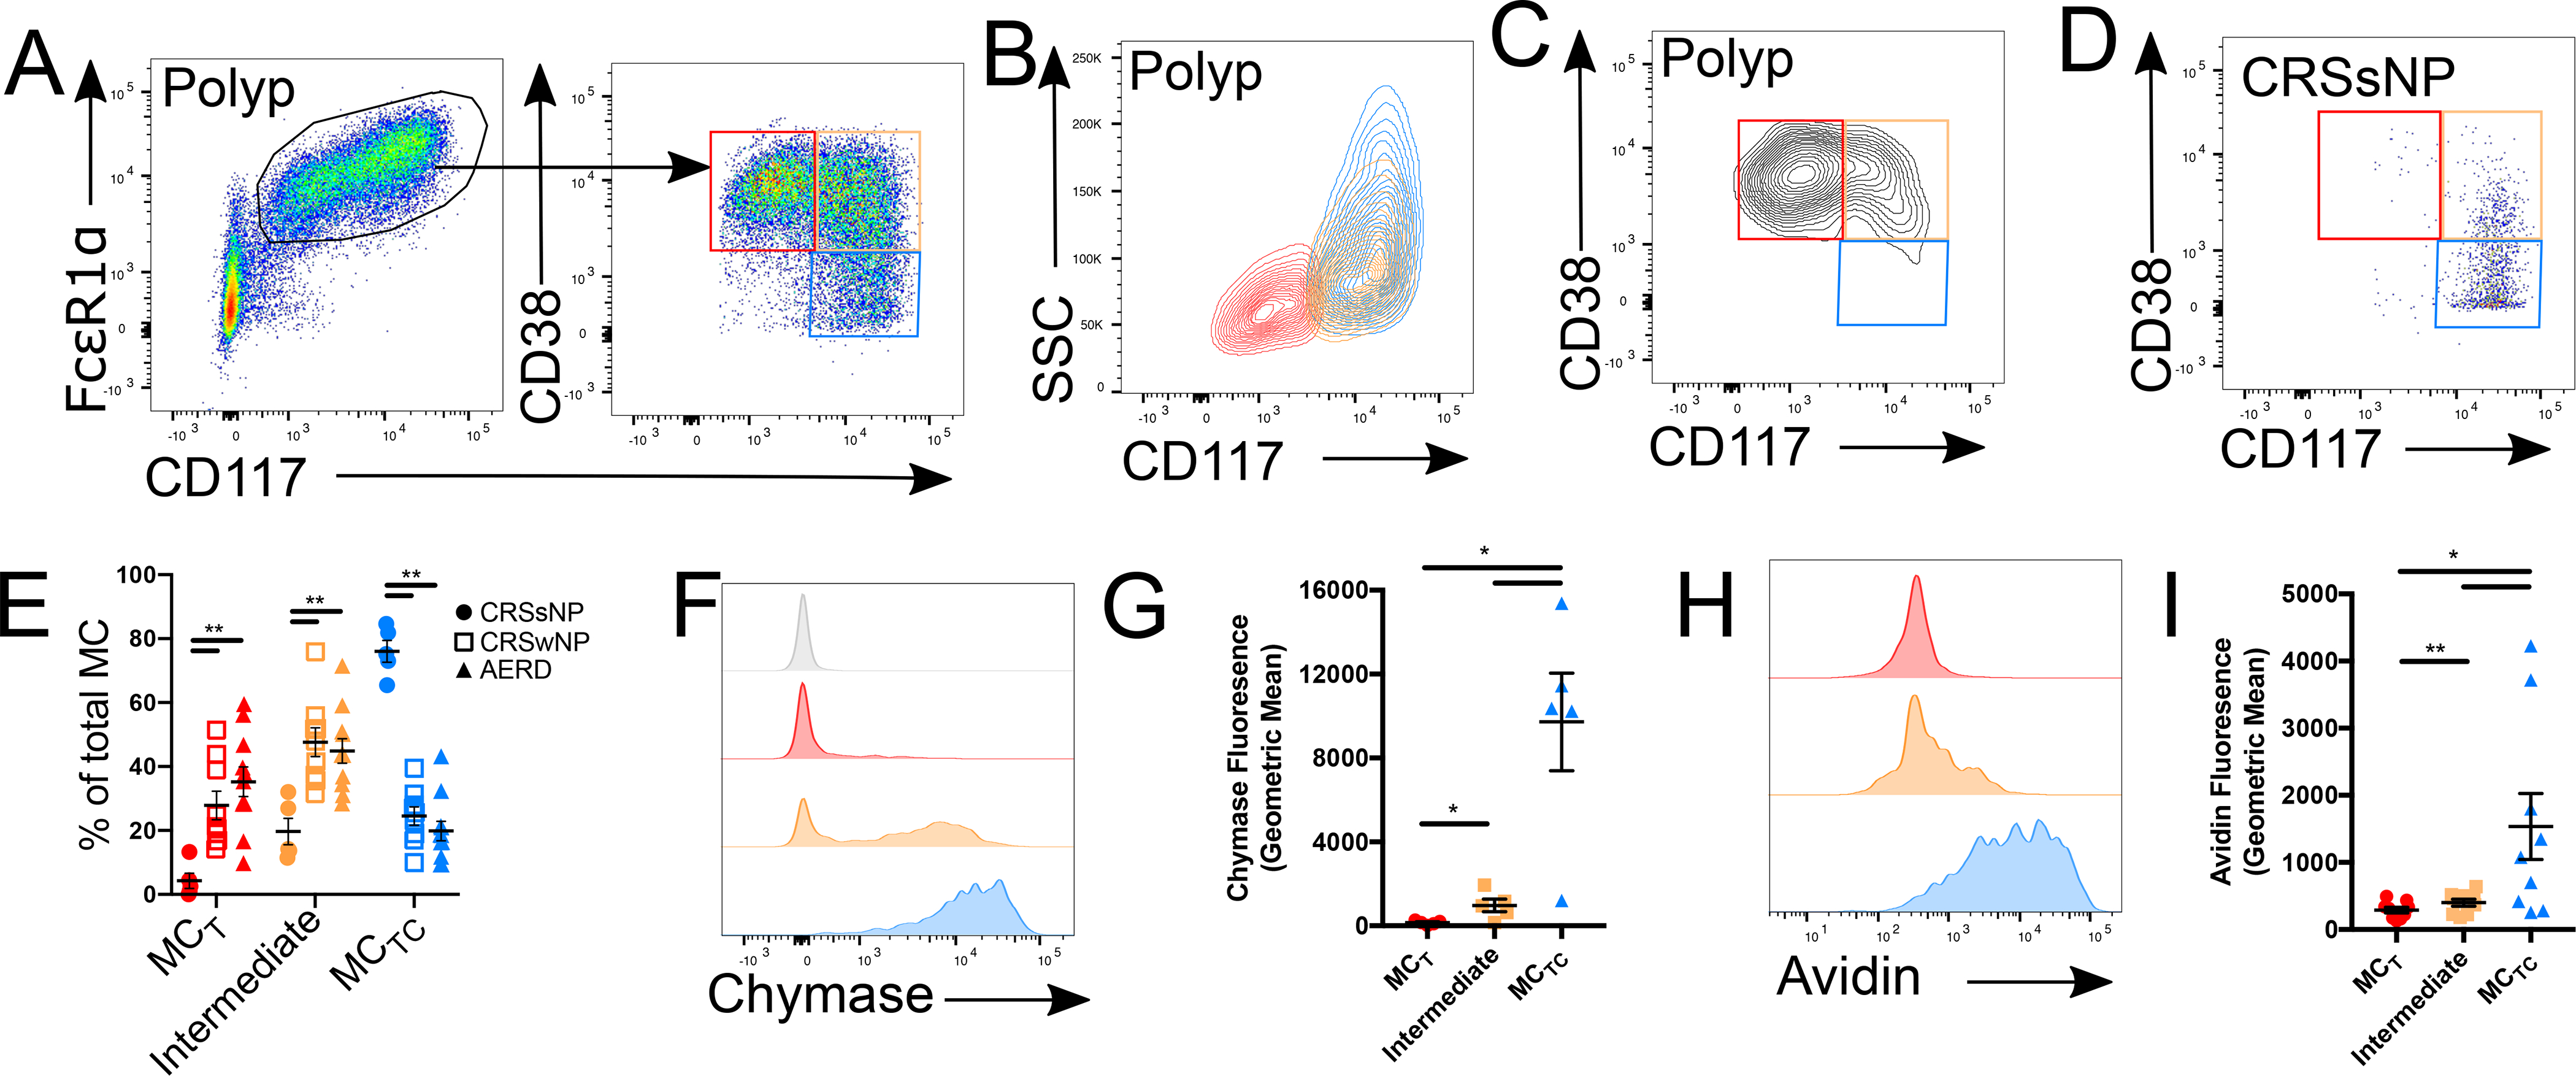
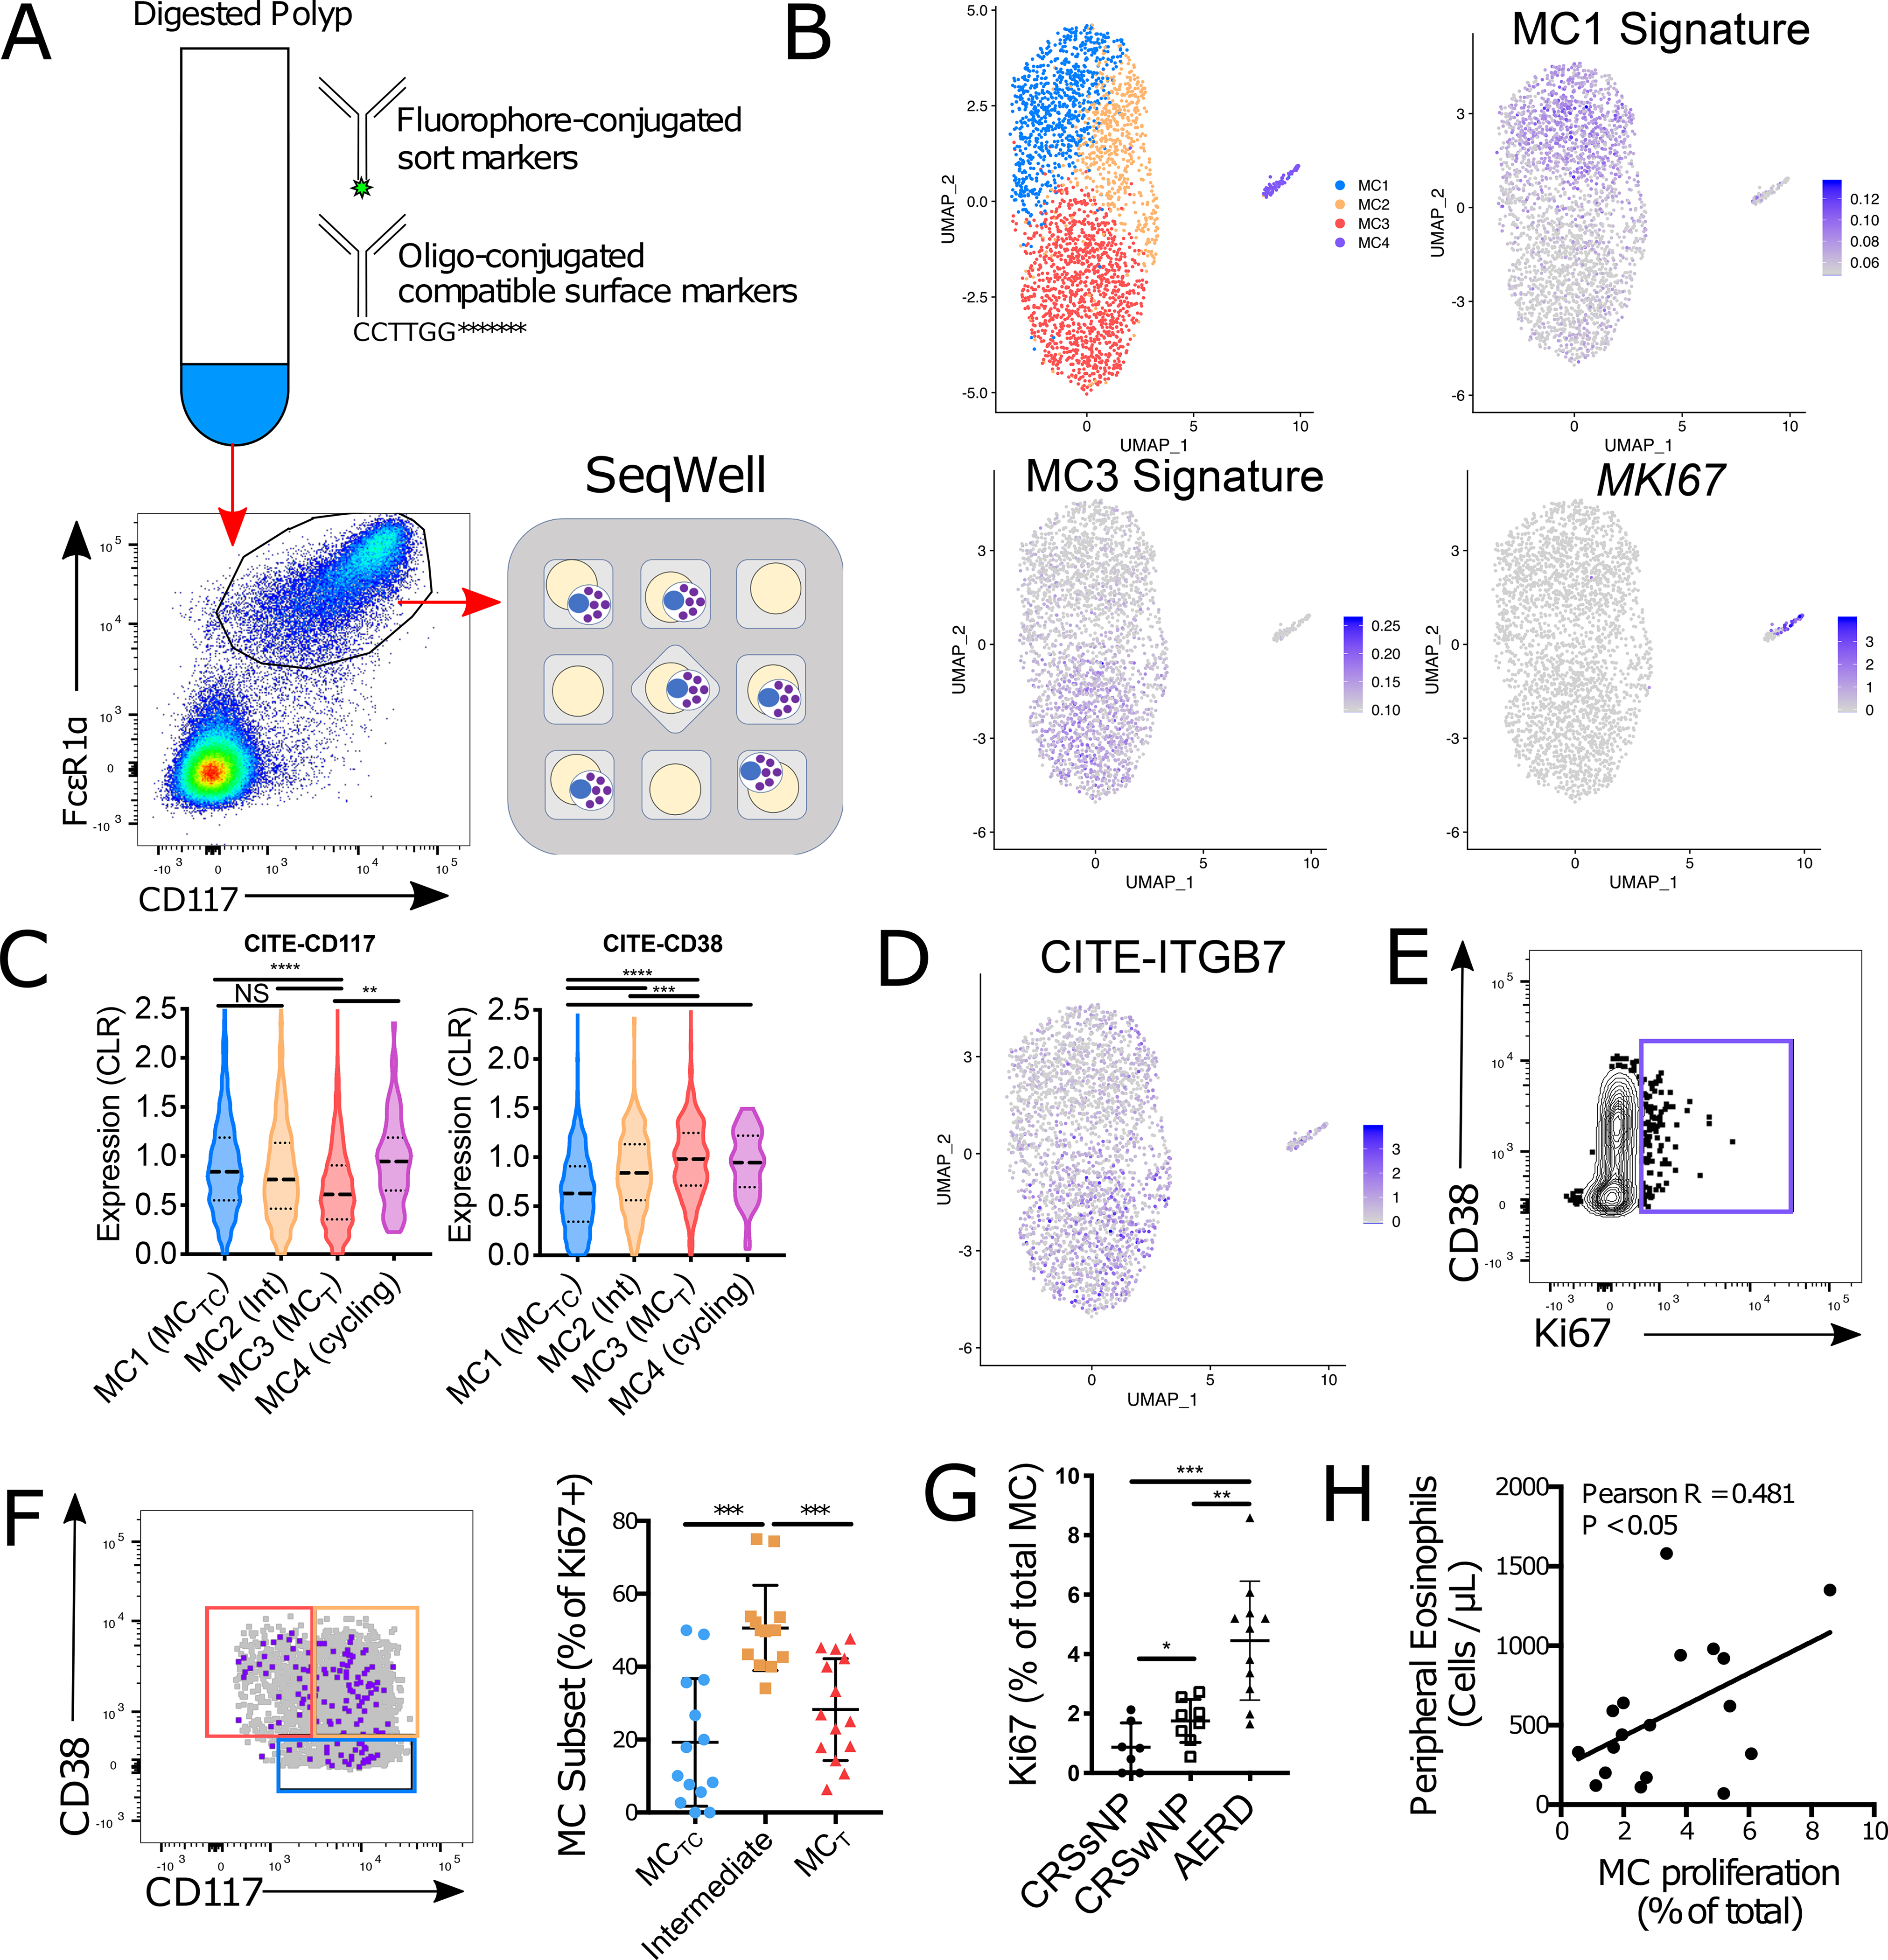
Mast cells (MCs) play a pathobiologic role in type 2 (T2) allergic inflammatory diseases of the airway, including asthma and chronic rhinosinusitis with nasal polyposis (CRSwNP). Distinct MC subsets infiltrate the airway mucosa in T2 disease, including subepithelial MCs expressing the proteases tryptase and chymase (MCTC) and epithelial MCs expressing tryptase without chymase (MCT). However, mechanisms underlying MC expansion and the transcriptional programs underlying their heterogeneity are poorly understood. Here, we use flow cytometry and single-cell RNA-sequencing (scRNA-seq) to conduct a comprehensive analysis of human MC hyperplasia in CRSwNP, a T2 cytokine-mediated inflammatory disease. We link discrete cell surface phenotypes to the distinct transcriptomes of CRSwNP MCT and MCTC, which represent polarized ends of a transcriptional gradient of nasal polyp MCs. We find a subepithelial population of CD38highCD117high MCs that is markedly expanded during T2 inflammation. These CD38highCD117high MCs exhibit an intermediate phenotype relative to the expanded MCT and MCTC subsets. CD38highCD117high MCs are distinct from circulating MC progenitors and are enriched for proliferation, which is markedly increased in CRSwNP patients with aspirin-exacerbated respiratory disease, a severe disease subset characterized by increased MC burden and elevated MC activation. We observe that MCs expressing a polyp MCT-like effector program are also found within the lung during fibrotic diseases and asthma, and further identify marked differences between MCTC in nasal polyps and skin. These results indicate that MCs display distinct inflammation-associated effector programs and suggest that in situ MC proliferation is a major component of MC hyperplasia in human T2 inflammation.


Conflict of interest statement

Competing interests

J.O.M. reports compensation for consulting services with Cellarity and Hovione. R.E.R. reports compensation for consulting services with Roche Genentech and Gossamer pharmaceuticals. N.A.B. reports compensation for consulting services for Regeneron. A.K.S. reports compensation for consulting and/or SAB membership from Merck, Honeycomb Biotechnologies, Cellarity, Repertoire Immune Medicines, Ocrhe Bio, Hovione, and Dahlia Biosciences.

Figures

Figure 1:
Figure 1:. Phenotypic characterization of sinus MC hyperplasia
(A) Flow identification of human sinus MCs. (Additional replicates and full gating in Figure S1). (B) MC quantification as percentage of CD45+ (left) or total cells (right) in indicated patient groups (n=6–12 donors/group). *, p<0.05; **, p<0.01 (Mann-Whitney). (C) Representative plots showing MC heterogeneity in nasal polyp (left) or CRSsNP tissue (right). (D) MC phenotype in polyp epithelium (left), whole polyp (center) with overlay (right). Red: epithelium; Black: whole polyp. Representative of five donors. (E) Gating distinguishing epithelial MCs (CD117low SSClow, red) from subepithelial MCs (CD117high, blue) in epithelial fraction (left panel) vs unfractionated polyp (right panel) (F) Quantification of epithelial and subepithelial MCs in fractionated epithelium and unfractionated polyp (n=5 donors); *, p<0.05 (paired t-test). (G) FcεR1α expression of epithelial (red) and subepithelial MCs (blue) with quantification (right). Lines denote paired observations (n=24 donors); ****, p<5 × 10⁻⁵ (paired t-test) (H) Toluidine blue (left) and protease immunophenotyping (right) of sorted CD117low MCs. Two examples provided to show heterogeneity. Green: tryptase; Red: chymase; Yellow: colocalization; Blue: nucleus. (I) Toluidine blue (left) and protease immunophenotyping (right) of CD117high MCs. Two examples provided to show heterogeneity. Green: tryptase; Red: chymase; Yellow: colocalization; Blue: nucleus.
Figure 2:
Figure 2:. Identification polyp MCs with a progenitor-like cell surface phenotype
(A) Identification of nasal polyps SSClowItgβ7 high MCs (left). CD117 and SSC expression on Itgβ7high MC (magenta) relative to all polyp MCs (grey) (right). (B) Toluidine blue (left) and protease immunophenotype (right) of sorted Itgβ7 high polyp MCs MCs. Green: tryptase; Red: chymase; Blue: nucleus (C) Representative flow plot of Itgβ7 expression on CRSsNP MCs. (D) Quantification of Itgβ7high MCs as a percentage of total MCs in CRSsNP, CRSwNP and AERD. **, p<0.01 (Mann-Whitney). (E) CD34 expression on polyp Itgβ7high MCs (magenta) and circulating MCP (turquoise) vs isotype (grey), representative of three independent donors. (Magenta and grey are superimposed). (F) Integrin expression on circulating MCP (left) and polyp Itgβ7high MCs (right), each representative of three separate donors. (G) Distribution of polyp αEhigh (green) and αE- (purple) Itgβ7highMCs distribution within the epithelial vs subepithelial gates (left) as in Fig. 1E, with quantification (right). *, p<0.05 (paired t-test).
Figure 3:
Figure 3:. scRNA-seq identification of transcriptionally distinct polyp MC subsets
(A) Schematic representation for scRNA-seq analysis of 7,355 cells sorted polyp MCs (Fig. S1) (n=6 donors). (B) Uniform Manifold Approximation and Projection (UMAP) depiction of MC clusters. (Fig. S3 depicts identification of MC vs contaminating clusters). (C) MC expression of canonical MC transcripts. (D) Common (top rows) and cluster-enriched transcripts (columns show donor-averaged row-normalized expression). padj < 3.1 × 10⁻²⁹ for cluster enriched genes (Wilcoxon). (E) Polyp MC expression of MC1 and MC3 signatures (% of transcripts/cell). (F) Per-cell expression of MC1 and MC3 signatures across all clusters (top) and MC4 alone (bottom). (correlation r-value). (G) Differentially expressed transcripts between polyp MCTC (MC1) and MCT (MC3), (donor averaged, row normalized); padj < 6 × 10⁻⁹ (Wilcoxon). (H) Immunomodulatory transcript expression in polyp MCTC and MCT, (donor averaged, row normalized); padj < 7 × 10⁻¹⁷ (Wilcoxon). (I) FcεR1 signaling pathway expression in polyp MCTC and MCTC (donor averaged, row normalized); padj < 8 × 10⁻⁴ (Wilcoxon). (J) Expression of transcript scores driven by IgE signaling, IL33 signaling, or shared by both stimuli across the MC1–3 clusters. (lines denote median and quartiles) p***, p<1×10⁻¹⁰, ***, p<1×10⁻¹⁵ (Mann-Whitney); Cohen’s effect size for MC1 vs. MC3: 0.60 (IgE), 0.79 (IL33), and 1.52 (shared).
Figure 4:
Figure 4:. Characterization of an IL-4-elicited MCT phenotype enriched in diseased human lung samples.
(A-C) Re-clustering of MCs from three scRNA-seq datasets accessed through the human IPF atlas: (A) control, IPF and ILD; (B) control, IPF and COPD; and (C) control and IPF. Clustering for each dataset indicated a population (polygon gate) that was statistically enriched for the polyp MC3-associated transcripts IL17RB, CD38, and GPR183 (center panels) and predominantly composed of MCs from diseased tissue relative to healthy (left panels). Circle gate indicates MCs co-expressing the proliferation-associated genes MKI67 and TOP2A. (D) Correlation analysis of polyp scRNA-seq epithelial IL-4/13-induced signature expression, (donor averaged) versus scRNA-seq defined MC percentage for each donor. p<0.001. (E) MC3-enriched transcripts (Supplementary table 4) upregulated in two technical replicate CBMC samples by 96-hour IL-4 stimulus (row normalized expression). Top half: FDR<0.1, bottom half (indicated by purple line): P < 0.05 (DESeq2). (F) MC1-enriched transcripts (supplemental table 4) downregulated in two technical replicate CBMC samples by 96 hours IL-4 stimulus (row normalized expression). Top half: FDR<0.1, bottom half (indicated by purple line): P < 0.05 (DESeq2). (G) CBMCs IL17RB expression (qPCR) following 72-hour stimulus with vehicle or IL-4, (n=4 biologic replicates across three independent experiments), * indicates p<0.05 (paired t-test).
Figure 5:
Figure 5:. Identification of MCTC heterogeneity across tissues
(A) Transcripts shared between diseased and control skin MCs and polyp MCTC (top) vs. enriched in skin MCs (upper middle), polyp MCT (lower middle), or polyp MCTC (bottom) (donor averaged, row normalized). (B) Representative analysis of MRGPRX2 expression (red) on nasal poly MCs (left) and skin MCs (right) relative to isotype (grey). Staining representative of 3 donors per group. (C) Identification of MCs based on TPSAB1 expression within a scRNAseq dataset of healthy human lung tissue containing samples from distal, medial and proximal lung generated by Travaglini et al(47). (D) Violin plots showing expression of the MCTC-associated transcripts CMA1, CTSG, MRGPRX2, and C5AR1 in healthy human lung. No displayed transcripts were significantly differentially expressed between distal and proximal lung, MRGPRX2 expression was only observed in proximal lung.
Figure 6:
Figure 6:. CD38 expression marks nasal polyp MCT and an unpolarized intermediary subset
(A) Representative plot showing nasal polyp MC (gated as in Fig. S1) expression of CD38 and CD117. Arrow indicates sequential gating. (B) SSC vs CD117 profile of CD38high epithelial MCs (red), CD38high subepithelial MCs (orange) and CD38low subepithelial MCs (blue). (C) Representative plot showing CD38 and CD117 expression in Itgβ7high MCs. (D) Representative plot of MC CD38 and CD117 expression in CRSsNP control tissue. (E) Quantification of CD38highCD117low MCT (red), CD38highCD117high intermediate MCs (orange) and CD38lowCD117high MCTC (blue) in sinus tissue of patients with CRSsNP (closed circles), CRSwNP (open squares), or AERD (closed triangles). ** indicates p<0.01 (Mann-Whitney) (F) Intracellular chymase expression in epithelial MCs (red), CD38high subepithelial MCs (orange), and CD38low subepithelial MCs (blue) versus isotype (grey). (G) Quantification of chymase expression in indicated MC subsets (n=5 donors); *, p<0.05, ***, p<0.001 (t-test). (H) Intracellular FITC-avidin staining in epithelial MCs (red), CD38high subepithelial MCs (orange), and CD38low subepithelial MCs (blue). (I) Quantification of FITC-avidin fluorescence in indicated MC subsets (n=9 donors); *, p<0.05 (t-test).
Figure 7:
Figure 7:. Unpolarized MC proliferation underlies MC expansion in human nasal polyps.
(A) Schematic approach for Cellular Indexing of Transcriptomes and Epitopes by Sequencing (CITE-seq) analysis of sorted polyp-derived MCs (B) Identification of four clusters across 2,902 MCs from 2 donors with expression of the MC1 and MC3 gene signatures (Supplementary table 2) and MKI67. (C) Cell surface expression of CD117 and CD38 within each MC cluster (line denotes median and quartiles); **, p<1×10⁻⁴; ***, p<1×10⁻¹²; ****, p<1×10⁻¹⁵; NS, not significant (Mann-Whitney). (D) UMAP plot showing cell surface expression of Itgβ7 across nasal polyp MCs. (E) Representative plot of nuclear Ki67 in nasal polyp MCs. (F) Overlay showing Ki67+ MCs (purple) and all MCs (grey) with flow gates defined in Fig. 6A (left). Quantification of Ki67+ MCs by subset (right); ***, p<0.001 (t-test). (G) Quantification of Ki67+ MCs in indicated disease endotypes. ***, p<0.00, (t-test). (H) Correlation of MC proliferation (Ki67 staining) and peripheral blood eosinophil counts across polyp patients. Pearson R = 0.481, p < 0.05

Similar articles

Cited by

References

    1. Mukai K, Tsai M, Saito H, Galli SJ, Mast cells as sources of cytokines, chemokines, and growth factors. Immunol Rev 282, 121–150 (2018). - PMC - PubMed
    1. Cahill KN et al., KIT Inhibition by Imatinib in Patients with Severe Refractory Asthma. N Engl J Med 376, 1911–1920 (2017). - PMC - PubMed
    1. Voehringer D, Protective and pathological roles of mast cells and basophils. Nat. Rev. Immunol. 13, 362–375 (2013). - PubMed
    1. Andersson CK, Mori M, Bjermer L, Lofdahl CG, Erjefalt JS, Novel site-specific mast cell subpopulations in the human lung. Thorax 64, 297–305 (2009). - PubMed
    1. Irani AA, Schechter NM, Craig SS, DeBlois G, Schwartz LB, Two types of human mast cells that have distinct neutral protease compositions. Proc Natl Acad Sci U S A 83, 4464–4468 (1986). - PMC - PubMed

Publication types

MeSH terms