. 2021 Apr 26;95(10):e00110-21.
doi: 10.1128/JVI.00110-21. Epub 2021 Feb 26.

SARS-CoV-2 causes severe epithelial inflammation and barrier dysfunction

Affiliations

SARS-CoV-2 causes severe epithelial inflammation and barrier dysfunction

Stefanie Deinhardt-Emmer et al. J Virol. .

Abstract

Infections with SARS-CoV-2 can be asymptomatic, but they can also be accompanied by a variety of symptoms that result in mild to severe coronavirus disease-19 (COVID-19) and are sometimes associated with systemic symptoms. Although the viral infection originates in the respiratory system, it is unclear how the virus can overcome the alveolar barrier, which is observed in severe COVID-19 disease courses. To elucidate the viral effects on the barrier integrity and immune reactions, we used mono-cell culture systems and a complex human chip model composed of epithelial, endothelial, and mononuclear cells. Our data show that SARS-CoV-2 efficiently infected epithelial cells with high viral loads and inflammatory response, including interferon expression. By contrast, the adjacent endothelial layer was neither infected nor did it show productive virus replication or interferon release. With prolonged infection, both cell types were damaged, and the barrier function was deteriorated, allowing the viral particles to overbear. In our study, we demonstrate that although SARS-CoV-2 is dependent on the epithelium for efficient replication, the neighboring endothelial cells are affected, e.g., by the epithelial cytokines or components induced during infection, which further results in the damage of the epithelial/endothelial barrier function and viral dissemination.IMPORTANCESARS-CoV-2 challenges healthcare systems and societies worldwide in unprecedented ways. Although numerous new studies have been conducted, research to better understand the molecular pathogen-host interactions are urgently needed. For this, experimental models have to be developed and adapted. In the present study we used mono cell-culture systems and we established a complex chip model, where epithelial and endothelial cells are cultured in close proximity. We demonstrate that epithelial cells can be infected with SARS-CoV-2, while the endothelium did not show any infection signs. Since SARS-CoV-2 is able to establish viremia, the link to thromboembolic events in severe COVID-19 courses is evident. However, whether the endothelial layer is damaged by the viral pathogens or whether other endothelial-independent homeostatic factors are induced by the virus is essential for understanding the disease development. Therefore, our study is important as it demonstrates that the endothelial layer could not be infected by SARS-CoV-2 in our in vitro experiments, but we were able to show the destruction of the epithelial-endothelial barrier in our chip model. From our experiments we can assume that virus-induced host factors disturbed the epithelial-endothelial barrier function and thereby promote viral spread.


Figures

FIG 1
FIG 1
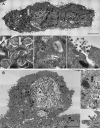
Transmission electron microscopy of SARS-CoV-2-infected Vero-76 and Calu-3 cells. Vero-76 (A) and Calu-3 (B) cells were infected with a SARS-CoV-2 patient isolate (5159, MOI = 1). Transmission electron microscopy was performed 24 h postinfection (p.i.). (A) (Top panel; scale bar, 5 μm) overview of 3 SARS-CoV-2-infected Vero-76 cells; (bottom-left panel; scale bar, 200 nm) generation of double membrane vesicles; (bottom-middle panel; scale bar, 200 nm) virion assembly in the ER–Golgi-intermediate compartment (ERGIC); (bottom-right panel; scale bar: 200 nm) viral release. (B) Overview of a SARS-CoV-2-infected Calu-3 cell showing virus replication activity (large panel; scale bar, 5 μm); in the close-ups, transportation of assembled virions (top-right panel; scale bar, 200 nm), double membrane vesicles (middle-right panel; scale bar, 200 nm), and virus particle release (bottom-right panel; scale bar, 200 nm) are shown.
FIG 2
FIG 2
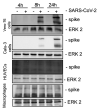
SARS-CoV-2 replicates in Vero-76 and Calu-3 cells. Vero-76, Calu-3 cells, HUVECs, and macrophages were left uninfected (mock) (A, B) or were infected (A-D) with a SARS-CoV-2 patient isolate (5159) (A, B) or (5159, 5587, 5588) (C, D) (MOI, 1). (A) SARS-CoV-2 was visualized by detection of the spike protein via a spike-specific antibody and an Alexa Fluor 488-conjugated goat anti-mouse IgG (green). The nuclei were stained with Hoechst 33342 (blue). Immunofluorescence (IF) microscopy was acquired by use of the Axio Observer.Z1 instrument (Zeiss) with a ×200 magnification. (B) Total cell lysates were harvested at the times indicated, and expression of the spike protein was analyzed by Western blot analysis. ERK2 served as the loading control. (C) Progeny virus particles were measured in the supernatant with a standard plaque assay at the indicated times postinfection (p.i.). Shown are the means (±SD) of PFU ml−1 of at least three independent experiments, including two biological samples. Statistical significance was analyzed with unpaired, two-tailed t tests (***, P < 0.001). (D) RNA-lysates were performed 24 h p.i., and copies of viral RNA (E-gene) were determined with r-biopharm qRT-PCR. Means ± SD of three independent experiments are shown.
FIG 3
FIG 3
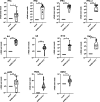
SARS-CoV-2 infection results in induction of antiviral and proinflammatory mRNA synthesis. Calu-3 cells were left uninfected (mock) or were infected with a SARS-CoV-2 patient isolate (5159, 5587, 5588) (MOI, 1). RNA lysates were performed 24 h p.i. Levels of IFNα, IFNβ, IFNλ1, IFNλ2,3, interleukin-6 (IL-6), IL-8, IP10 (interferon-gamma induced protein 10 kDa), tumor necrosis factor-alpha (TNF-α), cIAP2 (cellular inhibitor of apoptosis), TRAIL (TNF-related apoptosis inducing ligand), and RIPK1 (receptor-interacting serin/threonine-protein kinase) mRNA were measured for three patient isolates (5159, 5587, 5588) and two technical samples in 3 independent experiments. Means ± SD of three independent experiments are shown. Levels of mock-treated samples were arbitrarily set as 1. After normalization, two-tailed unpaired t tests were performed for comparison of mock-treated and SARS-CoV-2-infected samples (*, P < 0.05; **, P < 0.01; ***; P < 0.001; ****, P < 0.0001).
FIG 4
FIG 4
SARS-CoV-2 efficiently infects epithelial cells of the human chip model and provokes type I and III interferon production. The epithelial chamber of the chip model was left uninfected (mock) or infected with three different SARS-CoV-2 patient isolates (5159, 5587, 5588) (MOI, 1). (A and B) Immunofluorescence staining was performed 28 h p.i. and analyzed by immunofluorescence microscopy (Axio Observer.Z1; Zeiss); (A) the E-cadherin of the epithelial layer and (B) the VE-cadherin of the endothelial layer were visualized by an anti-E-cadherin-specific antibody or an anti-VE-cadherin antiserum, respectively, and a Cy5 goat anti-rabbit IgG (red). In panels A and B, the SARS-CoV-2 was visualized by detection of the spike protein via a spike-specific antibody and an Alexa Fluor 488-conjugated goat anti-mouse IgG (green). The nuclei were stained with Hoechst 33342 (blue). Scale bars represent 100 μm. (C) Production of antiviral cytokines derived from the epithelial side was determined by use of Legendplex panel (Biolegend, CA, USA). SARS-CoV-2-induced IFNβ, IFNλ1, and IFNλ2,3 release (pg ml−1) was measured. Means ± SD of three independent experiments each infected with another patient isolate (5159, 5587, 5588) are shown. After normalization, two-tailed unpaired t tests were performed for comparison of mock-treated and SARS-CoV-2-infected samples (**, P < 0.01).
FIG 5
FIG 5
SARS-CoV-2 infection results in the disruption of barrier integrity in the human chip model. The epithelial side of the chip model was left uninfected (mock) or infected with the SARS-CoV-2 patient isolate (5159) (MOI, 1). (A and B) Scanning electron microscopy was performed 28 h p.i.; Overviews (top panel) of the (A) epithelial layer and (B) endothelial layer are depicted. Dead cells (middle panel) are focused. The surface of dead cells (lower panel) shows particles attached to the plasma membranes of the epithelial cells only. Scale bars represent 50 μm (×200 magnification), 5 μm (×2,000 magnification), and 200 nm (×60,000 magnification). (C) Supernatants of the epithelial and endothelial side of SARS-CoV-2-infected human chip models were used to perform LDH assays indicating cell membrane rupture at 8 h, 28 h, and 40 h p.i. (D) The barrier function of the human chip model was analyzed with a permeability assay of mock-infected and SARS-CoV-2-infected human chip models using FITC-dextran at 8 h and 28 h p.i. FITC-dextran was measured via the fluorescence intensity (excision, 488 nm; emission, 518 nm) and depicted as the permeability coefficient (Papp), calculated according to Papp (cm s−1) = (dQ/dt) (1/ACo). Results show significantly higher barrier permeability 28 h p.i. after SARS-CoV-2 infection. (E) Progeny virus titers were analyzed in the supernatants of the epithelial and endothelial layer with a standard plaque assay at 8 h, 28 h, and 40 h p.i. and indicated as plaque-forming units (PFU) ml−1. Shown are means (±SD) of three independent experiments each infected with a different patient isolate (5159, 5587, 5588). Statistical significance was analyzed by unpaired, two-tailed t test (*, P < 0.05; **, P < 0.01).
FIG 6
FIG 6
Schematic representation of a SARS-CoV-2-infected human chip model. SARS-CoV-2 productively infects the epithelium (Calu-3 cells) of the human chip model and produces progeny virus particles. Concomitantly, virus-induced cellular factors are released, affecting neighboring cells. Although the endothelial cells were cultured in close proximity to the infected epithelium, they were not infected by SARS-CoV-2. Nonetheless, endothelial cells become damaged, resulting in a decline in tissue barrier function. This figure was made with Servier Medical Art templates, which are licensed under a Creative Commons Attribution 3.0 Unported License.

References

    1. Bar-On YM, Flamholz A, Phillips R, Milo R. 2020. SARS-CoV-2 (COVID-19) by the numbers. Elife 9:e57309. 10.7554/eLife.57309. - DOI - PMC - PubMed
    1. George PM, Wells AU, Jenkins RG. 2020. Pulmonary fibrosis and COVID-19: the potential role for antifibrotic therapy. Lancet Respir Med 8:807–815. 10.1016/S2213-2600(20)30225-3. - DOI - PMC - PubMed
    1. Carsana L, Sonzogni A, Nasr A, Rossi RS, Pellegrinelli A, Zerbi P, Rech R, Colombo R, Antinori S, Corbellino M, Galli M, Catena E, Tosoni A, Gianatti A, Nebuloni M. 2020. Pulmonary post-mortem findings in a series of COVID-19 cases from northern Italy: a two-centre descriptive study. Lancet Infectious Diseases 20:1135–1140. 10.1016/S1473-3099(20)30434-5. - DOI - PMC - PubMed
    1. Wichmann D, Sperhake J-P, Lütgehetmann M, Steurer S, Edler C, Heinemann A, Heinrich F, Mushumba H, Kniep I, Schröder AS, Burdelski C, de Heer G, Nierhaus A, Frings D, Pfefferle S, Becker H, Bredereke-Wiedling H, de Weerth A, Paschen H-R, Sheikhzadeh-Eggers S, Stang A, Schmiedel S, Bokemeyer C, Addo MM, Aepfelbacher M, Püschel K, Kluge S. 2020. Autopsy findings and venous thromboembolism in patients with COVID-19. Ann Intern Med 173:268–277. 10.7326/M20-2003. - DOI - PMC - PubMed
    1. Deinhardt-Emmer S, Wittschieber D, Sanft J, Kleemann S, Elschner S, Haupt KF, Vau V, Häring C, Rödel J, Henke A, Ehrhardt C, Bauer M, Philipp M, Gaßler N, Nietzsche S, Löffler B, Mall G. 2020. Early postmortem mapping of SARS-CoV-2 RNA in patients with COVID-19 and correlation to tissue damage. bioRxiv 10.1101/2020.07.01.182550:2020.07.01.182550. - DOI - PMC - PubMed

LinkOut - more resources