. 2021 Feb 26;148(4):dev196253.
doi: 10.1242/dev.196253.

Tissue growth constrains root organ outlines into an isometrically scalable shape

Affiliations

Tissue growth constrains root organ outlines into an isometrically scalable shape

Motohiro Fujiwara et al. Development. .

Abstract

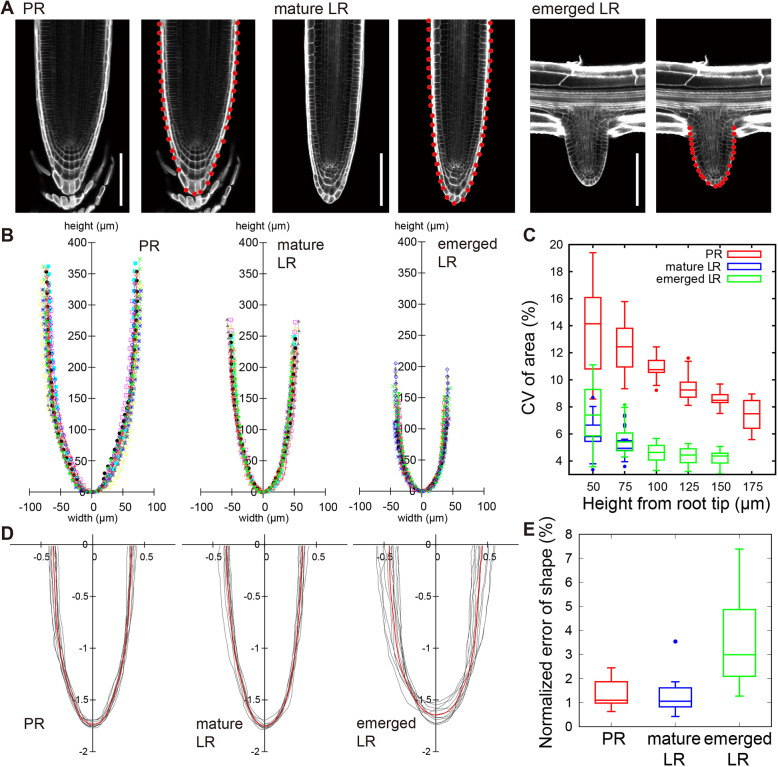
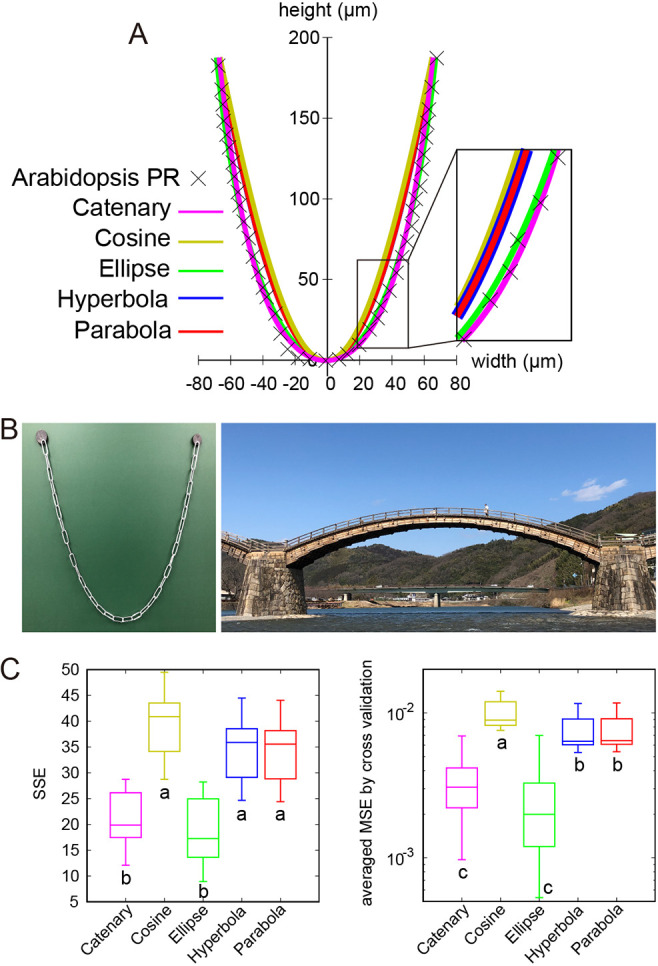
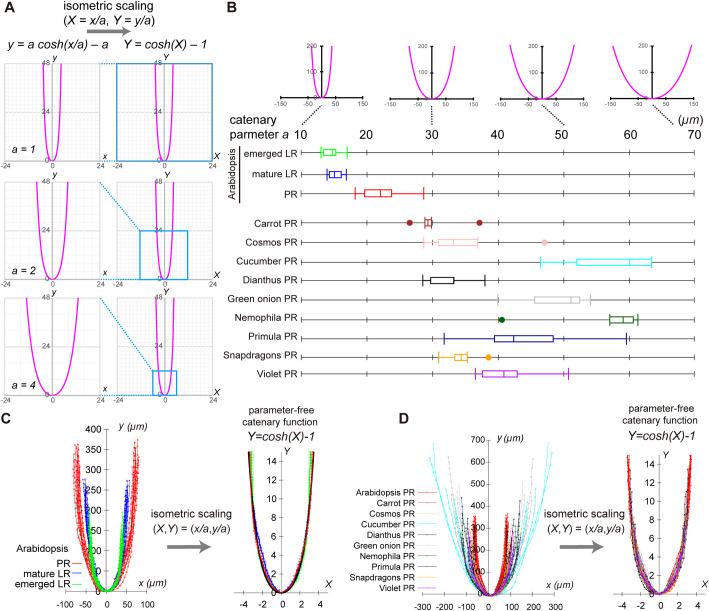
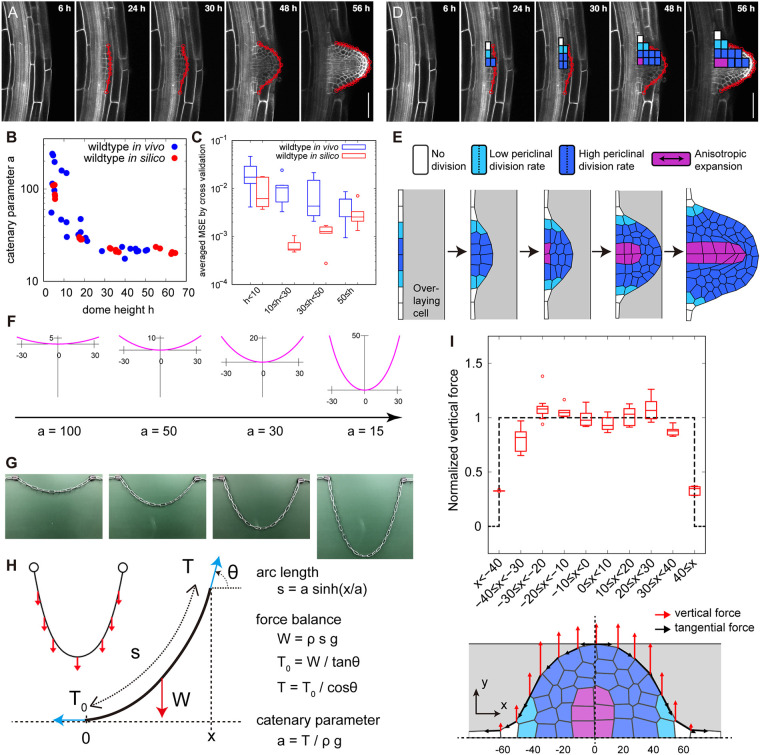
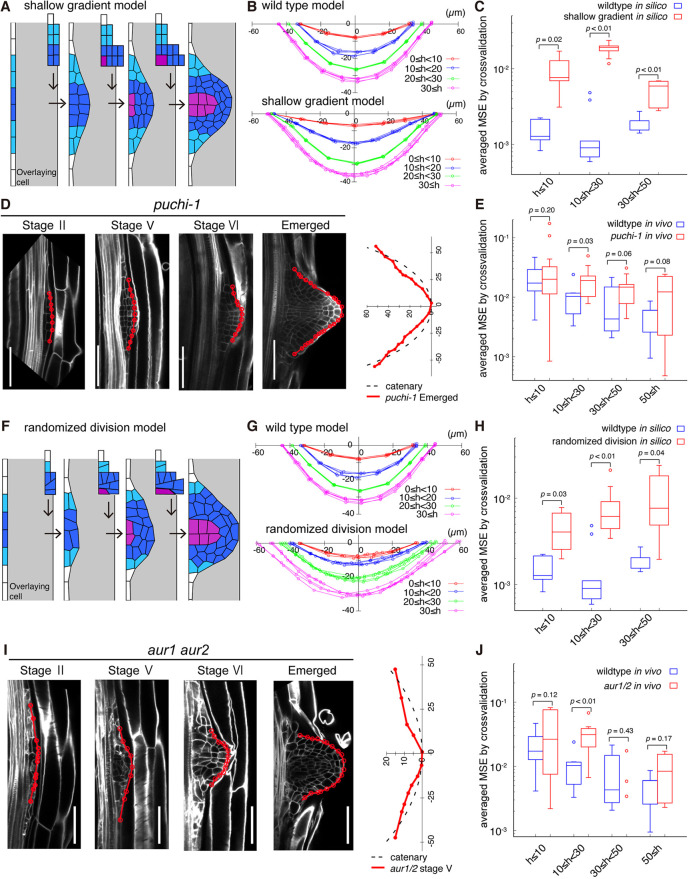
Organ morphologies are diverse but also conserved under shared developmental constraints among species. Any geometrical similarities in the shape behind diversity and the underlying developmental constraints remain unclear. Plant root tip outlines commonly exhibit a dome shape, which likely performs physiological functions, despite the diversity in size and cellular organization among distinct root classes and/or species. We carried out morphometric analysis of the primary roots of ten angiosperm species and of the lateral roots (LRs) of Arabidopsis, and found that each root outline was isometrically scaled onto a parameter-free catenary curve, a stable structure adopted for arch bridges. Using the physical model for bridges, we analogized that localized and spatially uniform occurrence of oriented cell division and expansion force the LR primordia (LRP) tip to form a catenary curve. These growth rules for the catenary curve were verified by tissue growth simulation of developing LRP development based on time-lapse imaging. Consistently, LRP outlines of mutants compromised in these rules were found to deviate from catenary curves. Our analyses demonstrate that physics-inspired growth rules constrain plant root tips to form isometrically scalable catenary curves.

Keywords: Anisotropic growth; Catenary curve; Developmental constraint; Organ shape; Plant root tip; Scaling.


Conflict of interest statement

Competing interestsThe authors declare that the research was conducted in the absence of any commercial or financial relationships that could be construed as a potential conflict of interest.

Figures

Fig. 1.
Fig. 1.
Reproducible size and shape of root tip outlines in Arabidopsis. (A) Longitudinal confocal sections of a PR, a mature LR and an emerged LR. Cell walls were stained with SR2200. Red points indicate cell junctions on the dome outline. Scale bars: 100 µm. (B) Reproducibility of root tip size. Outlines of multiple samples from each root class were superimposed with different colors. Points indicate cell junctions on the outline. (C) Reproducibility of root tip area. Root tip areas measured on the median longitudinal section up to the indicated heights from the root tip. Size reproducibility is indicated by CV [CV (%)= (s.d. of area)×100/(mean of area)]. Higher CV of PR than that of LR is likely attributable to phase differences of root cap sloughing among samples. (D) Reproducibility of root tip shape. Outlines of multiple root samples were normalized by the radial Fourier series expansion method (Materials and Methods) and superimposed (gray). Median outlines are shown in red. (E) A graph showing the shape reproducibility indicator (Eqn 9) of tip outlines for distinct root types. The upper and lower hinges, the middle lines and the error bars of the box plots in C and E represent the 25th, 75th and 50th (median) percentiles, and s.d., respectively. B and E are drawn from identical data sets [n=12 (PR), n=12 (mature LR) and n=11 (emerged LR)].
Fig. 2.
Fig. 2.
Catenary is an isometrically scalable function and the best-fit model for root tip outlines. (A) NLS fitting of a representative Arabidopsis PR outline with five geometrical functions (catenary, cosine, ellipse, hyperbola and parabola). (B) Examples of catenary curves in architectures: a chain hanging with its both ends fixed under gravity (left panel) and the Kintai wooden bridge in Yamaguchi prefecture, Japan (right panel). (C) SSE between PR sample dome outlines (n=12) and the indicated curve function (left panel). The averaged MSE by cross validation between PR sample dome outlines (n=12) and the indicated curve function (right panel; Eqn 12). Different letters (a, b, c) denote statistically significant differences (P<0.05) among means by Tukey's honestly significant difference test. The upper and lower hinges, the middle lines and the error bars of box plots represent the 25th, 75th, and 50th percentiles, and s.d., respectively.
Fig. 3.
Fig. 3.
Isometrically scalable root tip outlines to a parameter-free catenary curve. (A) Isometric scalability of catenary function. Catenary curves [y=a cosh(x/a)a] with a=1, 2 and 4 (left panels) are isometrically scalable into a parameter-free catenary function [Y=cosh(X) − 1, X=x/a, Y=y/a, right panels]. (B) Catenary curves with a=10, 30, 50 and 70 (upper panel). Catenary parameter a of root tip outlines quantified by the NLS method (bottom panel). Arabidopsis PR, mature and emerged LR outlines [n=12 (PR), n=12 (mature LR) and n=11 (emerged LR)], and PR of nine angiosperm species (n=5 for each species) were analyzed. The fitted value of a indicated high reproducibility in Arabidopsis (CV of a ∼14% in PR, ∼7.2% in mature LR and ∼8.5% in emerged LR), consistently with the level of size reproducibility (CV of root tip area in Fig. 1C), and was, on average, 50% larger in the PR than in the LR. The right and left hinges, the middle lines and the error bars of box plots represent the 25th, 75th and 50th percentiles, and s.d., respectively. (C,D) Outlines of Arabidopsis PRs and LRs (left panel in C), and the PRs of ten angiosperm species (left panel in D) were isometrically scalable to a parameter-free catenary curve using distinct catenary parameter a (respective right panels). Samples in C and D are identical data sets to B. Sample sets of Arabidopsis PRs, mature LRs and emerged LRs shown in B and C are identical to those used in Fig. 1B.
Fig. 4.
Fig. 4.
Geometry and mechanics of a catenary-curved dome during LRP tissue growth. (A) Longitudinal confocal sections from time-lapse imaging of a developing Arabidopsis LRP visualized using 35S:Lti6b-GFP (a plasma membrane marker). The elapsed time (h) after gravistimulation for inducing LRP development is indicated in each panel. Red lines indicate LRP dome outlines. (B) A graph of catenary parameter a (y-axis) plotted against dome height h (x-axis) of growing LRP outlines quantified by the NLS method. (C) Cross validation test (Eqn 12) of in vivo and in silico LRP outlines fitted with catenary function. Averaged MSE (y-axis) against the dome height h (x-axis) in vivo [blue, n=10 (h<10), n=10 (10≤h<30), n=10 (30≤h<50), n=10 (50≤h)] and in silico (red, n=5 for each dome height range, h<10, 10≤h<30 and 30≤h<50) are shown. (D) Rules of cell divisions (white, no division; light blue, single division; deep blue, three consecutive divisions) and anisotropic cell expansion in the proximodistal direction (magenta, presence; other colors, absence) observed in the LRP development in vivo. (E) Tissue-mechanical simulation from a flat primordium to dome formation during LRP development with a mass of overlaying cells (gray). Cell division and expansion rules (color-coded as in D) were incorporated into the simulation. See also Movie 1. (F) Catenary curves of different parameter values a with its width (x-axis) approximately equal to that of an actual LRP (Fig. 4A). (G) Catenary curves formed by chains of increasing length with fixed ends under gravity. (H) The mechanics of the catenary curve; the gravity works as vertically uniform force W on the chain, and is balanced with the tangential tension T at the mechanical equilibrium. s, a, x, ρ, g and θ denote chain outline length, catenary parameter, x-coordinate of the catenary chain, mass density, the gravitational acceleration and the angle from horizontal x-axis, respectively. ρg represents the gravitational (vertical) force per unit length. (I) Distribution of vertical force (red arrows) and tangential force (black arrows) on dome outlines after cell expansion in five representative simulations (bottom panel shows a representative outcome; dashed black lines indicate the x- and y-axes). The magnitude of vertical force normalized by its spatial average over the dividing zone (dark blue and light blue cells in the bottom panel) plotted as a function of x-coordinate along the dome width (upper panel). Data are mean±s.d. of five independent simulations. The upper and lower hinges, and the middle lines of box plots in C and I represent the 25th, 75th and 50th percentiles, respectively. Scale bars: 50 µm.
Fig. 5.
Fig. 5.
Localized periclinal cell divisions of LRP determine its dome shape. (A,F) Simulation of (A) the shallow gradient model assuming supernumerary cells in the flanking region (light blue), and (F) the randomized division model assuming randomized cell division orientation in the central domain (dark blue). Division and expansion rules of remaining cells were left unchanged from those used in Fig. 4E. Panels from left to right correspond to LRP shapes observed in vivo at h<10, 10≤h<20, 20≤h<30 and 30≤h<50. See also Movie 1. (B,G) Dome outlines during the in silico simulation of the shallow gradient model (B) and the randomized division model (F). The dome outlines of wild-type templates are derived from Fig. 4E. Colors denote root dome height (µm). (C,H) Averaged MSE from the cross-validation test (Eqn 12) with the catenary curve in simulations (in silico) of wild-type template (blue circles), the shallow gradient model (red circles in C; n=5 for each dome height range, h≤10, 10≤h<30 and 30≤h<50) and the randomized division model (red in H; n=5 for each dome height range, h≤10, 10≤h<30 and 30≤h<50). (D,I) Longitudinal confocal sections of LRP at different developmental stages in puchi-1 (D) and aur1 aur2 (I) mutants (left panels), and their dome outlines plotted in the cartesian coordinate together with an imaginary fitted catenary curve (dotted black line, right panels). Cell walls were stained with SR2200 (white). Red lines and circles indicate LRP dome outlines and cell junctions, respectively. Scale bars: 50 µm. (E,J) Averaged MSE from the cross-validation test with catenary curves for Arabidopsis LRP of wild type (blue circles), puchi-1 [red circles in E; n=21 (h≤10), n=9 (10≤h<30), n=9 (30≤h<50), n=7 (50<h)] and aur1 aur2 mutants [red circles in J; n=9 (h≤10), n=10 (10≤h<30), n=3 (30≤h<50), n=4 (50≤h)]. The upper and lower hinges, the middle lines and error bars of box plots in C, E, H and J represent the 25th, 75th and 50th percentiles, and s.d., respectively. Date sets for wild type used in C, E, H, J were identical to those in Fig. 4C. Statistical significance was determined using Welch's unpaired, one-tailed t-test.

Similar articles

Cited by

References

    1. Abzhanov, A. (2017). The old and new faces of morphology: the legacy of D'Arcy Thompson's ‘theory of transformations’ and ‘laws of growth’. Development 144, 4284-4297. 10.1242/dev.137505 - DOI - PubMed
    1. Aigouy, B., Farhadifar, R., Staple, D. B., Sagner, A., Röper, J.-C., Jülicher, F. and Eaton, S. (2010). Cell flow reorients the axis of planar polarity in the wing epithelium of Drosophila. Cell 142, 773-786. 10.1016/j.cell.2010.07.042 - DOI - PubMed
    1. Akaike, H. (1974). A new look at the statistical model identification. IEEE Trans Automat Contr. 19, 716-723. 10.1109/TAC.1974.1100705 - DOI
    1. Bassel, G. W., Stamm, P., Mosca, G., Barbier de Reuille, P., Gibbs, D. J., Winter, R., Janka, A., Holdsworth, M. J. and Smith, R. S. (2014). Mechanical constraints imposed by 3D cellular geometry and arrangement modulate growth patterns in the Arabidopsis embryo. Proc. Natl. Acad. Sci. U.S.A. 111, 8685-8690. 10.1073/pnas.1404616111 - DOI - PMC - PubMed
    1. Block, P., DeJong, M. and Ochsendorf, J. (2006). As hangs the flexible line: equilibrium of masonry arches. Nexus Netw J. 8, 13-24. 10.1007/s00004-006-0015-9 - DOI

Publication types

MeSH terms