. 2021 Feb 26;12(2):218.
doi: 10.1038/s41419-021-03507-z.

Targeted de-repression of neuronal Nrf2 inhibits α-synuclein accumulation

Affiliations

Targeted de-repression of neuronal Nrf2 inhibits α-synuclein accumulation

Paul S Baxter et al. Cell Death Dis. .

Abstract

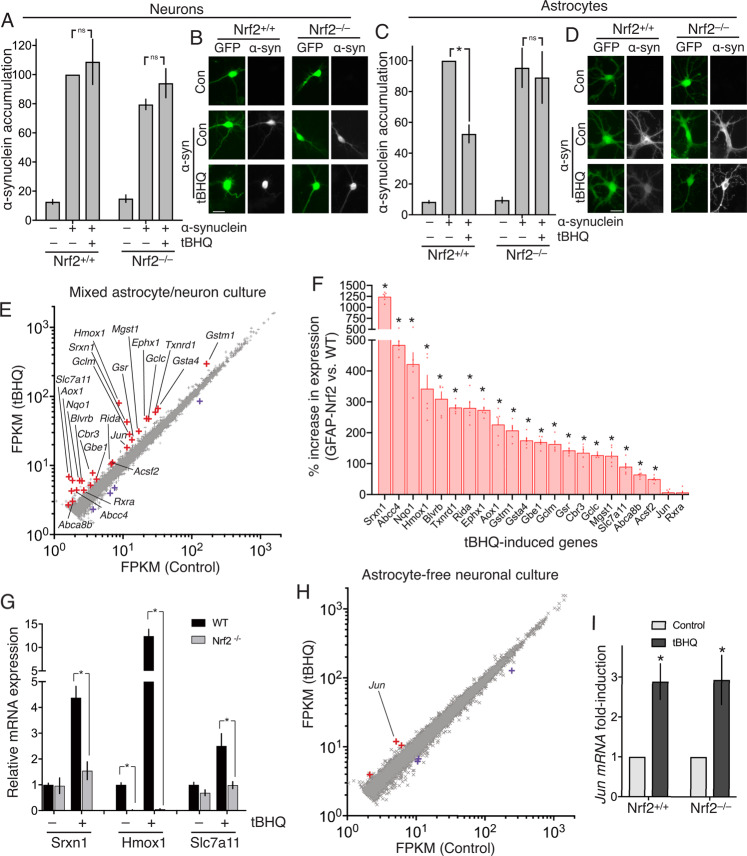
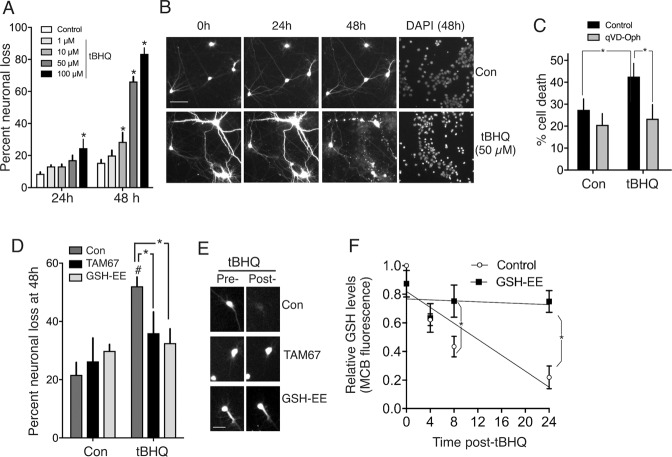
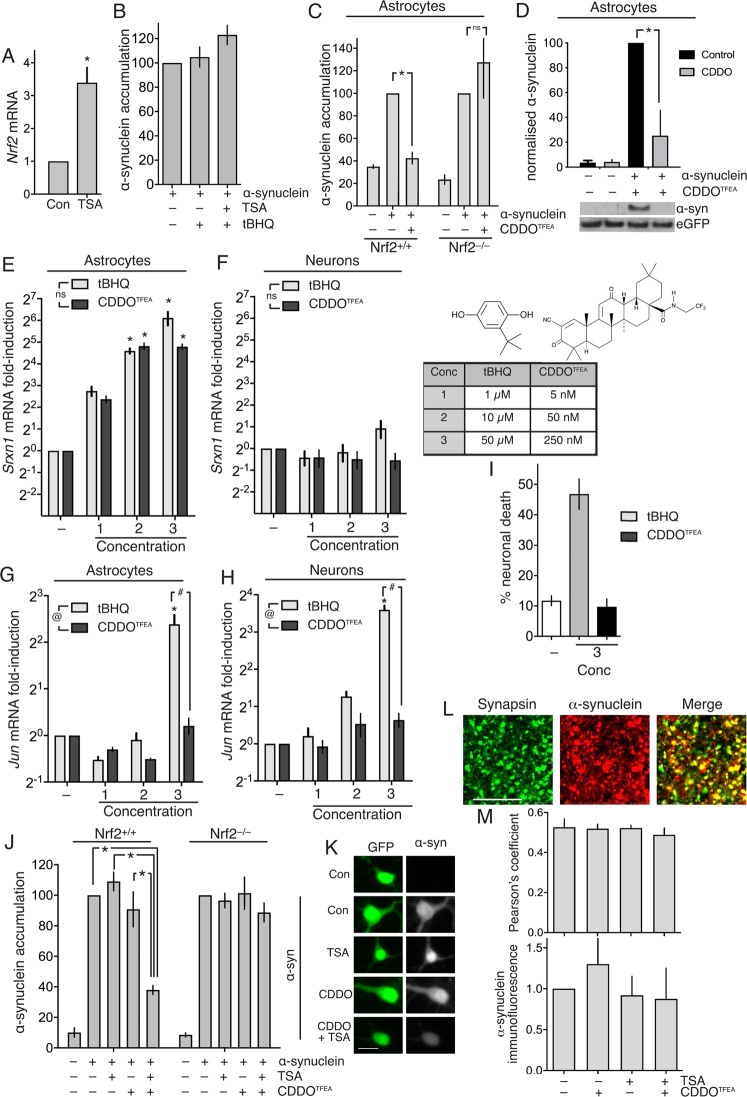
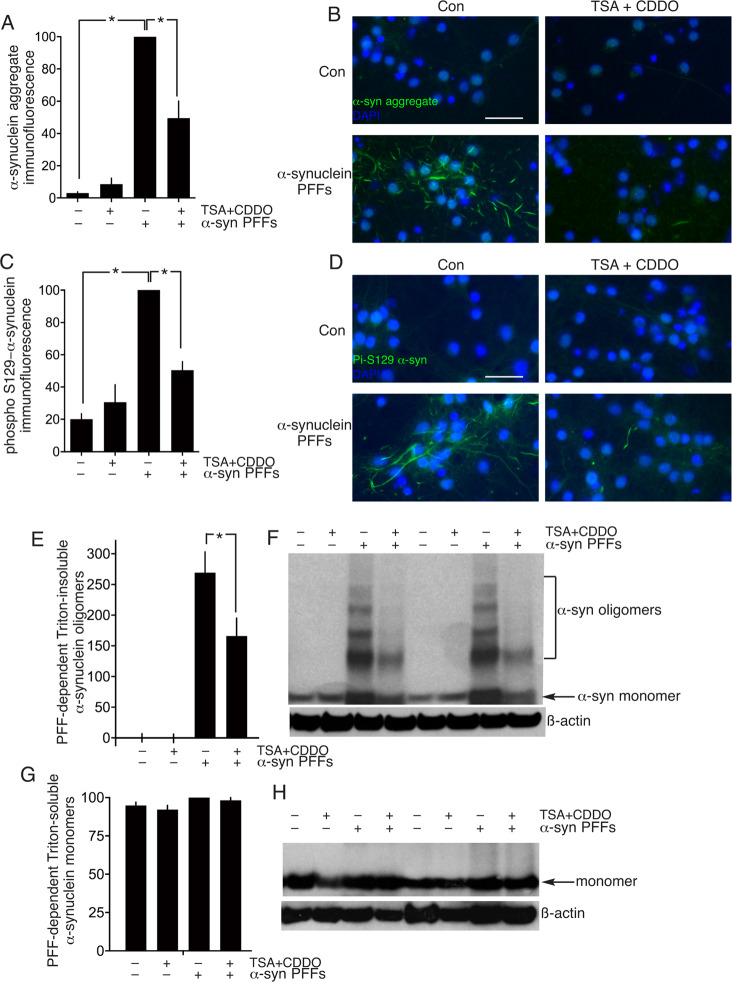
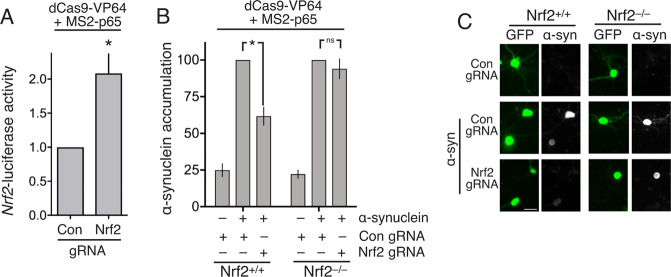
Many neurodegenerative diseases are associated with neuronal misfolded protein accumulation, indicating a need for proteostasis-promoting strategies. Here we show that de-repressing the transcription factor Nrf2, epigenetically shut-off in early neuronal development, can prevent protein aggregate accumulation. Using a paradigm of α-synuclein accumulation and clearance, we find that the classical electrophilic Nrf2 activator tBHQ promotes endogenous Nrf2-dependent α-synuclein clearance in astrocytes, but not cortical neurons, which mount no Nrf2-dependent transcriptional response. Moreover, due to neuronal Nrf2 shut-off and consequent weak antioxidant defences, electrophilic tBHQ actually induces oxidative neurotoxicity, via Nrf2-independent Jun induction. However, we find that epigenetic de-repression of neuronal Nrf2 enables them to respond to Nrf2 activators to drive α-synuclein clearance. Moreover, activation of neuronal Nrf2 expression using gRNA-targeted dCas9-based transcriptional activation complexes is sufficient to trigger Nrf2-dependent α-synuclein clearance. Thus, targeting reversal of the developmental shut-off of Nrf2 in forebrain neurons may alter neurodegenerative disease trajectory by boosting proteostasis.


Conflict of interest statement

The authors declare no competing interests.

Figures

Fig. 1
Fig. 1. Endogenous Nrf2 cannot clear α-synuclein or support an Nrf2-dependent transcriptional response in neurons, unlike astrocytes.
DIV10 (Days In Vitro) mixed neuron/astrocyte cultures were transfected on DIV3 with vectors encoding eGFP, plus either α-synuclein (pCAGS- α-synuclein) or a ß-globin control. 5 days post-transfection, cells were treated ± tBHQ (10 µM) for 24 h, fixed, and subjected to immunofluorescence cytochemistry (anti- α-synuclein antibody) (BD Transduction Laboratories, #610878 (1:1000)). Immunofluorescence images were taken and quantified (blind). Neurons and astrocytes were distinguished morphologically (astrocytes have larger nuclei, thick proximal processes, and an absence of axons), a method that was validated separately using neuronal (NeuN) and astrocytic (GFAP) markers. A, B Analysis and example pictures of neurons. 43-77 cells per condition, n = 4 independent experiments. Scale bar: 25 µm. C, D Analysis and example pictures of astrocytes. *P = 0.004 2-way ANOVA plus Tukey’s post-hoc test; n = 4 independent experiments (22–30 cells analysed for each condition). Scale bar: 25 µm. E DIV10 mixed neuron/astrocyte cultures were treated ± tBHQ (10 µM,) for 8 h, RNA extracted and subjected to RNA-seq analysis (ca. 35 × 106 paired-end reads/sample, 3 biological replicates; EBI ref: E-MTAB-5688). Mean data for the 11,698 genes expressed on average >2 FPKM is plotted. Differentially expressed genes (DESeq2 v1.6.3, Benjamini-Hochberg-adjusted P value < 0.05) are highlighted red (induced) or blue (repressed). Genes induced >1.5-fold are labelled. F Genes labelled in red in 1e were cross referenced to RNA-seq data from astrocytes over-expressing Nrf2 (FAC-sorted from the GFAP-Nrf2 mouse). Of the 22 genes that were expressed in this GFAP-Nrf2 RNA-seq data set >2 FPKM, the % difference in GFAP-Nrf2 astrocytes (vs. WT) is shown. *(p_adj<0.01, n = 5, see Supplemental Table S1 for exact p values). G qPCR analysis of the indicated genes in RNA extracted from mixed cultures of the indicated genotypes, treated with tBHQ as in 1e. * P value < 0.05 t test, n = 3–5 per condition. H Experiment performed as in (E) except that astrocyte-free neuronal cultures were employed. All 10,845 genes expressed on average >2 FPKM are plotted, and differentially expressed genes (DESeq2 v1.6.3, Benjamini-Hochberg-adjusted P value < 0.05) are highlighted red (induced) or blue (repressed). I Astrocyte-free Nrf2+/+ or Nrf2–/– cortical neurons were treated as in (F) and Jun mRNA expression analysed (by qPCR). *P = 0.005, 0.004 (reading left-to-right here and throughout the manuscript), 1-way ANOVA plus Sidak’s post-hoc test (n = 6).
Fig. 2
Fig. 2. TBHQ promotes Jun-dependent neurotoxicity.
A, B GFP-transfected cortical neuronal cultures were imaged at the indicated times post-tBHQ treatment, fixed/DAPI-stained, and viability assessed (death = cell disappearance or neurite fragmentation). *P = 0.004, 0.021, 0.0001, 0.0001; 2-way ANOVA + Dunnett’s post-hoc test, 72-121 cells analysed per condition; n = 4 independent biological replicates. C Cells were treated ± 50 µM tBHQ ± qVD-Oph (50 µM) and cell death analysed 24 h later. *P = 0.013, 0.0056, 2-way ANOVA + Sidak’s post-hoc test (n = 4 independent experiments, 481–582 cells analysed per condition). D, E Astrocyte-free neuronal cultures were transfected with eGFP plus either a control vector (ß-globin) or TAM67. The cells were treated with GSH-EE (1 mM) for 1 h where indicated, and then ±50 µM tBHQ. Cell viability was assessed 48 h later. #P = 0.0012, 2-way ANOVA + Sidak’s post-hoc test (comparing Control to tBHQ conditions). NB. No significant effect of tBHQ on cell death was observed in TAM67-transfected neurons or GSH-EE treated neurons (relative to corresponding control condition). *P (left-to-right) =0.045 and 0.013, 2-way ANOVA + Sidak’s post-hoc test, n = 6 independent experiments (130-166 cells were analysed per treatment). F Neurons were treated with tBHQ (50 µM) for the indicated times and reduced glutathione levels measured using the monochlorobimane method (See and “Methods”). *P = 0.0436, 0.0003, 2-way ANOVA + Sidak’s post-hoc test (n = 4).
Fig. 3
Fig. 3. The triterpenoid CDDOTFEA can drive α-synuclein in neurons after epigenetic derepression of Nrf2.
A Astrocyte-free neuron cultures were treated ± 1 µM TSA for 16 h and Nrf2 mRNA expression analysed. *P = 0.035 (Student’s t test, n = 3). B Neuronal cultures were transfected on DIV3 with eGFP, plus vectors encoding either α-synuclein or a ß-globin control. 5 days post-transfection, cells were treated ± TSA (1 µM) for 8 h, and subsequently (where indicated) with 10 µM tBHQ for 24 h. Cells were then fixed and processed for α-synuclein immunofluorescence (n = 3-5). C Experiment performed as in Fig. 1c except that CDDOTFEA (250 nM) was employed instead of tBHQ. *P = 0.033, 2-way ANOVA + Sidak’s post-hoc test (n = 4). D Experiment performed as in Fig. 3c except that western blotting was performed to study α-synuclein levels, rather than immunofluorescence, and only WT astrocytes studied. *P = 0.0003, 2-way ANOVA + Sidak’s post-hoc test (n = 5). Cortical astrocyte cultures (E) or astrocyte-free neuronal cultures (F) were treated with different concentrations of tBHQ or CDDOTFEA for 8 h, RNA harvested and expression of the Srxn1 measured by qPCR, normalized to Rpl13a. *P values: 0.003, 0.0009, <0.0001, 0.001,0.006, <0.0001; 2-way ANOVA + Dunnett’s post-hoc test (n = 5). Concentrations 1, 2, 3 of tBHQ are 1,10, and 50 µM; concentrations 1, 2, 3 of CDDOTFEA are 5, 50, and 250 nM as shown in the table inset in (F), as are the structures of tBHQ and CDDOTFEA. G Same samples as in (E), analysed for Jun levels. @P = 0.0045 (major drug effect, 2-way ANOVA); #P < 0.0001 (Sidak’s posthoc test); *P <0.0001, <0.0001, 0.001 (Sidak’s posthoc test, n = 5). H Same samples as in (F), analysed for Jun levels. @P = 0.0027 (major drug effect, 2-way ANOVA); #P < 0.0001 (Sidak’s posthoc test); *P < 0.0001, <0.0001, <0.0001 (Sidak’s posthoc test), (n = 5). I GFP-transfected astrocyte-free cortical neuronal cultures (DIV10 17) were imaged before and 24 h post-tBHQ (50 µM) or post- CDDOTFEA (250 nM) treatment, fixed/DAPI-stained, and viability assessed. *P = 0.0001, <0.0001, 1-way ANOVA plus Tukey’s post-hoc test, 76–86 cells analysed per condition (n = 4). J, K Neuronal cultures (WT and Nrf2 KO) were transfected on DIV3 with eGFP, plus vectors encoding either α-synuclein or a ß-globin control. 5 days post-transfection, cells were treated ± TSA (1 µM) for 8 h, and subsequently (where indicated) with 250 nM CDDOTFEA for 24 h. Cells were then fixed and processed for α-synuclein immunofluorescence as for Fig. 1. *P < 0.0001, 1-way ANOVA + Dunnett’s post-hoc test 68–162 cells analysed per condition across n = 4 independent experiments. K shows example pictures. L Example pictures showing the co-localisation of synapsin and endogenous α-synuclein in puncta of a size consistent with being pre-synaptic boutons (scale bar=10 µm). M Neurons were treated as indicated, similarly to Fig. 3h, and after 24 h cells were fixed and endogenous synapsin and endogenous α-synuclein analysed by immunofluorescence, and Pearson’s colocalization coefficient calculated (ImageJ JACoP plugin, n = 3).
Fig. 4
Fig. 4. CDDOTFEA and HDAC inhibition promote clearance of α-synuclein aggregates.
A–D Neuronal cultures were exposed where indicated to α-synuclein pre-formed fibrils (PFFs) on DIV4 until DIV15 to cause α-synuclein aggregate formation. On DIV15 the neurons were treated where indicated with TSA (1 µM, 8 h) followed by CDDOTFEA (250 nM, 24 h). Neurons were fixed and processed for immunofluorescence using an α-synuclein aggregate conformation-specific antibody (A, B) or a phospho-(Ser-129)- α-synuclein specific antibody (C, D) A: *P = 1.5E–09, 9.5.E–06, 1-way ANOVA + Sidak’s post-hoc test (n = 5); C: *P = 1.1E–06, 1.2E–04, 1-way ANOVA + Sidak’s post-hoc test (n = 4). B and D show example pictures relating to (A) and (C) respectively. Scale bar: 50 µm. E, F Neuronal cultures were treated as per (AD), Triton-insoluble proteins were extracted (see “Methods”) and western analysis of oligomeric α-synuclein performed, normalized to ß-actin. *P = 0.0035, 1-way ANOVA + Sidak’s post-hoc test (n = 8). G, H Neuronal cultures were treated as per (E), except that Triton-soluble proteins were extracted (see “Methods”) and α-synuclein monomer expression quantified normalized to ß-actin (n = 8).
Fig. 5
Fig. 5. dCas9-based transcriptional activation complexes targeted to the Nrf2 promoter induce α-synuclein clearance.
A Neurons were transfected at DiV 8 with dCas9-VP64, p65 and sgRNAs targeting the Nrf2 promoter (controls were empty sgRNA vectors) with Nrf2-promoter Firefly luciferase and TK-Renilla control. Luciferase activity was measured at 96 h. *P = 0.032, Student’s t test (n = 4). B Nrf2+/+ and Nrf2−/− cortical neurons were transfected as in (A) in addition to α-synuclein expression vector and eGFP transfection marker. At Div 11 cells were fixed and processed for GFP and α-synuclein immunofluorescence as for Fig. 1. *P = 0.001, 2-Way ANOVA + Bonferroni’s multiple comparison test, 192–573 cells analysed per condition (n = 7 WT and 5 Nrf2 KO). C Example pictures.

References

    1. Tebay LE, et al. Mechanisms of activation of the transcription factor Nrf2 by redox stressors, nutrient cues, and energy status and the pathways through which it attenuates degenerative disease. Free Radic. Biol. Med. 2015;88(Pt B):108–146. doi: 10.1016/j.freeradbiomed.2015.06.021. - DOI - PMC - PubMed
    1. Kobayashi EH, et al. Nrf2 suppresses macrophage inflammatory response by blocking proinflammatory cytokine transcription. Nat. Commun. 2016;7:11624. doi: 10.1038/ncomms11624. - DOI - PMC - PubMed
    1. Taguchi K, Yamamoto M. The KEAP1-NRF2 system in cancer. Front Oncol. 2017;7:85. doi: 10.3389/fonc.2017.00085. - DOI - PMC - PubMed
    1. Johnson DA, Johnson JA. Nrf2–a therapeutic target for the treatment of neurodegenerative diseases. Free Radic. Biol. Med. 2015;88(Pt B):253–267. doi: 10.1016/j.freeradbiomed.2015.07.147. - DOI - PMC - PubMed
    1. Kobayashi A, et al. Oxidative and electrophilic stresses activate Nrf2 through inhibition of ubiquitination activity of Keap1. Mol. Cell Biol. 2006;26:221–229. doi: 10.1128/MCB.26.1.221-229.2006. - DOI - PMC - PubMed

Publication types

MeSH terms