. 2021 Feb 26;12(2):217.
doi: 10.1038/s41419-021-03508-y.

SIRT1 attenuates sepsis-induced acute kidney injury via Beclin1 deacetylation-mediated autophagy activation

Affiliations

SIRT1 attenuates sepsis-induced acute kidney injury via Beclin1 deacetylation-mediated autophagy activation

Zhiya Deng et al. Cell Death Dis. .

Abstract

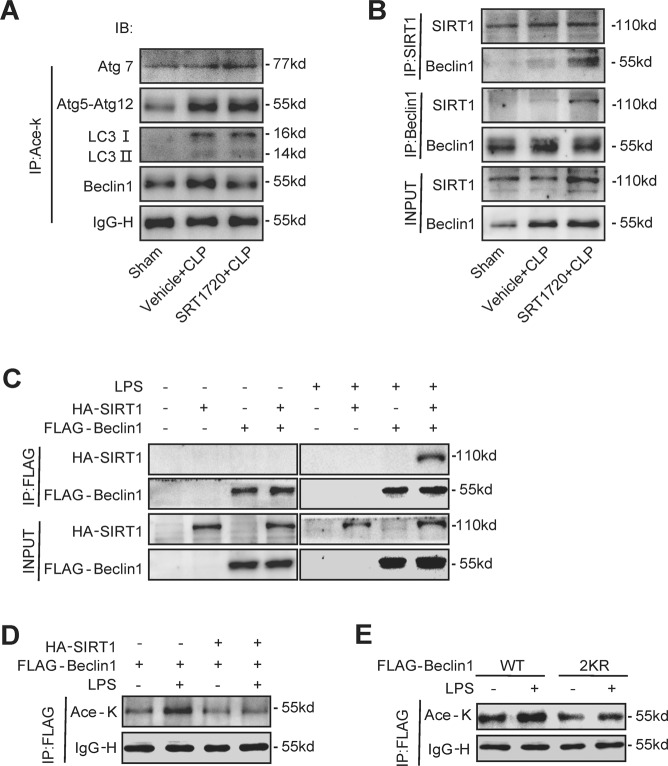
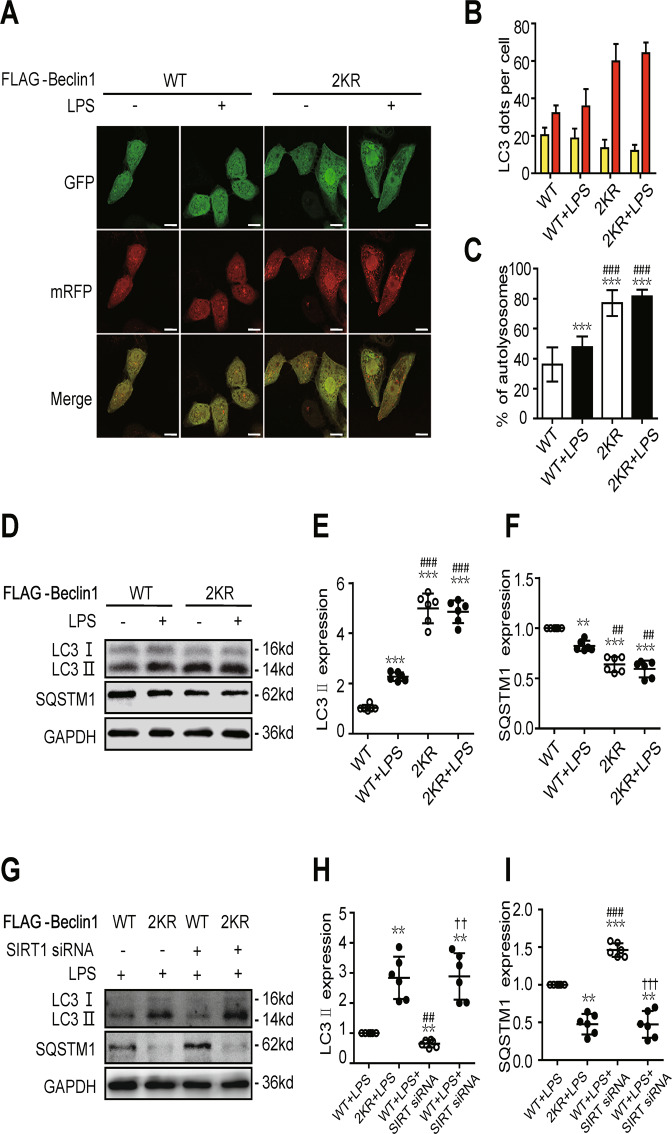
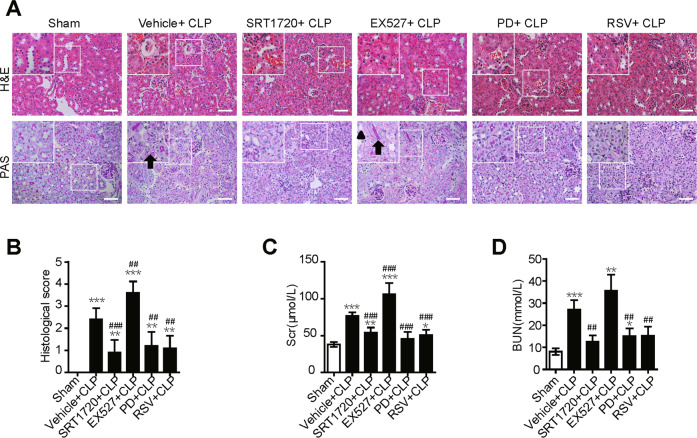
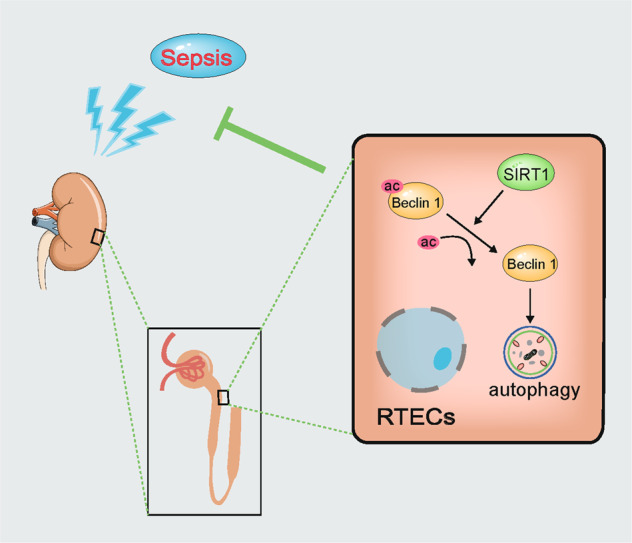
Our previous studies showed that silent mating-type information regulation 2 homologue-1 (SIRT1, a deacetylase) upregulation could attenuate sepsis-induced acute kidney injury (SAKI). Upregulated SIRT1 can deacetylate certain autophagy-related proteins (Beclin1, Atg5, Atg7 and LC3) in vitro. However, it remains unclear whether the beneficial effect of SIRT1 is related to autophagy induction and the underlying mechanism of this effect is also unknown. In the present study, caecal ligation and puncture (CLP)-induced mice, and an LPS-challenged HK-2 cell line were established to mimic a SAKI animal model and a SAKI cell model, respectively. Our results demonstrated that SIRT1 activation promoted autophagy and attenuated SAKI. SIRT1 deacetylated only Beclin1 but not the other autophagy-related proteins in SAKI. SIRT1-induced autophagy and its protective effect against SAKI were mediated by the deacetylation of Beclin1 at K430 and K437. Moreover, two SIRT1 activators, resveratrol and polydatin, attenuated SAKI in CLP-induced septic mice. Our study was the first to demonstrate the important role of SIRT1-induced Beclin1 deacetylation in autophagy and its protective effect against SAKI. These findings suggest that pharmacologic induction of autophagy via SIRT1-mediated Beclin1 deacetylation may be a promising therapeutic approach for future SAKI treatment.


Conflict of interest statement

The authors declare no competing interests.

Figures

Fig. 1
Fig. 1. Dynamic changes in autophagy in an animal model of SAKI.
A Pathological observation of the kidney cortex after H&E staining (upper panel) and PAS staining (lower panel). The irregular brush border (arrow) and ectasia of affected tubules (arrowheads) were observed following CLP surgery (upper panel: 200×; inset: 400×; scale bar = 10 μm). B The tubular damage score was evaluated based on pathological observation (n = 10). C Apoptosis was semi-quantitatively analysed by TUNEL-positive cell staining (upper panel: 200×; lower panel: 400×; scale bar = 5 μm). D The number of TUNEL-positive cells (n = 10). E Morphological observation of autophagy in the kidney cortex under an electron microscope (black arrow: autophagosomes; Mito: mitochondrion; upper panel: magnified ×8000 and scale bar = 2 μm; lower panel: magnified ×20000 and scale bar = 1 μm). F The number of autophagosomes in renal epithelial cells was calculated in 20 randomly selected fields (n = 20). GJ Representative western blot with densitometric analysis of Beclin1, LC3 II and SQSTM1 protein expression (n = 6). The data are presented as the mean ± SD. *p < 0.05, **p < 0.01 and ***p < 0.001 vs the 0-h group. SAKI sepsis-induced acute kidney injury, CLP caecal ligation and puncture, PAS periodic acid–Schiff staining, H&E haematoxylin–eosin staining, TUNEL terminal deoxynucleotidyl transferase dUTP nick end labelling staining, GAPDH glyceraldehyde 3-phosphate dehydrogenase.
Fig. 2
Fig. 2. Activation of autophagy protects against SAKI in RTECs.
Autophagy activation or inhibition by pretreatment with Rapa or 3-MA, respectively. The samples were collected 12 h after CLP-induced SAKI. A, B The number of autophagosomes in renal epithelial cells was calculated in 20 randomly selected fields using a transmission electron microscope (black arrow: autophagosomes; Mito: mitochondrion; upper panel: magnified ×8000 and scale bar = 2 μm; lower panel: magnified ×20000 and scale bar = 1 μm, n = 20). C The irregular brush border (arrow) and ectasia of affected tubules (arrowheads) were observed by H&E staining (upper panel, 200×; inset: 400×; scale bar = 10 μm) and PAS staining (lower panel, 200×; inset: 400×; scale bar = 10 μm) of the kidney cortex. D The tubular damage score was evaluated based on H&E and PAS staining (n = 10). E Scr levels (n = 6). F Serum BUN levels (n = 6). The data are presented as the mean ± SD. *p < 0.05, **p < 0.01 and ***p < 0.001 vs the sham group; #p < 0.05, ##p < 0.01 and ###p < 0.001 vs the vehicle + CLP group. RTECs renal tubular epithelial cells, SAKI sepsis-induced acute kidney injury, CLP caecal ligation and puncture, PAS periodic acid-Schiff staining, H&E haematoxylin–eosin staining, Rapa rapamycin, Scr serum creatinine, BUN urea nitrogen.
Fig. 3
Fig. 3. SIRT1 attenuates SAKI by promoting autophagy.
Mice was pretreated with SRT1720 or Ex527 for 2 h before CLP surgery to activate or inhibit SIRT1, respectively. Kidney tissue samples were collected 12 h after CLP surgery. A, B The kidney cortex was observed and the number of autophagosomes was calculated in 20 randomly selected fields using a transmission electron microscope (black arrow: autophagosomes; Mito: mitochondrion; upper panel: magnified ×8000 and scale bar = 2 μm; lower panel: magnified ×40000 and scale bar = 1 μm, n = 20). CF Representative western blot and densitometric analysis of Beclin1, LC3 II and SQSTM1 protein expression (n = 6). The data are presented as the mean ± SD. *p < 0.05, **p < 0.01 and ***p < 0.001 vs the sham group; ##p < 0.01, ###p < 0.001 vs the vehicle + CLP group. SAKI sepsis-induced acute kidney injury, CLP caecal ligation and puncture, SQSTM1 sequestosome 1, GAPDH glyceraldehyde 3-phosphate dehydrogenase.
Fig. 4
Fig. 4. Dynamic changes in autophagy in a SAKI cell model.
HK-2 cells were treated with different concentrations of LPS (2, 4, 8 and 12 h with 10 μg/ml). A Autophagy increased in a time-dependent manner following LPS challenge, peaked at 8 h and then gradually decreased. HK-2 cells were infected with an adenovirus expressing mRFP-GFP-LC3 (magnification ×630 and scale bar = 20 μm). B Mean numbers of autophagosomes (yellow dots per cell in merged images) and autolysosomes (red dots per cell in merged images) were calculated in 20 randomly selected cells (n = 20). C The percentage of autolysosomes (free red spots/(yellow spots+free red spots) per cell) was calculated in 20 randomly selected cells to determine autophagic flux (n = 20). DG Representative western blots and densitometric analysis of Beclin1, LC3 II and SQSTM1 protein expression (n = 6). The data are presented as the mean ± SD. *p < 0.05, **p < 0.01 and ***p < 0.001 vs the 0-h group. H Autophagic flux determination and analysis: HK-2 cells were infected with an adenovirus expressing mRFP-GFP-LC3 (magnification ×630 and scale bar = 20 μm). I Mean numbers of autophagosomes (yellow dots per cell in merged images) and autolysosomes (red dots per cell in merged images) was calculated in 20 randomly selected cells (n = 20). J The percentage of autolysosomes (free red spots/(yellow spots + free red spots) per cell) were calculated in 20 randomly selected cells to determine autophagic flux (n = 20). SIRT1 activation or inhibition was performed by pretreatment with SRT1720 or EX527 for 2 h, respectively. Samples were collected 12 h after LPS stimulation. The data are presented as the mean ± SD. ***p < 0.001 vs the control group, ###p < 0.001 vs the vehicle + LPS group. KN Representative western blots and densitometric analysis of the autophagy-related proteins Beclin1, LC3 II and SQSTM1 proteins (n = 6). The data are presented as the mean ± SD. **p < 0.01 and ***p < 0.001 vs the control group; ###p < 0.001 vs the LPS group; †††p < 0.001 vs the GFP-Con + LPS group. SAKI sepsis-induced acute kidney injury, LPS lipopolysaccharide, SQSTM1 sequestosome 1, SIRT1 silent mating-type information regulation 2 homologue-1, GAPDH glyceraldehyde 3-phosphate dehydrogenase.
Fig. 5
Fig. 5. SIRT1 activation promotes the deacetylation of Beclin1 but not the other autophagy-related proteins.
The mice were euthanized 12 h after CLP-induced SAKI. A The acetylation levels of Atg5–Atg12, Atg7, LC3 and Beclin1 and representative western blots are shown. The kidney samples were immunoprecipitated with anti-acetyl-lysine antibodies to analyse the acetylation of Atg5–Atg12, Atg7, LC3 and Beclin1. B Association of Beclin1 with SIRT1 in the SAKI animal model. The interaction between Beclin1 and SIRT1 was determined by Co-IP. C Association of Beclin1 with SIRT1 in the SAKI cell model. HA-tagged SIRT1 and FLAG-tagged Beclin1 were individually transfected into HK-2 cells with or without LPS stimulation. The interaction between Beclin1 and SIRT1 was determined by Co-IP. D The acetylation of Beclin1 after SIRT1 overexpression was examined by immunoprecipitation and western blotting. E The acetylation of Beclin1 markedly decreased after double mutation of K430 and K437. FLAG-tagged Beclin1 (WT, 2KR) was transfected into HK-2 cells with or without LPS stimulation. The acetylation of Beclin1 was examined in immunoprecipitation assays and representative western blots are shown. SAKI sepsis-induced acute kidney injury, LPS lipopolysaccharide, Co-IP Co-immunoprecipitation, SIRT1 silent mating-type information regulation 2 homologue-1.
Fig. 6
Fig. 6. SIRT1 activates autophagy via the deacetylation of Beclin1.
A In autophagic flux determination and analysis, HK-2 cells were infected with an adenovirus expressing mRFP-GFP-LC3 (magnification ×630 and scale bar = 20 μm). B Mean numbers of autophagosomes (yellow dots per cell in merged images) and autolysosomes (red dots per cell in merged images) were calculated in 20 randomly selected cells (n = 20). C The percentage of autolysosomes (free red spots/(yellow spots + free red spots) per cell) was calculated in 20 randomly selected cells to determine autophagic flux (n = 20). The data are presented as the mean ± SD. ***p < 0.001 vs WT Beclin1 over-expression control (WT group); ###p < 0.001 vs the WT + LPS group. DF Representative western blots and densitometric analysis of the autophagy-related proteins Beclin1, LC3 II and SQSTM1 (n = 6). The data are presented as the mean ± SD. **p < 0.01 and ***p < 0.001 vs the WT group; ##p < 0.01 and ###p < 0.001 vs the WT + LPS group. GI Representative western blots of the autophagy-related proteins (LC3 II and SQSTM1) after SIRT1 knockdown or double mutation of Beclin1 (n = 6). The data are presented as the mean ± SD. **p < 0.01 vs the WT + LPS group; ##p < 0.01 and ###p < 0.001 vs the 2KR + LPS group; ††p < 0.01 and †††p < 0.001 vs the WT + LPS + SIRT1 siRNA group. SAKI sepsis-induced acute kidney injury, LPS lipopolysaccharide, SIRT1 silent mating-type information regulation 2 homologue-1, SQSTM1 sequestosome 1, GAPDH glyceraldehyde 3-phosphate dehydrogenase.
Fig. 7
Fig. 7. SIRT1 activation attenuates SAKI.
SIRT1 activation by pretreatment with SRT1720, PD, RSV and SIRT1 inhibition pre-treated with EX527 for 2 h, respectively. A Pathological observation of kidney tissue. H&E staining of kidney cortex (upper panel, 200×; inset: 400×; scale bar = 10 μm) and PAS staining of kidney cortex (lower panel, 200×; inset: 400×; scale bar = 10 μm). The irregular brush border (arrow) and ectasia of the affected tubules (arrowheads) was observed. B Tubular damage scores were evaluated based on H&E and PAS staining (n = 10). C Scr levels (n = 6). D Serum BUN levels (n = 6). Values shown are the mean ± SD. *p < 0.05, **p < 0.01 and ***p < 0.001 vs the sham group; ##p < 0.01 and ###p < 0.001 vs the vehicle + CLP group. SAKI sepsis-induced acute kidney injury, CLP caecal ligation and puncture, SIRT1 silent mating-type information regulation 2 homologue-1, PD polydatin, RSV resveratrol, PAS periodic acid-Schiff staining, H&E haematoxylin-eosin staining, Scr Serum creatinine, BUN urea nitrogen.
Fig. 8
Fig. 8. The effect of SIRT1-mediated Beclin1deacetylation induces autophagy in attenuating sepsis-induced acute kidney injury (SAKI).
RTECs renal tubular epithelial cells, Ac acetylation.

Similar articles

Cited by

References

    1. Singer M, et al. The third international consensus definitions for sepsis and septic shock (Sepsis-3) JAMA. 2016;315:801–810. doi: 10.1001/jama.2016.0287. - DOI - PMC - PubMed
    1. Poston JT, Koyner JL. Sepsis associated acute kidney injury. BMJ. 2019;364:k4891. doi: 10.1136/bmj.k4891. - DOI - PMC - PubMed
    1. Mayeux PR, MacMillan-Crow LA. Pharmacological targets in the renal peritubular microenvironment: implications for therapy for sepsis-induced acute kidney injury. Pharmacol. Ther. 2012;134:139–155. doi: 10.1016/j.pharmthera.2012.01.004. - DOI - PMC - PubMed
    1. Kaushal GP, Shah SV. Autophagy in acute kidney injury. Kidney Int. 2016;89:779–791. doi: 10.1016/j.kint.2015.11.021. - DOI - PMC - PubMed
    1. Howell GM, et al. Augmenting autophagy to treat acute kidney injury during endotoxemia in mice. PLoS ONE. 2013;8:e69520. doi: 10.1371/journal.pone.0069520. - DOI - PMC - PubMed

Publication types

MeSH terms