Review
. 2021 Feb 26;10(1):42.
doi: 10.1038/s41377-021-00471-3.

Review of biosensing with whispering-gallery mode lasers

Affiliations
Review

Review of biosensing with whispering-gallery mode lasers

Nikita Toropov et al. Light Sci Appl. .

Abstract

Lasers are the pillars of modern optics and sensing. Microlasers based on whispering-gallery modes (WGMs) are miniature in size and have excellent lasing characteristics suitable for biosensing. WGM lasers have been used for label-free detection of single virus particles, detection of molecular electrostatic changes at biointerfaces, and barcode-type live-cell tagging and tracking. The most recent advances in biosensing with WGM microlasers are described in this review. We cover the basic concepts of WGM resonators, the integration of gain media into various active WGM sensors and devices, and the cutting-edge advances in photonic devices for micro- and nanoprobing of biological samples that can be integrated with WGM lasers.


Conflict of interest statement

The authors declare that they have no conflict of interest. All figures were reproduced with corresponding permissions provided by publishers.

Figures
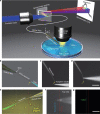
Fig. 1
Fig. 1. Example of nanoprobing using optical fibres combined with waveguiding materials tagged with fluorescent QDs.
a Diagram of a nanowire-based cell endoscope; b diagram of a blue laser waveguided through a SnO2 nanowire attached to the tip of an optical fibre; c, d dark-field images of the nanowire-based cell endoscope before (c) and during (d) deformation by a tungsten needle to demonstrate its flexibility and robustness. The yellow arrows in bd indicate the position of the nanowire tip where light emission into free space occurs. eg Intensity emission profiles for an endoscope immersed in a cell culture medium, in which fluorescent proteins are illuminated with blue light from the nanowire tip; e diagram, f top-view dark-field image, and g top-view fluorescence image (a 442 nm longpass filter was applied). Scale bars 50 μm. Reproduced from ref.
Fig. 2
Fig. 2. Schematic drawing of the optical setup used for remote readout with active GaAs semiconductor photonic crystal nanocavities doped with InAs QDs.
The box depicts some of the potential sensing modes, e.g., label-free protein detection (left panels). False-colour SEM micrographs of an actual photonic crystal used for streptavidin (SA)-biotin-binding experiments (right panels i and ii)
Fig. 3
Fig. 3. Microscopy images illustrating the construction of a living nanoprobe from yeast and bacteria single units, together with a sequence of actual use for probing a single leukaemia cell.
a Bionanospear assembled on an optical fibre using single yeast and five L. acidophilus cells. bd Dark-field images showing b 532 nm (green) light, c 644 nm (red) light and d 473 nm (blue) light propagating through the bionanospear and focused into subwavelength dimension spots (insets show line intensity profiles for the lateral direction in the spots). fi Local fluorescence excitation/detection from a single leukaemia cell in human blood using the bionanospear. f Dark-field optical image of the bionanospear and leukaemia cell separated by a 3-μm gap. jn Flexibility testing by pushing the bionanospear against the cell membrane of a leukaemia cell. Reproduced from ref.
Fig. 4
Fig. 4. Illustration of the use of microdisk resonators (so-called laser particles or LPs) for cell tracking in a tumour spheroid upon internalisation.
a Optical microscopy images of a tumour taken at different evolution times (12, 60 and 108 h). b Colour-coded tagged image (each colour corresponding to a given wavelength) of the spatial distribution within the tumour. c Mapped trajectories of selected microdisks, with a sampling rate of 1 h. d Trajectories corresponding to single parental cells (P) separating (marked by arrows) into two descendant cells (F′ and F′′). e Representative paths of cells classified according to measured average motility: high motility (top 25%) and low motility (bottom 25%). Initial positions are marked with a colour-coded circle depending on the wavelength; the path colour denotes the elapsed time over 128 h. Grey dots denote the positions of all microdisks at 12 h. Reproduced from ref.
Fig. 5
Fig. 5. Illustration and microscopic images of the procedure followed to obtain oil microdroplets within single cells.
a Schematic diagram of the injection of a PPE droplet into the cytoplasm of a cell. b Confocal fluorescence image of a cell containing a PPE droplet doped with Nile red dye (red). The nucleus of the cell can be seen in blue. c Bright-field (left) and laser output (right) images of a cell containing a PPE droplet. d Typical output spectrum of the lasing modes. e Time-lapse variation in the output spectrum for a live cell (left) and a dead cell fixed with formaldehyde (right). Adapted from ref.
Fig. 6
Fig. 6. Real-time tracking of individual cell contractility through changes in the refractive index with both internalised WGM microbeads and extracellular microbeads in contact with the cell membrane for nonphagocytic adult cardiomyocytes.
a Continuous single-cell monitoring with an intracellular microbead over 10 min (top) at 2 nJ/pulse, and magnification of the 20 s window indicated by the red rectangle (bottom). b 3D arrangement of myofibrils around microbeads in neonatal cardiomyocytes (CMs). Cell nucleus (magenta) and microlaser (green). c WGM spectrum of a microlaser showing multimode lasing (left). Illustration of the redshift in the lasing wavelength upon CM contraction (right). d Microlaser attached to the atrium of a zebrafish heart (3 days post-fertilisation); scale bar 200 µm. e Average refractive index change (Δηext) between the resting phase (diastole) and peak contraction (systole) for 12 individual cells. f Extracellular microlaser (white arrow) on top of an adult CM. Scale bar 30 µm. g ηext trace of a spontaneously beating neonatal CM during administration of 500 nM nifedipine (black arrow). Reproduced from ref.
Fig. 7
Fig. 7. Long-term tracking of 3T3 fibroblast cells over several cell generations using internalised lipofectamine-treated polystyrene active microresonators. Mother cells are denoted A (red), and subsequent daughter generations are labelled B (blue), C (violet) and D (orange).
a Left: differential interference contrast (DIC) images of a WGM laser within a migrating cell before, during, and after three cycles of cellular division. The time stamps indicated in the images are in hours:minutes and represent the period elapsed after the first lasing spectrum. Right: lasing spectra of the WGM resonator recorded during the migratory period, i.e., between cell division events. Arrows mark the free spectral range (FSR) between two neighbouring TE modes. b Left: tagging of both daughter cells (B1 and B2) from a mother cell carrying two intracellular lasers (R1 and R2). Right: lasing spectra of resonators inside the mother cell (centre, recorded separately for each resonator but plotted together) and after cell division (top/bottom). All DIC images show an area of 100 × 100 μm2. Reproduced from ref.
Fig. 8
Fig. 8. Intracellular microcavities used for tagging and intracellular sensing of relevant parameters in HeLa cells.
a Bright-field image of a HeLa cell after internalisation of a polystyrene fluorescent bead. b Processed image of the cell in (a), where the false-colour intensity corresponds to the oscillating WGMs. c Calculated single-bead diameter map from confocal hyperspectral images corresponding to WGM output. d, e Images of bead-containing HeLa cells (d), and corresponding bead diameter map (e). f Time evolution of the resonant peak position for a bead inside a HeLa cell upon the addition of sodium chloride at t = 0; such exposure to a hypertonic solution produces cell volume shrinkage, which in turn causes the concentrations in the cytoplasm to vary, affecting the refractive index, which produces a shift in the peak wavelength. Scale bars 10 μm. Reproduced from ref.

References

    1. Maiman TH. Stimulated optical radiation in ruby. Nature. 1960;187:493–494. doi: 10.1038/187493a0. - DOI
    1. Glauber RJ. The quantum theory of optical coherence. Phys. Rev. 1963;130:2529–2539. doi: 10.1103/PhysRev.130.2529. - DOI
    1. Ready, J. F. Industrial Applications of Lasers. 2nd edn (Academic Press, London, 1997).
    1. Schubert M, et al. Lasing within live cells containing intracellular optical microresonators for barcode-type cell tagging and tracking. Nano Lett. 2015;15:5647–5652. doi: 10.1021/acs.nanolett.5b02491. - DOI - PubMed
    1. Schubert M, et al. Monitoring contractility in cardiac tissue with cellular resolution using biointegrated microlasers. Nat. Photonics. 2020;14:452–458. doi: 10.1038/s41566-020-0631-z. - DOI

LinkOut - more resources